

 PDF
PDF Citation
 Print
Print


INTRODUCTION
Cardiopulmonary exercise test (CPET) is a widely used tool to evaluate the physiological response associated with cardiopulmonary disease, and its clinical usefulness has recently been demonstrated in respiratory diseases.1 Physiological responses of metabolic, cardiovascular, and ventilation systems that affect exercise ability can be evaluated by CPET, thus aiding in the diagnosis and treatment of patients. CPET is useful in the evaluation of the therapeutic effect and prognosis of respiratory diseases and in the diagnosis of dyspnea with unknown cause.
Maximal oxygen uptake (VO2 max) is a useful index for the assessment of exercise capacity, as it can powerfully predict outcomes of cardiac and pulmonary disorders.234567 VO2 max can be directly measured by CPET. Exercise capacity indicated by VO2 max can help in estimating cardiopulmonary risk, thus making the selection of normal reference value essential for interpretation.8
Different race and countries have various reference values due to the influence of factors such as age, sex, physical activity, and ethnicity.9 The American Thoracic Society/American College of Chest Physicians (ATS/ACCP) recommends selecting proper reference value that reflects the characteristics of the population. Most reference values and prediction equations are available for the Caucasians only.10111213 In contrast, there are few reference values for the Asians141516 and no reference value of VO2 max for Koreans. There are no reliable exercise capacity equations for VO2 max applicable to Koreans. We therefore compared measured VO2 max and predicted VO2 max using exercise capacity equations.
METHODS
Study subjects
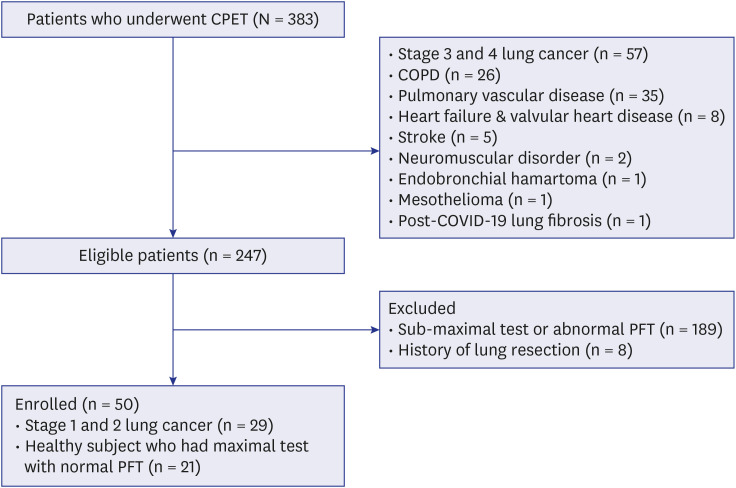
This retrospective study was performed between January 2020 and May 2021, including 383 patients who underwent CPET with incremental maximal cycle ergometer test at Asan Medical Center, a 2,700-bed tertiary care center in Korea. The study group primarily consisted of patients being evaluated for pre-operative risk of lung cancer or dyspnea. Of these 383 patients, we selected 29 stage 1 and 2 lung cancer patients with normal lung and cardiac function and 21 healthy subject who had maximal CPET (Fig. 1). Healthy subjects were tested for unexplained dyspnea, but had no underlying medical conditions and no abnormal findings on chest X-ray, electrocardiograph (ECG), spirometry, and CPET. Maximal CPET was defined as the fulfillment of at least one of the following conditions: 1) Patients reached predicted VO2 max (> 85% predicted), 2) patients achieved predicted maximal heart rate (> 90% predicted), 3) patients had evidence of ventilatory limitation (breathing reserve < 20%), or 4) patients exhaustion was observed (Borg scale rating 9–10). The exclusion criteria were as follows: (1) patients who had sub-maximal CPET; and (2) patients who had lung resection surgery. The physical activity extent was graded according to international physical activity questionnaire.17
CPET protocol
CPET were performed on graded exercise using incremental protocol with cycle ergometer (VIAsprint 150P; Carefusion, San Diego, CA, USA),12 under physician’s supervision with defined criteria for termination: ischemic ECG changes, fall in systolic pressure > 20 from peak during test, and severe desaturation. CPET had four stages: resting, warm-up, exercise, and recovery stage. In the resting stage, subjects rested for 2 minutes before the test. In the warm-up stage, we collected sufficient baseline data such as oxygen saturation, heart rate, blood pressures, ECG, and expired gas analysis. Subject performed unloaded pedaling at 30–40 rpm for 1 minute and 30 seconds. In the exercise stage, considering general condition or pulmonary function results, subjects performed maximal exercise with pedaling at 60 rpm while increasing the load to 5–15 watts/min. During exercise, Borg dyspnea scale was recorded for all subjects. The test was stopped on the subject’s wishes or in case of an abnormal finding in medical monitoring. If the subject requested discontinuation of the test, the subject proceeds to the recovery stage. Finally, in the recovery stage, the subjects performed unloaded pedaling at 30–40 rpm for 2 minutes and we acquired physiologic data such as oxygen saturation, heart rate, blood pressures, and expired gas analysis until subject’s heart rate is stable.
Predicted exercise capacity equations
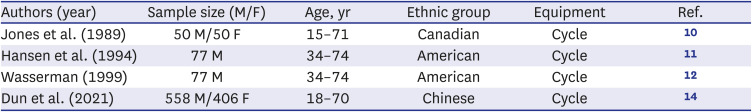
VO2 max was recalculated using different prediction equations. A detailed information of prediction equations is presented in Table 1.
Table 1
Main characteristics of predicted exercise capacity equations
| Authors (year) | Sample size (M/F) | Age, yr | Ethnic group | Equipment | Ref. |
|---|---|---|---|---|---|
| Jones et al. (1989) | 50 M/50 F | 15–71 | Canadian | Cycle | 10 |
| Hansen et al. (1994) | 77 M | 34–74 | American | Cycle | 11 |
| Wasserman (1999) | 77 M | 34–74 | American | Cycle | 12 |
| Dun et al. (2021) | 558 M/406 F | 18–70 | Chinese | Cycle | 14 |
Jones et al.10a
Hansen et al.11b
Wasserman12c
Dun et al.14d
aSex, male = 0, female = 1; age, years; height, centimeters.
b,cAge, years; Weight, kilograms. Predicted weight men: 0.78 × Height (cm) − 60.7, Predicted weight women: 0.65 × Height (cm) − 42.8, when actual weight > predicted, the predicted weight should be used in the equations.
dSex, male = 1, female = 2; age, years; height, centimeters.
Statistical analysis
Data are presented as mean ± SD for continuous variables and numbers (%) for categorical variables. Cardiopulmonary responses at maximal exercise between genders were analyzed by student’s t-test. We compared actual VO2 max with predicted VO2 max using repeated-measures ANOVA test with Bonferroni post hoc test. Bland-Altman test was applied to assess agreement between actual measured VO2 max and predicted VO2 max for each prediction equations. All tests were two-sided, and P value < 0.05 was considered statistically significant. We performed all analyses using SPSS software (version 24.0; SPSS, Chicago, IL, USA).
RESULTS
Clinical characteristics of study subject
In this study, 50 patients (mean age, 65 ± 13 years, 74% [37/50] males) fulfilled the enrolled criteria. Smoking history was noted: non-smokers, 19 (38%); current-smokers, 12 (24%); and ex-smokers, 19 (38%). The study group comprised of subjects with lung cancer (n = 29, 58%) and healthy person (n = 21, 42%). Of them, 4% were underweight (body mass index [BMI] < 18.5 kg/m2) and 28% were overweight (BMI > 25 kg/m2). The subjects resting respiratory function results were normal. Table 2 shows the gender-based characteristics of the study subjects.
Table 2
Baseline characteristics of patients

Values are expressed as the mean ± SD and activity level are graded by international physical activity questionnaire, which is expressed as percentage.
BMI = body mass index, FVC = forced vital capacity, FEV1 = forced expiratory volume in one second, VC = vital capacity, MVV = maximal voluntary ventilation.
Variables at maximal exercise
CPET results were as follows: absolute VO2 max, 1.2 ± 0.3 L/min; body weight referenced VO2 max, 20 ± 3.9 mL/kg/min; peak work rate, 94 ± 24 watts; peak heart rate, 142 ± 21 bpm; peak O2 pulse, 10 ± 3 mL/beat; minute ventilation, 59 ± 14 L/min; peak respiratory rate, 34 ± 6 breaths per minute; and peak breathing reserve, 41 ± 18%. VO2 max, peak work rate and peak O2 pulse were higher in male than in female, but not statistically significant (Table 3). Minute ventilation was significantly higher in male than in female. There were no statistically significant difference in VO2 max, peak heart rate, peak O2 pulse, minute ventilation and peak breathing reserve except for peak work rate and peak respiratory rate between lung cancer patients and healthy subjects (Table 4).
Table 3
Cardiopulmonary responses at maximal exercise on cycle ergometry in subjects
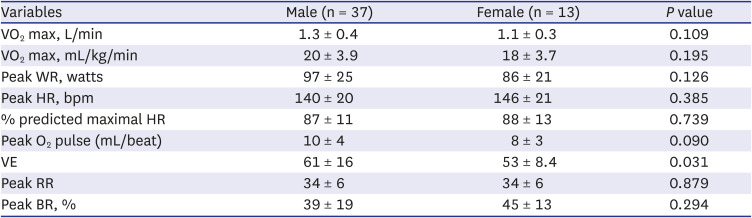
Table 4
Cardiopulmonary responses at maximal exercise on cycle ergometry between lung cancer patients and healthy subjects

Comparison between actual absolute VO2 max and predicted absolute VO2 max
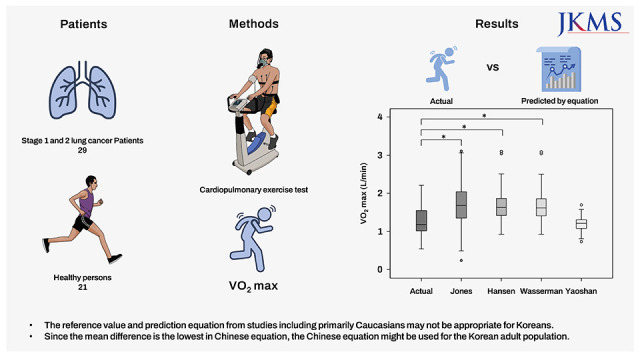
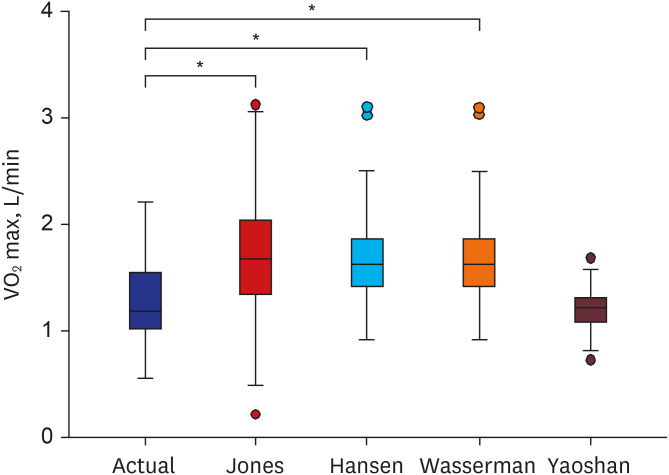
Fig. 2 illustrates the marked difference between actual and predicted absolute VO2 max (P < 0.001). Except for predicted absolute VO2 max using Yaoshan prediction equation developed using the Chinese equation, predicted absolute VO2 max were significantly overestimated compared with actual measured absolute VO2 max. Agreement using Bland-Altman test between actual absolute VO2 max and predicted absolute VO2 max was the best in Yaoshan equation (−0.03, 2SD = 0.55) compared to Jones (0.42, 2SD = 1.07), Hansen (0.44, 2SD = 0.86) and Wasserman (0.42, 2SD = 0.86) equations.
Fig. 2
Comparison of actual and predicted absolute VO2 max among subjects. Figure shows significant overestimation of predicted VO2 max compared with actual VO2 max in our population except for predicted VO2 max using Yaoshan equation.
*P < 0.001 for analysis of variance with Bonferroni post hoc pairwise analysis.
DISCUSSION
To the best of our knowledge, this is the first study to select fitted prediction equations for VO2 max by comparing actual absolute VO2 max and predicted absolute VO2 max in Korean adults. We showed that predicted absolute VO2 max using Yaoshan equation was similar to actual absolute VO2 max. Furthermore, most prediction equations for VO2 max developed by primarily Caucasian population overestimated VO2 max in our population.
The value of VO2 max is affected by many factors such as age, sex, height, weight, and physical activity. Thus, the ATS/ACCP for CPET recommends selecting proper reference value that reflects characteristics of their population tested.8 In our study, among various prediction equations, the Yaoshan equation developed using a Chinese population was the most suitable. Because the anthropometric features of Chinese population is similar to those of the Korean population, Yaoshan equation might be appropriate for VO2 max in our study. According to recommendations by ATS/ACCP for CPET, prediction equation by Jones et al.10 and Hansen et al.,11 which were two most generally used equations of reference values, should be applied clinically. However, in our study, predicted absolute VO2 max by Jones et al.10 and Hansen et al.11 was overestimated compared to the actual absolute VO2 max. As in our study, Ahmadian et al.18 showed significant overestimation of predicted VO2 max compared with actual VO2 max using prediction equations by Jones et al.10 and Hansen et al.11 It is necessary to select appropriate sets of reference values for each institution.
Because the most of prediction equation are based on weight and height, VO2 max is greatly affected by anthropometric characteristics. Anthropometric features such as weight and height of the Caucasian and Asian population are different. For example, height, weight and BMI of subjects in an Asian population14161920212223 were similar to those of the present study, but lower than those of primarily Caucasians.121318 As above, the predicted VO2 max using Yaoshan equation using the Asian population had good agreement with our study. The most plausible explanation for good agreement is that the anthropometric characteristics are similar. Therefore, when selecting reference value, it is important to select a reference value that reflects the characteristics of each population well.
In the present study, actual VO2 max was lower than that of other studies by Caucasian population.131824 This is consistent with a previous study that reported that VO2 max in an Asian-Indian population was lower than in a Caucasian population.25 It is crucial to apply reference values specific to different population as VO2 max are affected by ethnic groups. In addition to difference of height and weight, physiology of skeletal muscle, parenchymal lung and chest wall anatomy could have affected to exercise capacity from other ethnicities. In some study with Asian population, lung volumes such as total lung capacity and functional residual capacity are lower than those for Caucasian population.2627
The limitations of this study must be considered. First, this was a retrospective study conducted in a single tertiary referral center in Korea. Because the anthropometric characteristics of subjects may differ depending on the regions of residence, our results cannot be readily applied to the general population in Korea. Second, the possibility of selection bias should be considered because the study population included healthy subjects and early lung cancer patients. The study population may be less healthy than the general population. But early lung cancer patients had normal lung function and normal cardiopulmonary function. Third, most of the enrolled patients were elderly. Fourth, the sex ratio in this study was not 1:1 and the number of included subjects was small. The results of our study may not be generalized to the general population because the number of patients was small, study population is mainly older people, and gender ratio is not 1:1. Further multicenter studies with larger numbers of subject and subjects with all age ranges are warranted to validate our results.
In conclusion, most prediction equations for VO2 max based on Caucasian population yield overestimated VO2 max compared with actual VO2 max. The predicted VO2 max using equation developed using the Chinese population was similar to actual VO2 max. These results imply that the reference value and prediction equation from studies in which populations were primarily Caucasians may not be appropriate for Koreans. Since the mean difference is the lowest in Chinese equation, the Chinese equation might be used for the Korean adult population.
 XML Download