

 PDF
PDF Citation
 Print
Print


INTRODUCTION
The coronavirus disease 2019 (COVID-19) pandemic has tremendously strained people’s socio-economic lives worldwide since its emergence on March 11, 2020. Consequently, governments have been enforcing multiple public health measures, such as social or physical distancing, self-quarantines, and lockdowns. Similarly, the South Korean government issued a strict social distancing policy, since the incidence rate peaked on February 29, 2020.12 Several previous studies have highlighted the concerns regarding the negative effects of such nationwide quarantines on public mental health.34 People become vulnerable to emotional distress—and by extension to anxiety and depressive disorders—when they encounter medical emergencies, such as a fatal virus outbreak.5 Major depressive disorder (MDD) is a particularly complex and multidimensional mental health condition related to quality of life67; thus, it is noteworthy to examine the effects of the pandemic on the prevalence rate of depressive disorders among the general population. Ettman et al.8 reported that the prevalence of depressive symptoms in the United States increased amidst the COVID-19 pandemic. Also, according to Ha et al.,9 COVID-19 elevated the level of depression and decreased the quality of life among Koreans.
Historically, quarantine is one of the most widely implemented strategies to combat disease outbreak; however, it has been found to have considerable negative effects on people’s mental health.3 Seong and Kim10 reported that the restriction of interpersonal contact, such as social distancing, significantly affected mental health, leading to Corona-Blue. Several existing studies on the association between mental health and the COVID-19 pandemic have heavily relied on surveys completed by non-representative sub-populations.9101112 Therefore, there is an urgent need for developing an assessment tool for evaluating public mental health status.
For this purpose, some studies explored the utility of relative search volumes (RSVs) as a real-time surveillance tool for public health issues, including mental health problems.131415 These studies majorly employed the RSV data available on Google Trends—a Google operated open source database; the studies reported that search volumes for depression did not increase after the declaration of the COVID-19 pandemic, and they are not correlated with the number of deaths.13141516 However, it has been shown that home-confinement measures—stay-at-home orders and quarantine—result in emotional consequences, such as depression.258 Thus, Google Trends’ findings contradict the general conclusion derived by empirical literature.
We speculate that there were two main problems in the methodology of past studies: 1) selecting MeSH terms for search terms; 2) using short-term datasets for interrupted time-series analysis (ITSA). Previous studies that insist Google Trends data is not a useful indicator for mental health status selected MeSH terms such as depression, anxiety, and suicide for their search terms. Most people do not transform their symptoms into MeSH terms for their Internet search. Rather, people type in their actual physical symptoms in the search box to obtain information from the Internet. Thus, further study that does not use MeSH terms is needed to investigate if Google Trends data truly contradicts with existing empirical literature. Moreover, previous ITSA used data for less than a year.1415 Since mental illness gradually appears on the surface, a sufficiently long period of data should be obtained.
We also speculate that there are two limitations of Google Trends itself; 1) Unavailability of Google Trends datasets in sex breakdown; 2) Low popularization of Google in South Korea. According to Knipe et al.,16 Google Trends data is not a useful indicator of changing mental health condition due to its limitation in unavailability of sex breakdown data. In contrary to Google Trends, Naver Trends (https://datalab.naver.com/keyword/trendSearch.naver) provides breakdown of datasets by gender and can run separate models for each. This allows for more detailed analyses. According to Internet Trends, from January 2016 to December 2020, Google ranked second in the number of Internet search engine visits with 16.65%.17 Meanwhile, Naver (http://www.naver.com), the most frequently used search engine in Korea, ranked first with 71.21%. Thus, Naver Trends is a more advanced and appropriate data source in that it is likely to reflect South Korean’s interest more than Google Trends.
Therefore, our study aimed to: 1) observe any changes in the number of searches related to MDD symptoms, as per the intensity of the social distancing measures, and 2) explore any impact of the COVID-19 pandemic and social distancing measures on the mental health of the Korean population in regards to MDD.
METHODS
Data acquisition
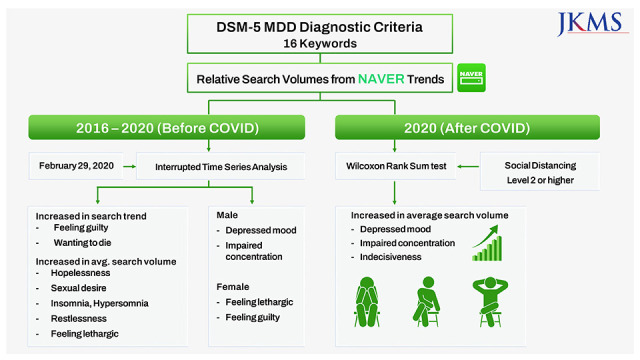
Data were obtained from Naver Trends (https://datalab.naver.com/keyword/trendSearch.naver). A total of 16 Korean search terms were selected using the Diagnostic and Statistical Manual of Mental Disorders (DSM)-5 criteria for MDD (Supplementary Table 1).18 Data collected from January 1, 2016 to December 31, 2020 were analyzed in this study. RSV is a relative percentage calculated where the largest search is set at 100% during the period of interest. Three separate datasets were obtained for each keyword using the daily RSV data of the overall, male, and female populations, respectively. Furthermore, Spearman correlation analysis was performed using another dataset of total COVID-19 confirmed case numbers observed from January 1 to December 31, 2020 in Korea, and Wilcoxon rank sum test was performed to compare these data for the intensity of social distancing measures, categorized as < level 2 and ≥ level 2. The total number of confirmed COVID-19 cases in Korea were obtained from Statistics Korea—a government-run organization that publishes national statistics officially (https://kosis.kr/covid_eng/covid_index.do).19
Statistical analysis
We performed an ITSA to investigate the associations between RSVs of MDD symptoms and COVID-19 protective measures. Additionally, we performed Wilcoxon rank sum tests to analyze the changes in RSVs depending on the intensity of the social distancing measures in 2020. Spearman correlation analyses were conducted to determine the relationship between total COVID-19 confirmed cases and RSVs in 2020.
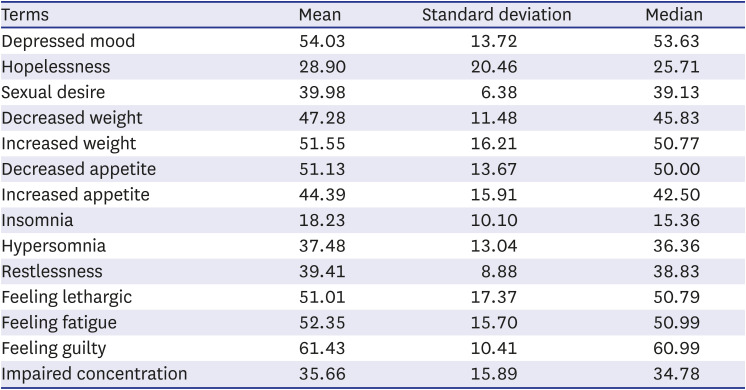
The highest and lowest values of the initial daily RSV dataset were 100 and 0 (no searches), respectively. Daily RSVs were converted to weekly RSVs using the epidemiological week (EPI week) calendar, and we calculated the weekly mean RSVs, because Naver Trends’ weekly data does not follow the EPI week calendar. We chose February 29, 2020 (yearly EPI week 9) as our event date, which was the initial date of implementing social distancing measures and reaching a count of 909 confirmed cases in a single day. Furthermore, we performed descriptive analyses on the 16 keywords to summarize the data and determine the type of distribution (Tables 1 and 2). ITSA was performed using a Gaussian model, and we ran Durbin-Watson tests to assess autocorrelation. All search terms reported autocorrelations; thus, we incorporated an autoregressive integrated moving average (ARIMA) (p,d,q) model.20
Table 1
Descriptive statistics for the search terms’ weekly relative search volumes (RSVs) from January 1, 2016–December 31, 2020 (Number of weekly RSVs = 262)
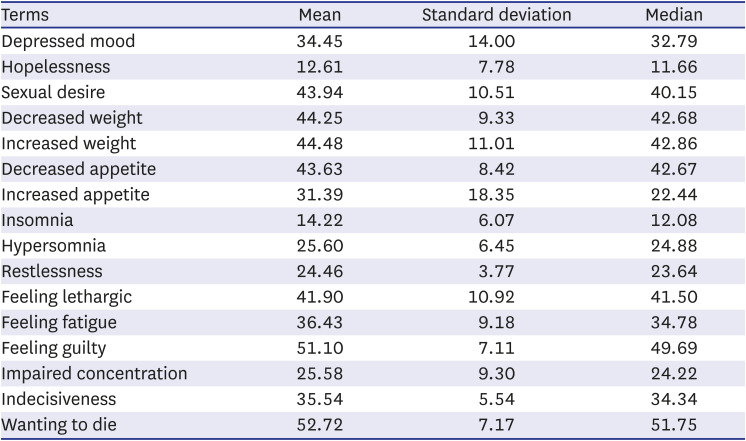
Table 2
Descriptive statistics for the search terms’ daily relative search volumes (RSVs) from January 1, 2016–December 31, 2020 (Number of daily RSVs = 366)
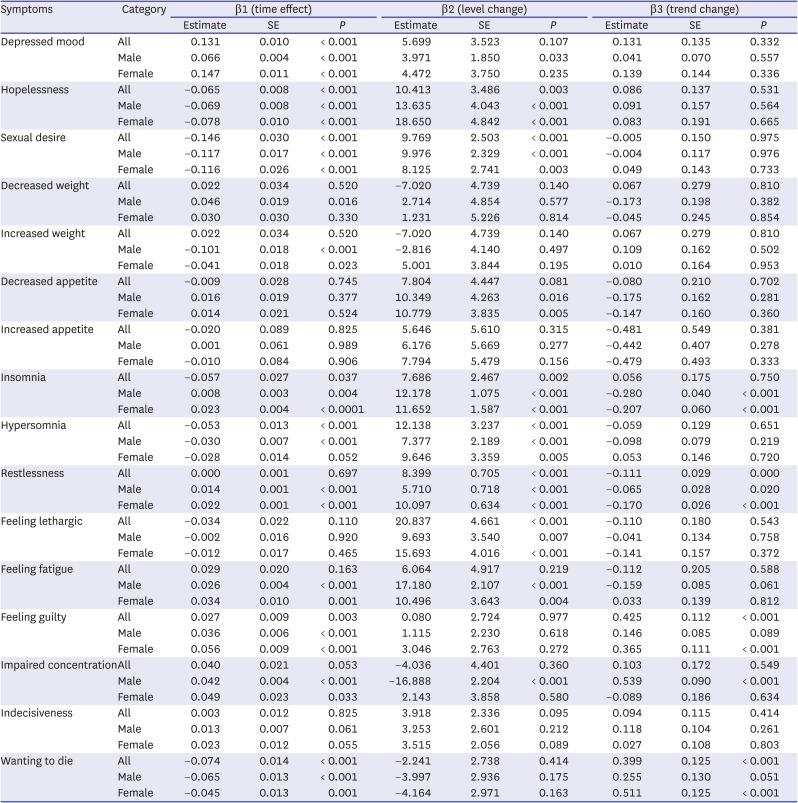
Here, ITSA coefficients indicated time effect (β1), level change (β2), and trend change (β3). Since the daily datasets were converted into weekly data, the ARIMA model was constructed with a lag order of 52.
We used R version 1.4.1103 for most statistical analysis, while ITSA—including the ARIMA model and Spearman correlation analyses—were conducted using SAS version 9.4 (SAS Institute, Cary, NC, USA). Statistical significance was set at P < 0.05.
RESULTS
Keyword search volume trends
After the implementation of social distancing measures, a significant increase was observed in the RSVs of ‘feeling guilty’ (β3 = 0.425, P < 0.001) and ‘wanting to die’ (β3 = 0.399, P = 0.002). ‘Hopelessness’ (β2 = 10.413, P = 0.003), ‘sexual desire’ (β2 = 9.769, P < 0.001), ‘insomnia’ (β2 = 7.686, P = 0.002), ‘hypersomnia’ (β2 = 12.138, P < 0.001), ‘restlessness’ (β2 = 8.399, P < 0.001), and ‘feeling lethargic’ (β2 = 20.837, P < 0.001) also showed an increase in mean search volumes. Additionally, gender analysis indicated that the average search volume of ‘depressed mood’ (β2 = 3.971, P = 0.033) and the trend of ‘impaired concentration’ (β3 = 0.539, P < 0.001) significantly increased only in males. Conversely, the search volumes for ‘feeling guilty’ (β3 = 0.365, P = 0.001) and ‘wanting to die’ (β3 = 0.511, P < 0.001) increased significantly only in females (Table 3).
Table 3
Estimated coefficients from interrupted time-series analysis using an autoregressive integrated moving average model
Relationship between search term volumes and daily total COVID-19 cases
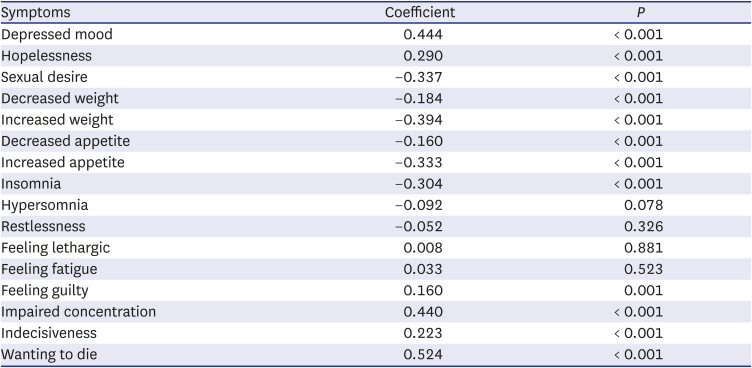
The RSVs of ‘depressed mood’ (r = 0.44399, P < 0.001), ‘hopelessness’ (r = 0.29013, P < 0.001), ‘feeling guilty’ (r = 0.16007, P = 0.001), ‘impaired concentration’ (r = 0.43961, P < 0.001), ‘indecisiveness’ (r = 0.22344, P < 0.001), and ‘wanting to die’ (r = 0.52447, P < 0.001) were positively correlated with the daily total of COVID-19 cases (Table 4). Conversely, the RSVs of ‘sexual desire’ (r = −0.34, P < 0.001), decreased weight (r = −0.18, P < 0.001), increased weight (r = −0.39373, P < 0.001), decreased appetite (r = −0.16040, P = 0.001), increased appetite (r = −0.33318, P < 0.001), and ‘insomnia’ (r = −0.30444, P < 0.001) were negatively correlated with the daily total of COVID-19 cases. However, the RSVs of ‘hypersomnia,’ ‘restlessness,’ ‘feeling lethargic,’ and feeling fatigue reported no statistically significant correlations.
Table 4
Correlation coefficients between internet relative search volumes of each depressive symptom and number of total coronavirus disease 2019 confirmed cases from January 1–December 31, 2020
Search volumes according to intensity of social distancing measures
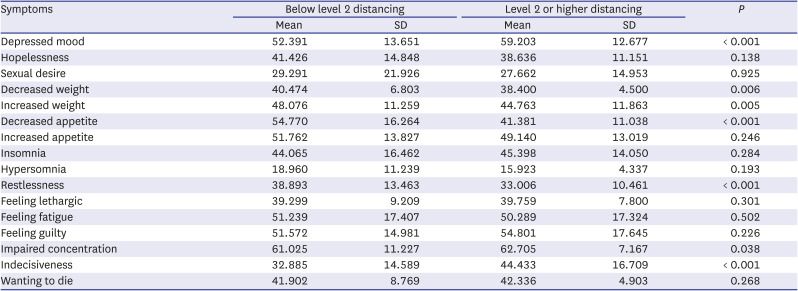
We compared the RSVs for all terms between the periods of implementing < level 2 and ≥ level 2 social distancing measures, and found that the mean RSVs of ‘depressed mood,’ ‘feeling guilty,’ ‘impaired concentration’ and ‘wanting to die’ were significantly higher when ≥ level 2 social distancing measures were enforced (Table 5).
Table 5
Difference of internet relative search volumes of each symptom by the level of social distancing measures
DISCUSSION
This study found a discrepancy in the previously analyzed Google Trends search trends for depression after the COVID-19 pandemic. While past studies suggested that Internet search trends of terms related to depression had not shown significant changes in relation to the COVID-19 deaths,131415 our study showed increased search trends of ‘feeling guilty’ and ‘wanting to die’ and increased average search volumes for ‘hopelessness,’ ‘sexual desire,’ ‘insomnia,’ ‘hypersomnia,’ ‘restlessness,’ and ‘feeling lethargic’ as the pandemic progressed. We speculate that this discrepancy may have arisen due to the analyses of depression search volumes, rather than those of depressive mood; we contemplate that individuals use keywords outlining their actual physical symptoms instead of the scientific MeSH terms when searching. Moreover, previous studies1415 employed datasets encompassing data obtained over less than a year, which was not suitable for ITSA because a mental health issue develops as a gradual and unconscious process, rather than an immediate consequence of a specific event. Therefore, our study analyzed the data spanning over 5 years, of which 10 months were after the event. Also, another possible explanation of such discrepancy could be linked to the cultural differences between the target populations. Our study specifically focuses on the South Korean public while previous studies did not.
Knipe et al.16 highlighted the lack of utility of Google Trends as an indicator of public mental health changes amidst a health crisis, as it does not account for sex or age differences. However, Naver Trends categorizes RSVs by sex, enabling further investigations regarding the sex differences in susceptibility to mental disorders. Moreover, Naver Trends represents the entire Korean population as Naver is the primary search engine with 71.21% of Internet search share.17 Thus, the present study used Naver Trends instead of Google Trends, as most Koreans prefer the former, unless they require academic knowledge.
Since 2001, investigations on public mental health have largely relied on the Survey of Mental Disorder reported by the Ministry of Health and Welfare every five years in South Korea. The survey is used as a basic data for mental health policy establishment by grasping the status of public mental illness. However, the data requires attention in interpretation as it is a survey of 5,500 people in the age of 18 to 79.21 The survey is also not suitable for a real-time surveillance tool because it is announced every five years. Internet search trends is a more prompt means of monitoring mental health, as it is based on the widespread use of smartphones and PCs and updated instantaneously. According to Pew Research Center, the United States marketing research firm, Korea ranks first in the world with a 95% smartphone penetration rate.22 As reported by Massaro and Kim, 95.9% of Koreans are registered Internet users and 118% of the population have mobile connection.23
RSV is widely used in health care research such as influenza, cardiovascular disease, and behavioral forecast of national suicide rates.242526 RSV is superior to the survey conducted by the Ministry of Health and Welfare in evaluating the status of national mental health. Moreover, RSV provided by Internet search trends includes all ages and has the advantage of being able to obtain data at any time and set the setting period as desired by the researcher. This would allow for a better representation of the general public compared to the traditional survey on the population aged 18 to 79.21
This study suggested that the restriction on social activities negatively affected the mental health status of the Korean population, as reflected by the average search volumes and the trends within Internet search volumes. The RSV data offered by Naver Trends represents the potential mental health consequences of the COVID-19 pandemic. The current study results provide insight into the role of Naver Trends as a potential tool to predict the incidences of diseases and to track the long-term impact of the COVID-19 pandemic.
However, this study has several limitations. First, the findings should be interpreted and generalized with caution because the initial data of the Internet search volumes were not the raw data. Rather, they were relatively calculated. Therefore, the data may contain outliers, due to the effect of specific social events or media broadcasts on RSVs. Thus, once the raw data become publicly available by Naver Trends, another study is needed to confirm these findings further. Second, RSVs may be inadequate as an independent tool to understand individual thoughts, as it is impossible to understand the reason for every search. Compared with the traditional data collection method, RSV is only an indirect indicator to evaluate how psychological health is changing within society. Third, the selection method of search terms is not standardized. This study selected search terms that were more likely to be searched on the Internet by the public instead of using scientific MeSH terms. This study has a limitation of not including analyses of all possible search terms. The authors used DSM-5 diagnostic criteria to select search terms that were more symptom-specific. However, the DSM-5 diagnostic criteria can be interpreted into different search terms; for instance, depressed people could have searched for depression instead of ‘depressed mood.’ Also, the term ‘sexual desire’ was selected for analysis, because when our study extracted data on decreased ‘sexual desire,’ RSV was zero in most days, meaning that the search trends were incomparable. Thus, we analyzed ‘sexual desire’ due to the lack of absolute search volumes in decreased ‘sexual desire.’ Lastly, RSV could have been affected by other factors besides the COVID-19 outbreak, including seasonal patterns and social events. The RSVs of all search terms were found to have autocorrelation, meaning that they did follow seasonal patterns, so we used the ARIMA model to remove autocorrelation to improve accuracy of the ITSA. However, it was technically impractical to track every social event, such as a celebrity suicide, and take its impact on RSVs into account. To overcome this limitation, our study analyzed the RSV data for 5 years, a longer setting period compared with previous studies, expecting that this would even out short-term impacts of such incidents on RSVs.
In conclusion, there were significant changes in Naver search trends of the terms related to MDD symptoms along with the social distancing measures and the number of daily COVID-19 cases. Such changes were most notable in terms ‘feeling guilty’ and ‘wanting to die.’ The current study results based on Naver Trends data are consistent with existing empirical literature reporting an increased risk of depression following the COVID-19 pandemic. Therefore, Naver Trends could be utilized for monitoring of the Korean public mental health, especially when real-time surveillance of the public mental health and interest is needed.
 XML Download