INTRODUCTION
METHODS
Source of data
Study population and design
Anthropometric and laboratory measurements
Classification of change in physical activity
Definition of HF and comorbidities
Statistical analysis
RESULTS
Baseline characteristics
Table 1.
| Characteristic | Total |
Continuity of physical activity |
P value | ||||
|---|---|---|---|---|---|---|---|
| Continuously physically inactive | Physically active to inactive | Physically inactive to active | Continuously physically active | ||||
| Number | 132,418 | 85,733 | 14,259 | 20,986 | 11,440 | ||
| Age, yr | 57.7±9.58 | 57.54±9.79 | 59.03±9.3 | 57.15±9.11 | 58.2±8.98 | <0.0001 | |
| Male sex | 84,504 (63.8) | 52,586 (61.3) | 9,289 (65.1) | 14,144 (67.4) | 8,485 (74.2) | <0.0001 | |
| Smoking status | <0.0001 | ||||||
| Never smoker | 68,930 (52.1) | 45,522 (53.1) | 7,675 (53.8) | 10,416 (49.6) | 5,317 (46.5) | ||
| Former smoker | 31,019 (23.4) | 17,866 (20.8) | 3,433 (24.1) | 5,908 (28.2) | 3,812 (33.3) | ||
| Current smoker | 32,469 (24.5) | 22,345 (26.1) | 3,151 (22.1) | 4,662 (22.2) | 2,311 (20.2) | ||
| Alcohol drinking | <0.0001 | ||||||
| Never | 71,159 (53.7) | 47,205 (55.1) | 7,741 (54.3) | 10,903 (52.0) | 5,310 (46.4) | ||
| Mild (<30 g/day) | 48,761 (36.8) | 30,371 (35.4) | 5,263 (36.9) | 8,209 (39.1) | 4,918 (43.0) | ||
| Heavy (≥30 g/day) | 12,498 (9.4) | 8,157 (9.5) | 1,255 (8.8) | 1,874 (8.9) | 1,212 (10.6) | ||
| Household incomea | 33,030 (24.9) | 21,808 (25.4) | 3,640 (25.5) | 5,056 (24.1) | 2,526 (22.1) | <0.0001 | |
| Residential area (urban) | 59,136 (44.7) | 36,939 (43.1) | 6,559 (46.0) | 9,935 (47.4) | 5,703 (49.9) | <0.0001 | |
| CKD | 7,986 (6.0) | 5,212 (6.1) | 958 (6.7) | 1,143 (5.5) | 673 (5.9) | <0.0001 | |
| Dyslipidemia | 68,022 (51.4) | 44,649 (52.1) | 7,304 (51.2) | 10,472 (50.0) | 5,597 (48.9) | <0.0001 | |
| Hypertension | 74,235 (56.1) | 48,081 (56.1) | 8,366 (58.7) | 11,322 (54.0) | 6,466 (56.5) | <0.0001 | |
| Strokeb | 1,465 (1.1) | 923 (1.1) | 168 (1.2) | 245 (1.2) | 129 (1.1) | 0.5459 | |
| MIc | 1,851 (1.4) | 1,199 (1.4) | 188 (1.3) | 303 (1.4) | 161 (1.4) | 0.8057 | |
| CVDd | 3,249 (2.5) | 2,080 (2.4) | 346 (2.4) | 541 (2.6) | 282 (2.5) | 0.6425 | |
| No. of oral antidiabetic drugse | <0.0001 | ||||||
| 1 | 54,362 (41.1) | 34,381 (40.1) | 6,031 (42.3) | 8,760 (41.7) | 5,190 (45.4) | ||
| 2 | 58,579 (44.2) | 38,315 (44.7) | 6,194 (43.4) | 9,204 (43.9) | 4,866 (42.5) | ||
| ≥3 | 19,477 (14.7) | 13,037 (15.2) | 2,034 (14.3) | 3,022 (14.4) | 1,384 (12.1) | ||
| Use of insulinf | 10,514 (7.9) | 6,849 (8.0) | 1,160 (8.1) | 1,701 (8.1) | 804 (7.0) | 0.0002 | |
| Fasting blood glucose, mg/dL | 163.9±43.32 | 164.8±44.01 | 160.9±40.76 | 164.5±43.78 | 159.7±39.76 | <0.0001 | |
| Body weight, kg | 68.6±11.16 | 68.4±11.34 | 68.4±10.88 | 69.1±10.89 | 69.5±10.47 | <0.0001 | |
| Waist circumference, cm | 85.7±8.3 | 85.9±8.42 | 85.7±8.25 | 85.1±8.08 | 85.1±7.79 | <0.0001 | |
| Abdominal obesityg | 61,716 (46.6) | 42,004 (49.0) | 6,588 (46.2) | 8,773 (41.8) | 4,351 (38.0) | <0.0001 | |
| BMI, kg/m2 | 25.6±3.18 | 25.7±3.26 | 25.5±3.09 | 25.6±3.08 | 25.4±2.92 | <0.0001 | |
| BMI ≥25 kg/m2 | 67,116 (50.7) | 44,403 (51.8) | 7,081 (49.7) | 10,225 (48.7) | 5,407 (47.3) | <0.0001 | |
| SBP, mm Hg | 129.9±15.46 | 129.8±15.61 | 129.9±15.27 | 129.9±15.29 | 130.1±14.85 | 0.2447 | |
| DBP, mm Hg | 80.7±10.13 | 80.7±10.2 | 80.4±9.97 | 80.8±10.09 | 80.7±9.86 | 0.0004 | |
| Total cholesterol, mg/dL | 213.8±41.66 | 214.6±41.95 | 211.3±40.99 | 214.1±41.39 | 210.3±40.49 | <0.0001 | |
| ALTh, IU/L | 27.8 (27.8–27.9) | 28.1 (28.0–28.2) | 27.9 (27.7–28.2) | 27.0 (26.8–27.2) | 27.1 (26.8–27.3) | <0.0001 | |
| ASTh, IU/L | 27.2 (27.1–27.2) | 27.2 (27.1–27.3) | 27.3 (27.2–27.5) | 26.7 (26.6–26.9) | 27.2 (27.0–27.4) | <0.0001 | |
Values are presented as mean±standard deviation, number (%), or median (interquartile range).
CKD, chronic kidney disease; MI, myocardial infarction; CVD, cardiovascular disease; BMI, body mass index; SBP, systolic blood pressure; DBP, diastolic blood pressure; ALT, alanine aminotransferase; AST, aspartate transaminase.
Risk for incident HF according to the intensity of physical activity during follow-up
Table 2.
| Variable | Number | CHF | Duration | IR (1,000 person-years) |
HR (95% CI) |
||||
|---|---|---|---|---|---|---|---|---|---|
| Model 1 | Model 2 | Model 3 | Model 4 | ||||||
| Regular exercisea | |||||||||
| No | 99,992 | 1,072 | 481,952.14 | 2.2 | 1 (reference) | 1 (reference) | 1 (reference) | 1 (reference) | |
| Yes | 32,426 | 249 | 157,358.01 | 1.6 | 0.77 (0.67–0.89) | 0.78 (0.68–0.89) | 0.79 (0.69–0.91) | 0.79 (0.69–0.91) | |
| Intensity of exercise | |||||||||
| Vigorousb | |||||||||
| No | 105,262 | 1,119 | 507,567.75 | 2.2 | 1 (reference) | 1 (reference) | 1 (reference) | 1 (reference) | |
| Yes | 27,156 | 202 | 131,742.41 | 1.5 | 0.79 (0.68–0.92) | 0.80 (0.69–0.93) | 0.81 (0.69–0.94) | 0.81 (0.70–0.95) | |
| Moderatec | |||||||||
| No | 118,265 | 1,204 | 570,540.71 | 2.1 | 1 (reference) | 1 (reference) | 1 (reference) | 1 (reference) | |
| Yes | 14,153 | 117 | 68,769.44 | 1.7 | 0.76 (0.63–0.92) | 0.76 (0.63–0.92) | 0.79 (0.65–0.95) | 0.79 (0.65–0.95) | |
| Walkingd | |||||||||
| No | 92,554 | 947 | 446,895.47 | 2.1 | 1 (reference) | 1 (reference) | 1 (reference) | 1 (reference) | |
| Yes | 39,864 | 374 | 192,414.68 | 1.9 | 0.81 (0.71–0.91) | 0.81 (0.72–0.91) | 0.83 (0.73–0.93) | 0.83 (0.73–0.93) | |
Model 1: Adjusted for age and sex; Model 2: Adjusted model 1+current smoking, alcohol, and income; Model 3: Adjusted model 2+body mass index, hypertension, dyslipidemia, chronic kidney disease (CKD), stroke, and myocardial infarction (MI); Model 4: Adjusted model 2+waist circumference, hypertension, dyslipidemia, CKD, stroke, MI, and fasting blood glucose.
CHF, congestive heart failure; IR, incidence rate; HR, hazard ratio; CI, confidence interval.
a Regular exercise was defined as performing at least 30 minutes of moderate-intensity physical activity at least five times per week or at least 20 minutes of strenuous physical activity at least three times per week. Each participant was asked to report their weekly physical activity levels according to three categories: vigorous, moderate, and walking,
b Vigorous intensity was defined as at least 20 minutes of exercise per day (e.g., running, aerobic, or fast cycling at least three times per week),
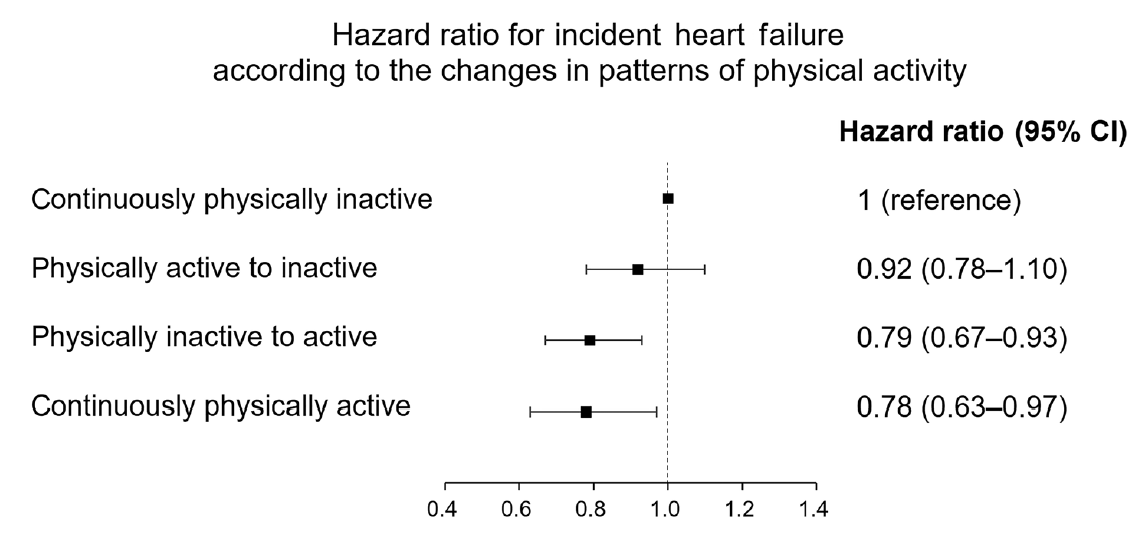
Risk for incident HF according to changes in the pattern of physical activity
Fig. 1.

Subgroup analyses
Table 3.
| Variable |
Continuity of physical activity |
P value for interaction | |||
|---|---|---|---|---|---|
| Continuously physically inactive | Physically active to inactive | Physically inactive to active | Continuously physically active | ||
| Age, yr | 0.6837 | ||||
| <65 | 1 (reference) | 1.02 (0.78–1.33) | 0.81 (0.63–1.04) | 0.72 (0.51–1.02) | |
| ≥65 | 1 (reference) | 0.87 (0.69–1.09) | 0.79 (0.62–0.99) | 0.84 (0.63–1.12) | |
| Sex | 0.0216 | ||||
| Male | 1 (reference) | 1.10 (0.89–1.36) | 0.81 (0.66–1.01) | 0.70 (0.53–0.92) | |
| Female | 1 (reference) | 0.68 (0.50–0.92) | 0.76 (0.58–1.00) | 1.001 (0.70–1.44) | |
| Hypertension | 0.6907 | ||||
| No | 1 (reference) | 0.79 (0.53–1.16) | 0.73 (0.52–1.03) | 0.86 (0.56–1.31) | |
| Yes | 1 (reference) | 0.96 (0.79–1.17) | 0.81 (0.66–0.98) | 0.75 (0.58–0.97) | |
| Dyslipidemia | 0.3024 | ||||
| No | 1 (reference) | 0.77 (0.58–1.02) | 0.70 (0.54–0.91) | 0.76 (0.55–1.06) | |
| Yes | 1 (reference) | 1.05 (0.84–1.30) | 0.86 (0.69–1.07) | 0.79 (0.59–1.06) | |
| CKD | 0.6063 | ||||
| No | 1 (reference) | 0.93 (0.77–1.12) | 0.78 (0.65–0.94) | 0.73 (0.57–0.93) | |
| Yes | 1 (reference) | 0.85 (0.54–1.33) | 0.80 (0.52–1.24) | 1.06 (0.63–1.78) | |
| CVD | 0.6556 | ||||
| No | 1 (reference) | 0.94 (0.78–1.12) | 0.77 (0.65–0.92) | 0.77 (0.61–0.96) | |
| Yes | 1 (reference) | 0.74 (0.35–1.55) | 1.02 (0.57–1.79) | 0.99 (0.45–2.18) | |
| Obesitya | 0.5058 | ||||
| No | 1 (reference) | 0.81 (0.62–1.05) | 0.75 (0.59–0.96) | 0.70 (0.50–0.96) | |
| Yes | 1 (reference) | 1.04 (0.83–1.31) | 0.83 (0.66–1.04) | 0.87 (0.65–1.18) | |
| Weight changeb | 0.4933 | ||||
| Gain | 1 (reference) | 0.96 (0.67–1.39) | 1.03 (0.75–1.41) | 0.73 (0.45–1.19) | |
| Stable | 1 (reference) | 0.96 (0.78–1.18) | 0.72 (0.58–0.89) | 0.79 (0.60–1.02) | |
| Loss | 1 (reference) | 0.70 (0.39–1.24) | 0.68 (0.40–1.15) | 0.87 (0.45–1.67) | |
| Malignancy | 0.1431 | ||||
| No | 1 (reference) | 0.90 (0.75–1.07) | 0.79 (0.66–0.93) | 0.74 (0.59–0.93) | |
| Yes | 1 (reference) | 1.39 (0.70–2.73) | 0.85 (0.40–1.84) | 1.47 (0.70–3.08) | |
Adjusted for age, sex, current smoking, alcohol, income, waist circumference, hypertension, dyslipidemia, CKD, stroke, myocardial infarction, and fasting blood glucose.
CKD, chronic kidney disease; CVD, cardiovascular disease.
a The body mass index cutoff of 25 kg/m2 was used to define obesity in the Korean population in this study,
b Weight change was calculated for each subject as the difference in weight between the follow-up health examination and baseline examination and divided into three categories: stable, gain or loss of less than 5% of body weight at baseline; gain, gain of 5% or more of body weight at baseline; loss, loss of 5% or more of body weight at baseline.


 PDF
PDF Citation
 Print
Print


 XML Download