Abstract
Background
Methods
Results
Conclusion
Supplementary Materials
Supplementary Table 1.
Supplementary Table 2.
Supplementary Table 3.
Supplementary Table 4.
Supplementary Table 5.
Supplementary Table 6.
Supplementary Table 7.
Supplementary Table 8.
Notes
ACKNOWLEDGMENTS
REFERENCES
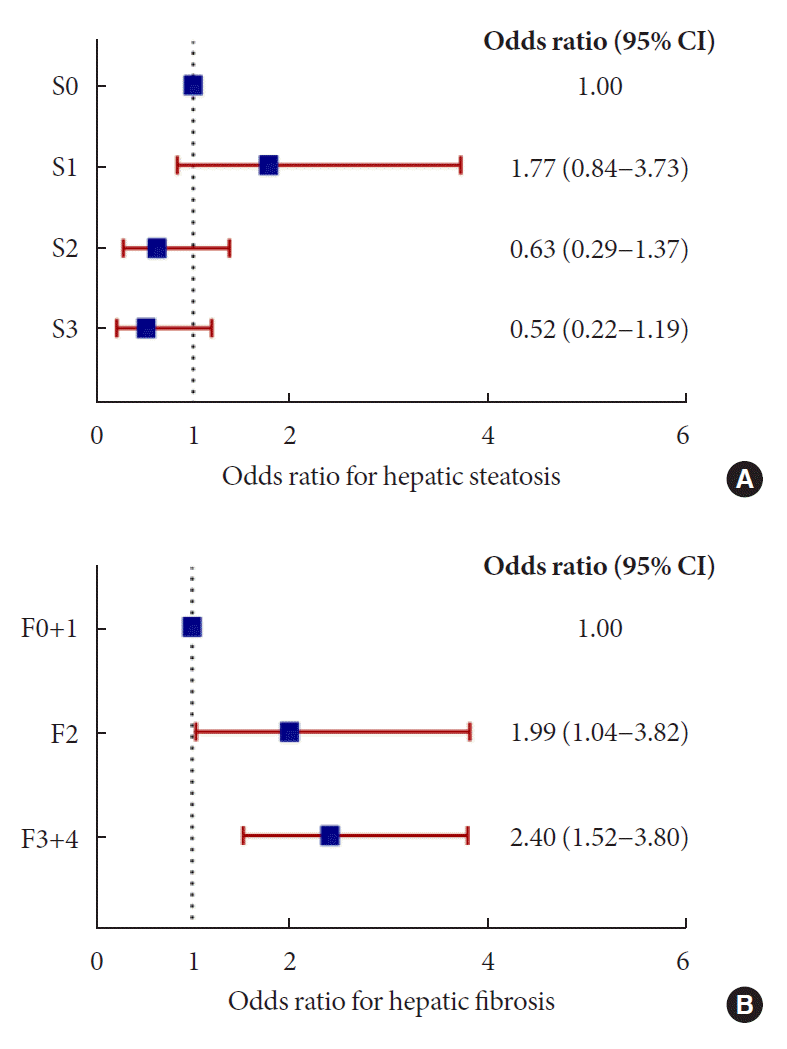
Fig. 1.

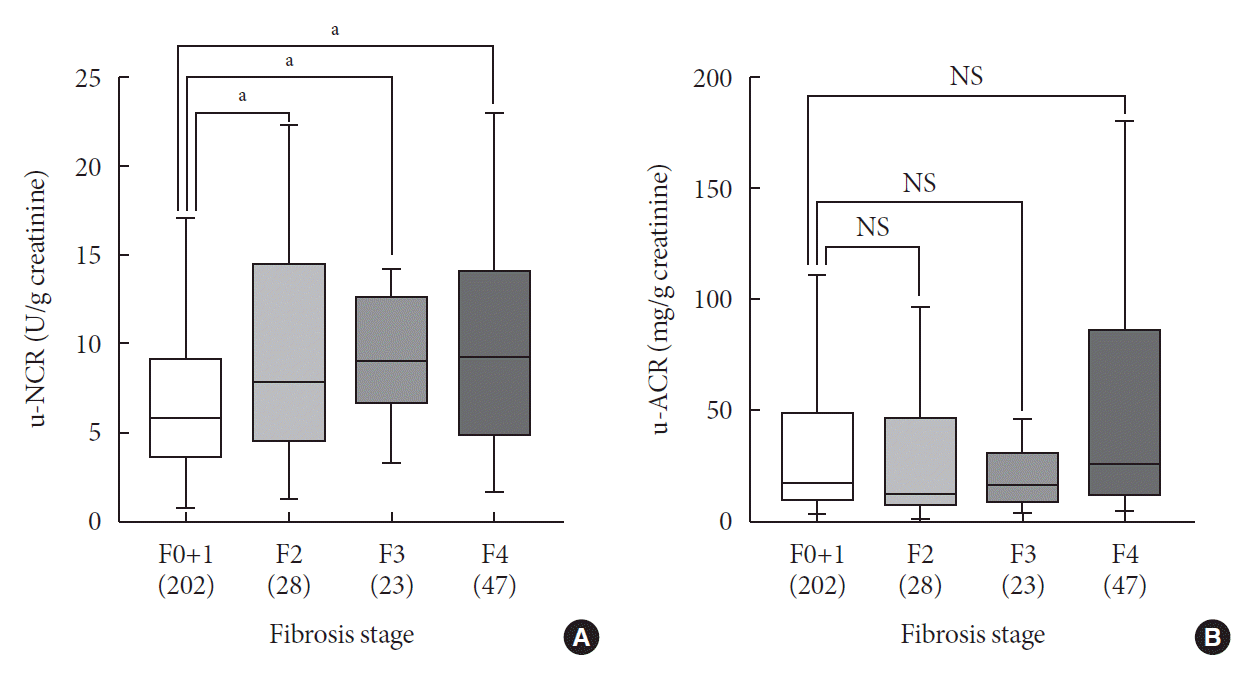
Fig. 2.

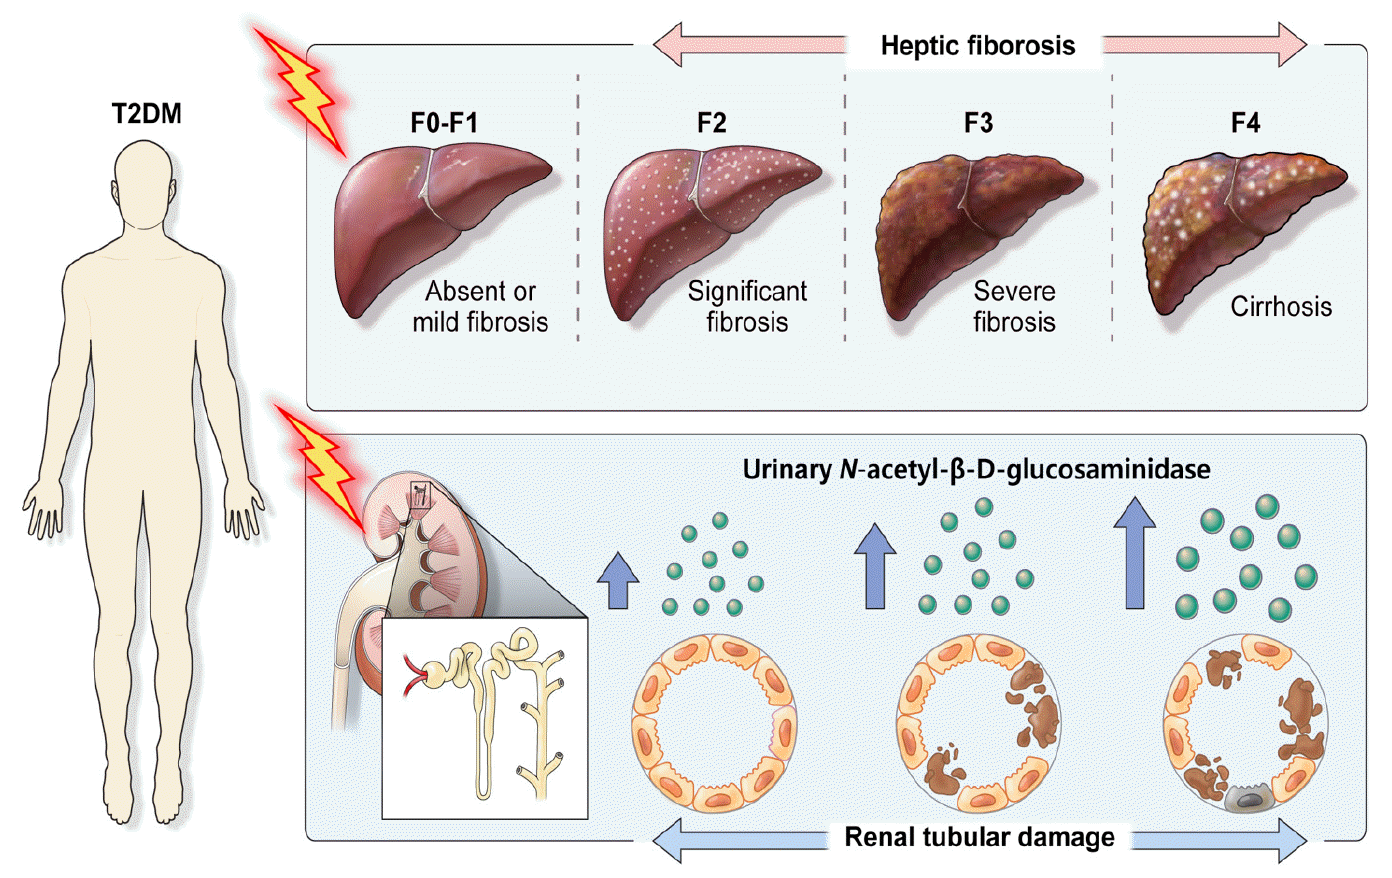
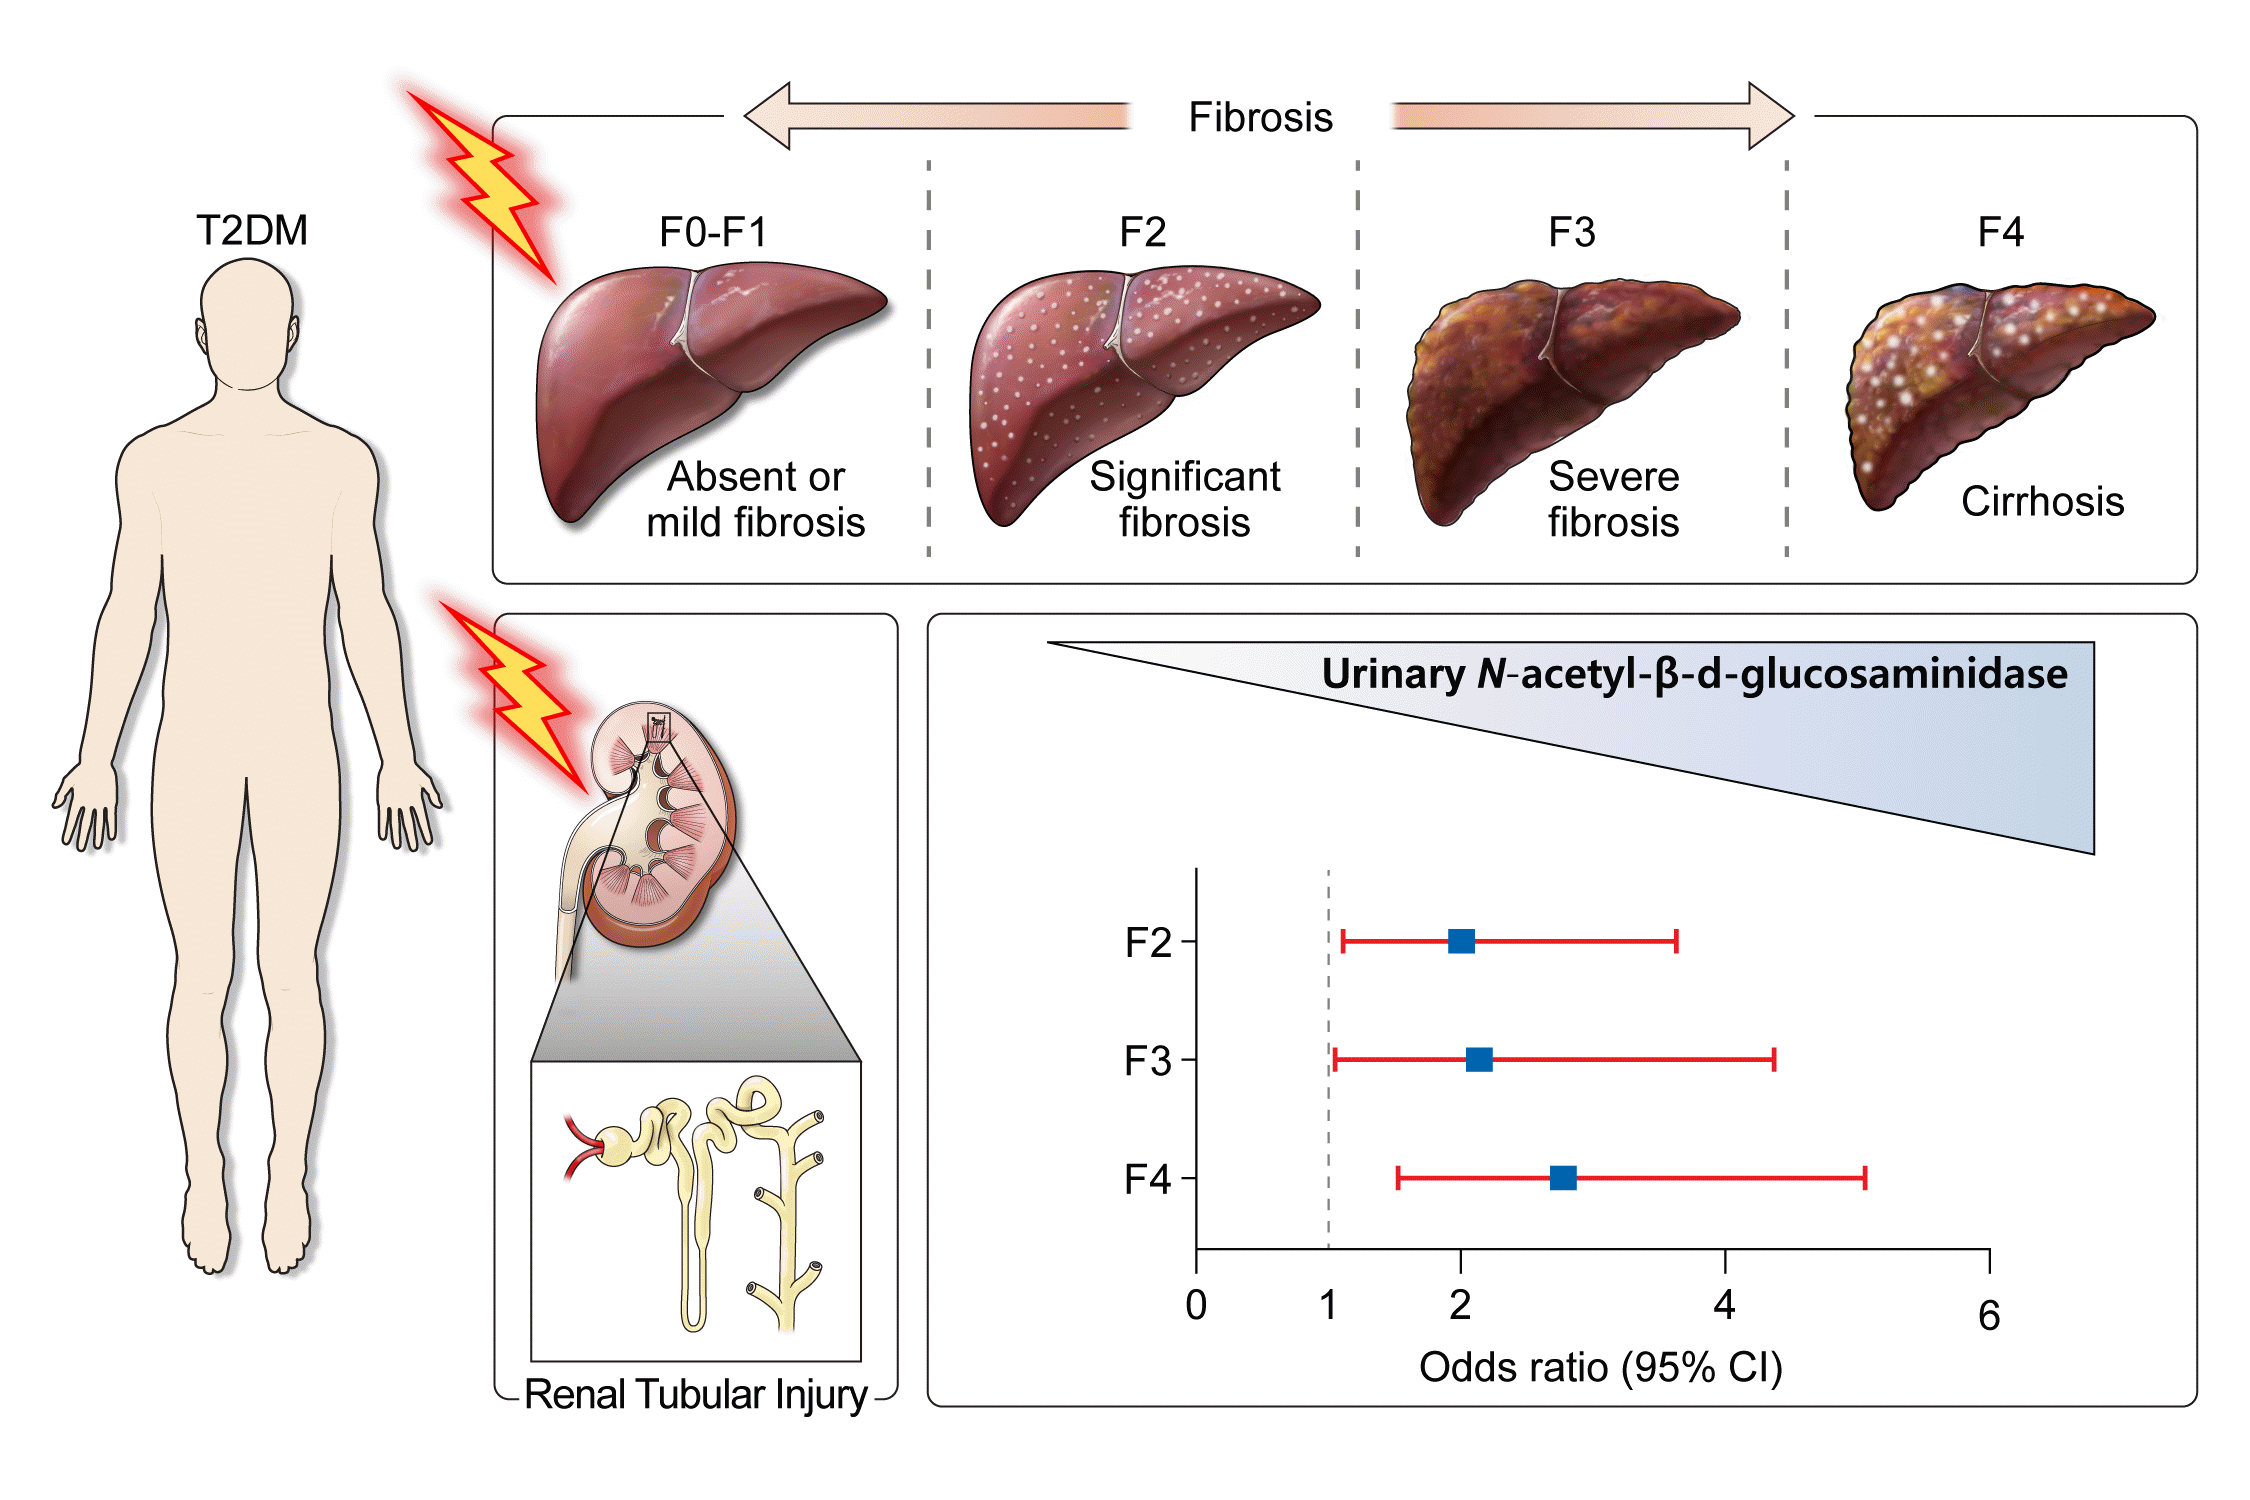
Fig. 3.

Table 1.
| Characteristic | Total (n=300) | Low u-NCR (≤6.77 U/g Cr) (n=150) | High u-NCR (>6.77 U/g Cr) (n=150) | P value | |
|---|---|---|---|---|---|
| Demographic | |||||
| Age, yr | 57.1±13.5 | 56.4±13.8 | 57.7±13.2 | 0.410 | |
| Male sex | 204 (68) | 115 (76.7) | 89 (59.3) | 0.001a | |
| Hypertension | 150 (50) | 75 (50) | 99 (66) | 0.005a | |
| Lipid medication | 150 (50) | 82 (54.7) | 82 (54.7) | 0.990 | |
| Duration of diabetes, yr | 3 (0 to 10) | 3 (0 to 8) | 4 (0 to 11) | 0.050a | |
| BMI, kg/m2 | 26.7±–3.9 | 26.5±3.5 | 26.9±4.3 | 0.470 | |
| Waist circumference, cm | 93.1±10.1 | 92.9±9.2 | 93.4±11.0 | 0.660 | |
| Systolic blood pressure, mm Hg | 128.3±16.1 | 126.4±15.2 | 130±16.9 | 0.050 | |
| Diastolic blood pressure, mm Hg | 80±13.0 | 79.5±12.2 | 80.6±13.7 | 0.470 | |
| Biochemistry profile | |||||
| AST, IU/L | 27 (19 to 39) | 26 (19 to 36) | 27 (18 to 42) | 0.690 | |
| ALT, IU/L | 27 (19 to 47) | 27 (20 to 49) | 26 (17 to 45) | 0.260 | |
| Albumin, mg/dL | 4.4±0.39 | 4.5±0.31 | 4.3±0.44 | <0.001a | |
| Platelet, 103/μL | 240±75 | 240±68 | 241±51 | 0.940 | |
| Total cholesterol, mg/dL | 164 (135 to 195) | 155 (131 to 192) | 169 (141 to 202) | 0.036a | |
| Triglyceride, mg/dL | 134 (98 to 194) | 131 (98 to 186) | 137 (99 to 215) | 0.470 | |
| HDL-C, mg/dL | 44 (36 to 53) | 44 (38 to 52) | 44 (35 to 54) | 0.620 | |
| LDL-C, mg/dL | 89 (63 to 115) | 86 (57 to 113) | 91 (68 to 117) | 0.130 | |
| Glycemic parameter | |||||
| Fasting glucose, mg/dL | 145±58 | 128±31 | 167±71 | <0.001a | |
| Postprandial glucose, mg/dL | 214±79 | 184±53 | 245±90 | <0.001a | |
| HbA1c, % | 7.7±1.8 | 7.2±1.4 | 8.3±1.9 | <0.001a | |
| Glycated albumin, % | 17 (15 to 22) | 16 (14 to 18) | 20 (17 to 25) | <0.001a | |
| Homeostasis model assessment (insulin non-user n=249) | 133 (56.4) | 116 (46.6) | |||
| HOMA-β | 54.9 (30.7 to 98.0) | 61.5 (38 to 105) | 46 (25.2 to 96.3) | 0.009a | |
| HOMA-IR | 3.4 (2.1 to 6.3) | 3.2 (2.0 to 5.7) | 3.9 (2.2 to 6.6) | 0.097 | |
| Nephropathic indices | |||||
| CKD (eGFR <60 mL/min/1.73 m2) | 150 (50) | 4 (2.7) | 17 (11.3) | 0.003a | |
| Creatinine, mg/dL | 0.8 (0.68 to 0.96) | 0.8 (0.69 to 0.95) | 0.8 (0.66 to 0.96) | 0.900 | |
| eGFR CKD-EPI, mL/min/1.73 m2 | 93.2±19.6 | 96.9±17.2 | 89.6±21.2 | 0.001a | |
| u-NCR, U/g creatinine | 6.8 (4.2 to 10.8) | 4.2 (3.1 to 5.6) | 10.8 (8.4 to 14.4) | <0.001a | |
| u-ACR, mg/g creatinine | 12.5 (5.7 to 45.7) | 8.8 (4.5 to 25.8) | 22.1 (8.5 to 89.7) | <0.001a | |
| Albuminuria (≥30 mg/g creatinine) | 97 (32.3) | 34 (22.7) | 63 (42.0) | <0.001a | |
| u-PCR, mg/g creatinine | 100 (70 to 190) | 80 (60 to 125) | 130 (90 to 283) | <0.001a | |
| Indices of hepatic steatosis | |||||
| CAP, dB/m | 292 (254 to 325) | 292 (257 to 319) | 293 (251 to 336) | 0.710 | |
| NLFS | 0.85 (–0.22 to 2.17) | 0.89 (–0.25 to 2.12) | 0.75 (–0.22 to 2.33) | 0.900 | |
| NLFS >–0.64 | 240 (80.8) | 120 (80.5) | 120 (81.1) | 0.910 | |
| FSI | 0.60 (–0.08 to 1.59) | 0.65 (–0.08 to 1.5) | 0.57 (–0.09 to 1.64) | 0.830 | |
| Indices of hepatic fibrosis | |||||
| LSM, kPa | 6.0 (4.6 to 8.3) | 5.4 (4.5 to 6.7) | 6.3 (4.9 to 10.2) | 0.001a | |
| FIB-4 index | 1.24 (0.83 to 1.89) | 1.15 (0.81 to 1.65) | 1.39 (0.86 to 2.0) | 0.055 | |
| FIB-4 index >2.67 | 39 (13) | 19 (12.7) | 20 (13.3) | 0.86 | |
| NFS | –0.85 (–1.73 to –0.03) | –1.11 (–1.81 to –0.12) | –0.63 (–1.6 to 0.14) | 0.032a | |
| NFS >0.676 | 36 (12) | 17 (11.3) | 19 (12.7) | 0.720 | |
| Hepatic fibrosis stage | |||||
| F0–1 (<7 kPa) | 202 (67.3) | 116 (77.3) | 86 (57.3) | 0.001a | |
| F2 (≥7 kPa) | 28 (9.3) | 11 (7.3) | 17 (11.3) | ||
| F3 (≥8.7 kPa) | 23 (7.7) | 5 (3.3) | 18 (12.0) | ||
| F4 (≥11.5 kPa) | 47 (15.7) | 18 (12) | 29 (19.3) | ||
Values are presented as mean±standard deviation, number (%), or median (interquartile range).
u-NCR, urinary N-acetyl-β-D-glucosaminidase to creatinine ratio; Cr, creatinine; BMI, body mass index; AST, aspartate aminotransferase; ALT, alanine aminotransferase; HDL-C, high-density lipoprotein cholesterol; LDL-C, low-density lipoprotein cholesterol; HbA1c, glycosylated hemoglobin; HOMA-β, homeostasis model assessment-β; HOMA-IR, homeostasis model assessment of insulin resistance; CKD, chronic kidney disease; eGFR, estimated glomerular filtration rate; CKD-EPI, chronic kidney disease epidemiology collaboration; u-ACR, urinary albumin to creatinine ratio; u-PCR, urinary protein to creatinine ratio; CAP, controlled attenuation parameter; NLFS, nonalcoholic fatty liver disease (NAFLD) liver fat score; FSI, Framingham steatosis index; LSM, liver stiffness measurement; FIB-4, Fibrosis-4-calculator; NFS, NAFLD fibrosis score; F0–1, no fibrosis and mild fibrosis; F2, significant fibrosis.
Table 2.
| Variable |
u-NCRa |
|
|---|---|---|
| r | P value | |
| Demographics | ||
| Age, yr | 0.069 | 0.230 |
| Duration of diabetes, yr | 0.130 | 0.032b |
| BMI, kg/m2 | –0.039 | 0.510 |
| Waist circumference, cm | –0.037 | 0.520 |
| Systolic blood pressure, mm Hg | 0.062 | 0.280 |
| Diastolic blood pressure, mm Hg | 0.008 | 0.890 |
| Biochemistry profile | ||
| AST, IU/L | 0.046 | 0.240 |
| ALT, IU/L | –0.010 | 0.800 |
| Albumin, mg/dL | –0.30 | <0.001b |
| Total cholesterol, mg/dL | 0.090 | 0.017b |
| Triglyceride, mg/dL | 0.001 | 0.980 |
| HDL-C, mg/dL | –0.006 | 0.870 |
| LDL-C, mg/dL | 0.073 | 0.059 |
| Glycemic parameters | ||
| Fasting glucose, mg/dL | 0.380 | <0.001b |
| Postprandial glucose, mg/dL | 0.440 | <0.001b |
| HbA1c, % | 0.370 | <0.001b |
| Glycated albumin, % | 0.360 | <0.001b |
| HOMA-β (insulin non-user n=249) | –0.150 | 0.021b |
| HOMA-IR (insulin non-user n=249) | 0.087 | 0.170 |
| Nephropathic indices | ||
| Creatinine, mg/dL | 0.015 | 0.710 |
| eGFR CKD-EPI, mL/min/1.73 m2 | –0.22 | <0.001b |
| u-ACR, mg/g creatinine | 0.230 | <0.001b |
| u-PCR, mg/g creatinine | 0.320 | <0.001b |
| Index of hepatic steatosis | ||
| NLFS | 0.001 | 0.990 |
| FSI | –0.01 | 0.810 |
| Index of hepatic fibrosis | ||
| FIB-4 index | 0.340 | <0.001b |
| NFS | 0.350 | <0.001b |
u-NCR, urinary N-acetyl-β-D-glucosaminidase to creatinine ratio; BMI, body mass index; AST, aspartate aminotransferase; ALT, alanine aminotransferase; HDL-C, high-density lipoprotein cholesterol; LDL-C, low-density lipoprotein cholesterol; HbA1c, glycosylated hemoglobin; HOMA-β, homeostasis model assessment-β; HOMA-IR, homeostasis model assessment of insulin resistance; eGFR, estimated glomerular filtration rate; CKD-EPI, chronic kidney disease epidemiology collaboration; u-ACR, urinary albumin to creatinine ratio; u-PCR, urinary protein to creatinine ratio; NLFS, nonalcoholic fatty liver disease (NAFLD) liver fat score; FSI, Framingham steatosis index; FIB-4, fibrosis-4-calculator; NFS, NAFLD fibrosis score.
Table 3.
| Variable |
Model 1 |
Model 2 |
Model 3 |
Model 4 |
||||
|---|---|---|---|---|---|---|---|---|
| STD β | P value | STD β | P value | STD β | P value | STD β | P value | |
| u-NCR, U/g Cra | 1.58 | <0.001b | 1.41 | 0.001b | 0.130 | 0.002b | 1.58 | <0.001b |
| Age, yr | 0.027 | 0.250 | 0.018 | 0.422 | 0.014 | 0.560 | 0.005 | 0.811 |
| Male sex | –0.46 | 0.481 | –0.520 | 0.421 | –0.180 | 0.781 | –0.046 | 0.942 |
| BMI, kg/m2 | 0.21 | 0.009b | 0.211 | 0.011b | 0.150 | 0.101 | 0.130 | 0.160b |
| Duration of diabetes, yr | –0.058 | 0.140 | –0.04 | 0.320 | –0.027 | 0.510 | –0.004 | 0.920 |
| Hypertension | 0.970 | 0.140 | 1.03 | 0.130 | 0.970 | 0.131 | ||
| Lipid medication | –1.74 | 0.007b | –1.69 | 0.009b | –1.68 | 0.007b | ||
| Triglyceride, mg/dL | –0.006 | 0.089 | –0.005 | 0.132 | ||||
| ALT, IU/L | 0.010 | 0.300 | 0.011 | 0.243 | ||||
| HOMA-IR, % | 0.130 | 0.096 | 0.0001 | 0.990 | ||||
| HbA1c, % | 0.141 | 0.550 | ||||||
| HOMA-β | 0.017 | 0.011b | ||||||
Model 1 was adjusted for age, male sex, BMI, and duration of diabetes; Model 2 adjusted for Model 1 parameters plus hypertension, lipid medication; Model 3 adjusted for Model 2 parameters plus triglyceride, ALT, HOMA-IR; Model 4 adjusted for Model 3 parameters plus HbA1c, HOMA-β.
u-NCR, urinary N-acetyl-β-D-glucosaminidase to creatinine ratio; STD, standardized; BMI, body mass index; ALT, alanine aminotransferase; HOMA-IR, homeostasis model assessment of insulin resistance; HbA1c, glycosylated hemoglobin; HOMA-β, homeostasis model assessment-β.


 PDF
PDF Citation
 Print
Print


 XML Download