Journal List > Diabetes Metab J > v.46(1) > 1160537

Zhang, Ke, Lu, Liu, Wang, and Li: Serum Retinol-Binding Protein Levels Are Associated with Nonalcoholic Fatty Liver Disease in Chinese Patients with Type 2 Diabetes Mellitus: A Real-World Study

Abstract

Background

The association of serum retinol-binding protein (RBP) levels with nonalcoholic fatty liver disease (NAFLD) remains controversial. Furthermore, few studies have investigated their relationship in type 2 diabetes mellitus (T2DM) patients. Therefore, the aim of the present study was to explore the association between serum RBP levels and NAFLD in Chinese inpatients with T2DM.

Methods

This cross-sectional, real-world study included 2,263 Chinese T2DM inpatients. NAFLD was diagnosed by abdominal ultrasonography. The subjects were divided into four groups based on RBP quartiles, and clinical characteristics were compared among the four groups. The associations of both RBP levels and quartiles with the presence of NAFLD were also analyzed.

Results

After adjustment for sex, age, and diabetes duration, there was a significant increase in the prevalence of NAFLD from the lowest to the highest RBP quartiles (30.4%, 40.0%, 42.4%, and 44.7% for the first, second, third, and fourth quartiles, respectively, P<0.001 for trend). Fully adjusted multiple logistic regression analysis revealed that both increased RBP levels (odds ratio, 1.155; 95% confidence interval, 1.012 to 1.318; P=0.033) and quartiles (P=0.014 for trend) were independently associated with the presence of NAFLD in T2DM patients.

Conclusion

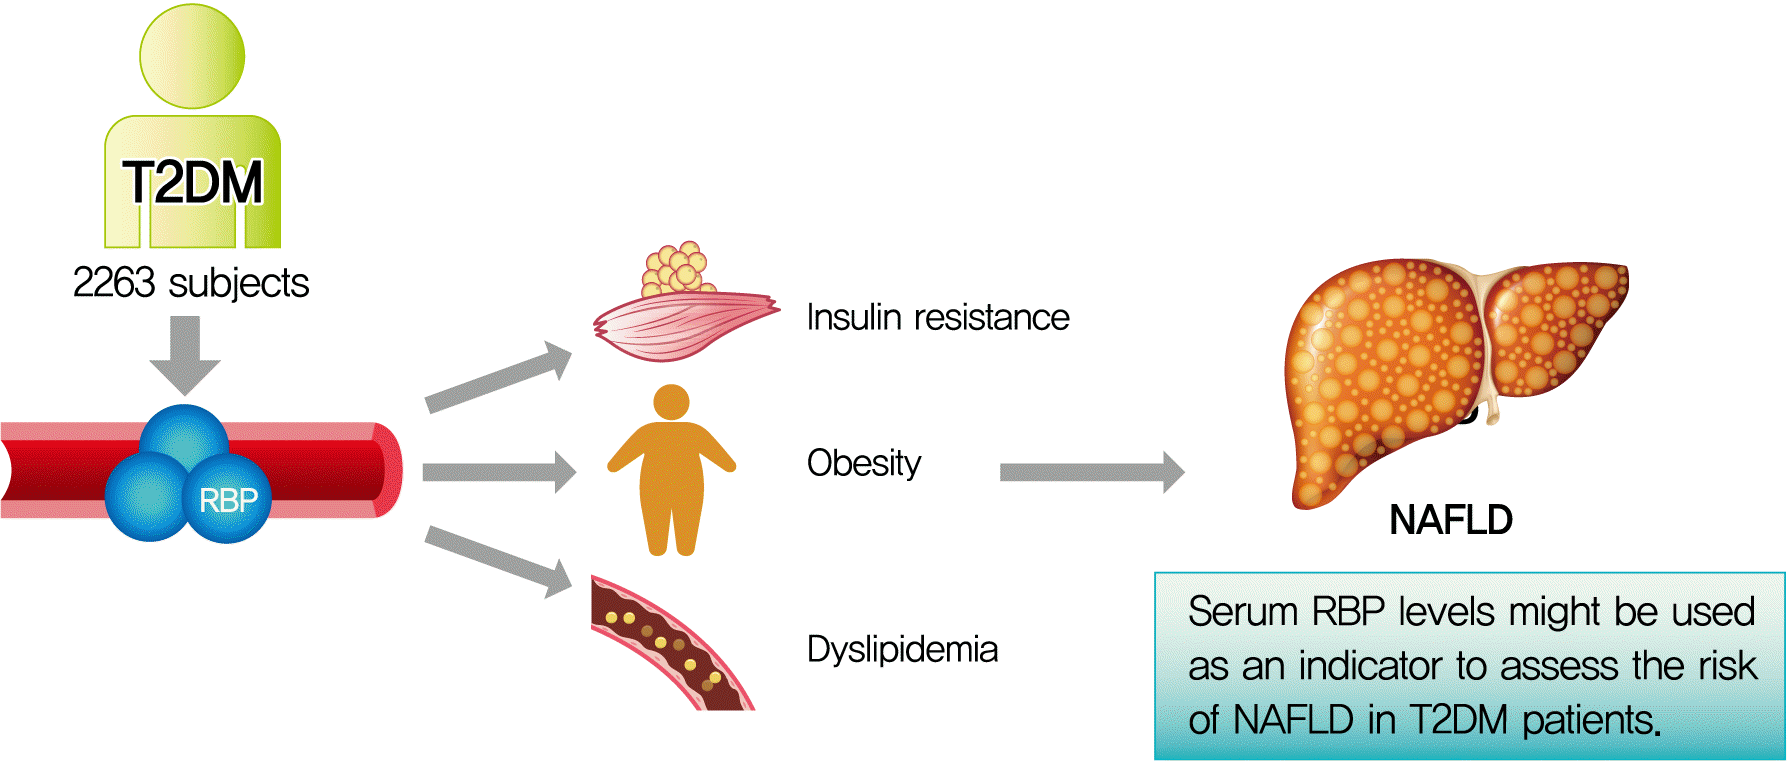
Increased serum RBP levels were independently associated with the presence of NAFLD in Chinese T2DM inpatients. Serum RBP levels may be used as one of the indicators to assess the risk of NAFLD in T2DM patients.

Graphical abstract

INTRODUCTION

Retinol-binding protein 4 (RBP4), also known as retinol-binding protein (RBP) [1], is mainly expressed by hepatocytes and adipose tissue. It is the only specific transporter of retinol (vitamin A) in the circulation, and its main known function is to deliver retinol from the liver to surrounding tissues [2]. Currently, there have been many studies regarding the association between serum RBP4 levels and metabolic dysfunction, such as obesity, diabetes, and insulin resistance (IR). For instance, Graham et al. [3] reported that the magnitude of the increase in serum RBP4 is related to IR among subjects with obesity and type 2 diabetes mellitus (T2DM), which provides evidence that circulating RBP4 levels are closely related to metabolic diseases [4-6].
As a metabolic disease, nonalcoholic fatty liver disease (NAFLD) is considered a liver manifestation of metabolic syndrome correlated with metabolic risk factors such as dyslipidemia, hyperglycemia, and obesity [7,8]. NAFLD includes liver damage ranging from NAFLD to nonalcoholic steatohepatitis (NASH) and eventually to cirrhosis and even hepatic carcinoma [9]. It has been estimated that the prevalence of NAFLD in the global population was approximately 25.24% as of 2015 [10]. Compared with the general population, the prevalence of NAFLD in patients with T2DM was significantly higher, up to 40.2% to 79% [7,11-17]. Our two previous studies showed that the prevalence rates of NAFLD in newly diagnosed T2DM patients were 52.6% and 40.2% in total patients, respectively, which were also much higher than the prevalence in the general population [11,12].
At present, the association of serum RBP4 levels with NAFLD is controversial. A few clinical studies have suggested that serum RBP4 levels may be independently positively correlated with the presence of NAFLD [18-22]. For example, an earlier study from South Korea collected and analyzed clinical data from 159 adult NAFLD patients without diabetes and ultimately demonstrated that serum RBP4 levels were positively correlated with the prevalence of NAFLD and liver function tests, such as aspartate aminotransferase, alanine aminotransferase (ALT), and γ-glutamyltransferase (γ-GT) [18]. However, some other studies have found no evidence to support the association between RBP4 and NAFLD [23,24]. For instance, Cengiz et al. [23] analyzed the clinical characteristics of NAFLD patients without diabetes and concluded that there was no difference in serum RBP4 levels between the NAFLD and control groups. Furthermore, there was even a study suggesting that patients with NAFLD had lower serum RBP4 levels than subjects without NAFLD [25].
It is well known that NAFLD is one of the common complications of T2DM, and T2DM patients may have an increased risk of NAFLD compared with subjects without T2DM [13]. Presently, few clinical studies have focused on exploring the association of RBP4 levels with NAFLD in T2DM patients. Therefore, the aim of the present cross-sectional study was to explore the correlation between serum RBP4 levels and NAFLD in a relatively large number of Chinese inpatients with T2DM in a real-world setting.

METHODS

Study design and population

This study was approved by the ethics committee of Shanghai Jiao Tong University Affiliated Sixth People’s Hospital (approval number: 2018-KY-018(K)). This real-world, cross-sectional study consecutively enrolled patients with T2DM who were hospitalized in our department from January 2007 to June 2009, and data for some patients were obtained from our previous studies [11,12]. Patients with the following conditions were excluded: incomplete clinical data; no determination of RBP; no abdominal ultrasonography results; and a history of alcohol consumption or liver dysfunction caused by drugs, viral hepatitis and other reasons. Ultimately, a total of 2,263 patients were included in the study, including 1,083 men and 1,180 women. The selected patients were then divided into four groups based on the RBP quartiles.
All participants were interviewed to determine their diabetes duration (DD), smoking habits, history of hypertension (HTN), medications including insulin or insulin analogs (IIAs), lipid-lowering drugs (LLDs), and metformin. The definitions of HTN and smoking were the same as in our previous studies [26,27]. Briefly, HTN was defined as systolic blood pressure (SBP) ≥140 mm Hg and/or diastolic blood pressure (DBP) ≥90 mm Hg or current use of antihypertensive drugs [26]. Smoking included both former and current smokers [27]. Each participant signed the written informed consent form. In addition, the research was in line with the Helsinki Declaration.

Medical examinations and laboratory tests

The physical examination required in this study included measurements of height, weight, hip circumference (HC), waist circumference (WC), and blood pressure. WC was divided by HC to obtain the waist-to-hip ratio (WHR). Body mass index (BMI) was calculated as weight in kilograms divided by height squared in meters. Blood pressure was measured using a standard mercury sphygmomanometer. The definition of obesity was consistent with our previous studies [28], in which obesity was defined as a BMI above 25 kg/m2 based on the Asia-Pacific criteria set by the World Health Organization [28].
After an overnight fast and 2 hours after breakfast, venous blood samples from subjects were collected for laboratory testing. The clinical parameters to be measured included white blood cell (WBC) count, percentage of neutrophils (NEUT), fasting plasma glucose (FPG), 2-hour postprandial plasma glucose (PPG), fasting C-peptide (FCP), 2-hour postprandial C-peptide (PCP), triglycerides (TG), total cholesterol (TC), low-density lipoprotein cholesterol (LDL-C), high-density lipoprotein cholesterol (HDL-C), lipoprotein(a) (Lp(a)), ALT, γ-GT, serum uric acid (SUA), serum creatinine (Scr), glycated hemoglobin A1c (HbA1c), and C-reactive protein (CRP). In accordance with our previous protocol, the levels of 24-hour urinary albumin excretion (UAE) were determined by enzymatic methods, and the 24-hour UAE was the average of the determination results of three independent early morning urine samples [28]. The estimated glomerular filtration rate (eGFR) was computed by the equation eGFR (mL/min/1.73 m2)= 175×Scr−1.234×(age)−0.179 (×0.79 if female). The homeostasis model assessment of insulin resistance (HOMA2-IR) was calculated based on FPG and FCP levels using HOMA2 Calculator version 2.2.3 [28]. In addition, serum RBP levels were determined with the most widely used immunoturbidimetric assay (Beijia, Shanghai, China).

Abdominal ultrasonography

All abdominal ultrasound examinations of participants were performed according to our previous reports [12,29]. Briefly, hepatic ultrasound examinations were conducted by experienced ultrasonographers who were blinded to the laboratory data using a 3.5-MHz probe (SSc-370, Aloka Co, Tokyo, Japan). Participants lay down in a supine position with the right arm raised above the head, and images were captured with the ultrasound probe placed in the intercostal space of the right costal arch. The diagnosis of NAFLD was also made according to the criteria of our previous studies [11,12]. In brief, after excluding liver damage caused by other factors, such as excessive drinking and hepatitis virus, NAFLD was diagnosed by the presence of at least two or three abnormal manifestations of abdominal ultrasonography, including diffusely increased echogenicity of the liver stronger than that of the kidney or spleen, intrahepatic vascular blurring and deep attenuation of the ultrasound signal.

Statistical analysis

Statistical analysis was carried out using SPSS version 15.0 for Windows (SPSS Inc., Chicago, IL, USA). The KolmogorovSmirnov test was used to check whether continuous variables conformed to a normal distribution. The normally distributed data are described as the mean±standard deviation, and either independent sample t-tests or one-way analysis of variance (ANOVA) with the least significant difference was used to compare the differences. Skewed variables are expressed as medians with interquartile ranges, and the differences among groups were compared by nonparametric tests. Percentages and chi-squared tests were used to describe and analyze categorical data, respectively. Logistic regression was performed to assess the associations of serum RBP levels and quartiles with the presence of NAFLD. Statistical significance was considered when there was a two-sided P<0.05.

RESULTS

Clinical characteristics of the study patients

A total of 2,263 eligible inpatients with T2DM were included in the present study. The subjects were divided into four groups according to the RBP quartiles with cutoffs of <32, 32–38, 39– 46, and ≥47 mg/L. The comparisons of the clinical characteristics of the patients among the four groups are shown in Table 1. The results showed that the higher RBP quartile tended to contain more females, but no significant age difference was found among the groups. After adjusting for sex, T2DM patients in the higher RBP quartile groups appeared to be more likely to have a higher percentage of taking LLDs and a higher prevalence of HTN, along with higher SBP, WC, WHR, and BMI, but a lower rate of using IIAs (all P<0.05). Furthermore, from the lowest to the highest RBP quartile groups, the levels of FCP, 2-hour PCP, HOMA2-IR, TG, TC, Lp(a), ALT, γ-GT, Scr, SUA, and UAE gradually increased, and the values of HbA1c and eGFR gradually decreased (all P<0.05). There were no differences in DD, smoking habits, percentages of obesity and use of metformin, DBP, WBC count, neutrophil percentage, FPG, 2-hour PPG, HDL-C, LDL-C, and CRP.

Prevalence of NAFLD in the subjects

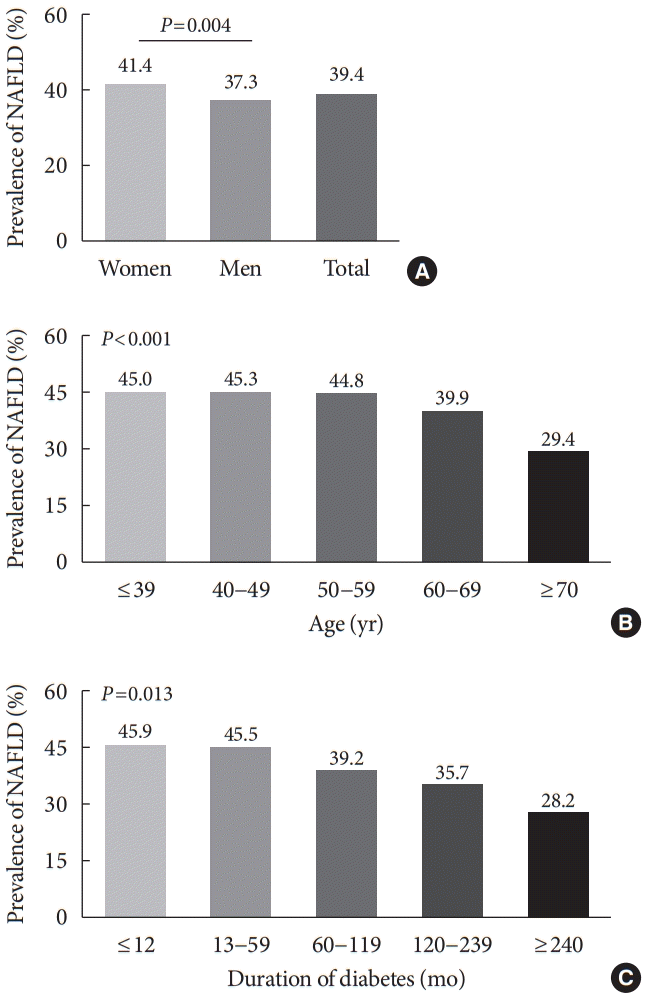
Fig. 1 displays the prevalence of NAFLD in T2DM patients in the study. Based on diagnostic criteria, the prevalence of NAFLD in all subjects was 39.4%, but it was significantly higher in women (41.4%) than in men (37.3%) after adjusting for DD and age (P=0.004) (Fig. 1A). In addition, we observed that the prevalence of NAFLD obviously decreased with increasing age (P<0.001 for trend) and prolonged DD (the trend P=0.013) (Fig. 1B and C).

Comparisons of NAFLD prevalence among the RBP quartile groups
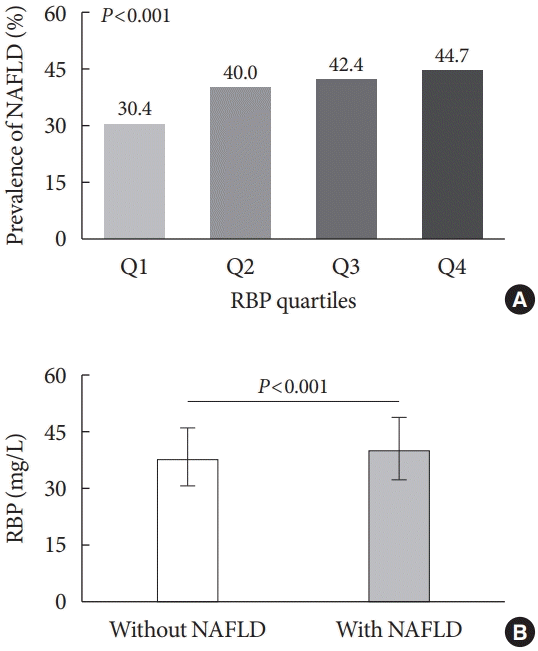
Fig. 2 presents the comparisons of NAFLD prevalence among the RBP quartile groups and the comparisons of serum RBP levels between T2DM patients with and without NAFLD. After controlling for sex, DD and age, the prevalence of NAFLD markedly rose with the increasing RBP quartiles in the T2DM patients (30.4%, 40.0%, 42.4%, and 44.7% for the first, second, third, and fourth quartiles, respectively, P<0.001 for trend) (Fig. 2A). Furthermore, serum RBP levels were significantly higher in the T2DM patients with NAFLD than in those without NAFLD (P<0.001) (Fig. 2B).

Correlations between serum RBP levels and metabolic parameters
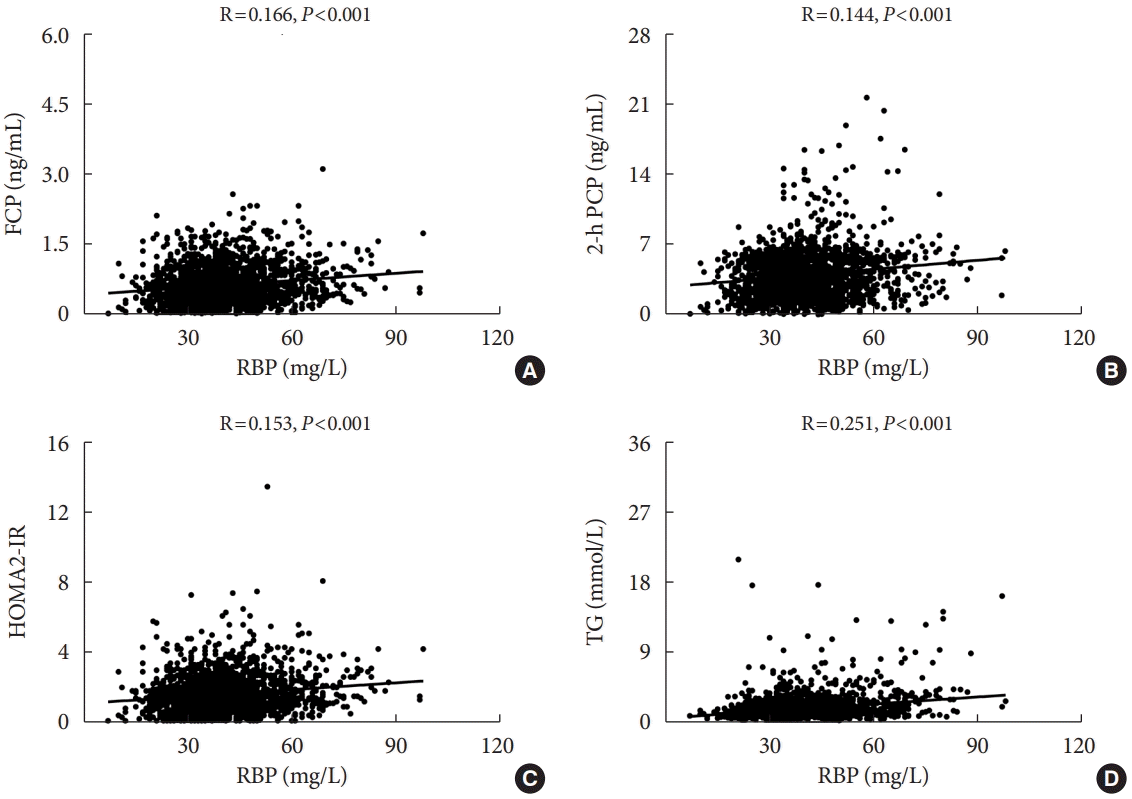
In all patients with T2DM, the correlations between serum RBP levels and metabolic parameters, including TG, FCP, 2-hour PCP, and HOMA2-IR, are displayed in Fig. 3. After adjusting for sex, age and DD, the results of partial correlation analysis revealed that RBP was positively correlated with FCP (R=0.166, P<0.001), 2-hour PCP (R=0.144, P<0.001), HOMA2-IR (R= 0.153, P<0.001), and TG (R=0.251, P<0.001) (Fig. 3).

Association of RBP quartiles with NAFLD

The association of RBP quartiles with NAFLD in T2DM subjects is presented in detail in Table 2. After adjustments for sex, age, DD, smoking, HTN, and obesity (Model 1), the RBP quartiles were independently positively correlated with the presence of NAFLD (P<0.001 for trend). Then, after further adjustments for the use of metformin, IIAs, and LLDs (Model 2), and for SBP, DBP, WC, WHR, and BMI (Model 3), and for WBC, NEUT, TC, TG, HDL-C, LDL-C, Lp(a), HbA1c, Scr, eGFR, SUA, UAE, CRP, FPG, 2-hour PPG, FCP, 2-hour PCP, and HOMA2-IR (Model 4), the correlation between RBP quartiles and the presence of NAFLD remained significantly positive (P=0.002, P=0.002, P=0.014 for trends in Models 2, 3, and 4, respectively).

Association of serum RBP levels with NAFLD

As shown in Table 3, logistic regression was performed with serum RBP levels as the independent variable and the presence of NAFLD as the dependent variable. In Model 1, increased serum RBP levels were independently correlated with the presence of NAFLD after adjustment for sex, age, DD, smoking, HTN and obesity (P<0.001). Moreover, the association was still stable after further controlling for other confounding factors, as shown in Models 2, 3, and 4 (P<0.001 in Model 2, P<0.001 in Model 3, and P=0.033 in Model 4).

DISCUSSION

The prevalence of NAFLD was 39.4% in T2DM patients in the present real-world study, which was very close to a previous study conducted by our team (40.2%) [12]. A recent meta-analysis showed that the overall prevalence of NAFLD in the Chinese general population was approximately 27.7% to 30.7% [30], which was significantly lower than that in T2DM patients in our study. Similarly, many other studies also revealed that the prevalence of NAFLD was higher in patients with T2DM than in general populations [7,13-17]. For example, a study from the United States showed that the prevalence of NAFLD based on ultrasound diagnosis in T2DM subjects was 55.7% [17].
The existence of NAFLD increases the risk of T2DM and promotes the development of T2DM [31-33]. For example, a study by Kim et al. [32] revealed that after adjusting for various confounding factors, NAFLD was significantly associated with the development of T2DM. The close association between T2DM and NAFLD is attributed to both being manifestations of metabolic syndrome and sharing common pathogenic mechanisms such as IR, compensatory hyperinsulinemia, and abnormal lipid metabolism [13]. In addition, some studies showed that NAFLD in T2DM patients was more severe, with higher proportions of NASH and cirrhosis [34,35]. Therefore, the prediction of the occurrence and development of NAFLD and early prevention and timely treatment of NAFLD in patients with T2DM are particularly important.
Interestingly, our study found that the prevalence of NAFLD was negatively correlated with age in all participants. Similar to other studies, in which T2DM patients between the ages of 40 and 59 were more likely to develop NAFLD [36,37], our study also showed that NAFLD prevalence was obviously higher in middle-aged people than in older people. Lu et al. [37] thought that this may be related to the lifestyle habits of middle-aged people; that is, middle-aged people are often too busy to exercise, while retired elderly people have more time to exercise and pay more attention to nutrition and health. Additionally, our study showed that the prevalence of NAFLD in T2DM patients was inversely related to DD, which can be fully explained by the views of Popovic et al. [38]. They pointed out that the DD was significantly negatively correlated with fasting insulinemia and IR assessed by the HOMA-IR index [38], both of which were triggering factors for NAFLD.
More importantly, we found a close correlation between RBP and NAFLD in T2DM inpatients. Not only did the prevalence of NAFLD increase across the RBP quartiles, but the presence of NAFLD was also independently related to serum RBP levels. Moreover, after controlling for other factors, serum RBP levels were significantly higher in T2DM patients with NAFLD than in those without NAFLD.
Presently, there have been many studies exploring the correlation between RBP4 and NAFLD in the general population [18-22], and most findings supported the view that increased serum RBP4 levels were significantly correlated with NAFLD. For example, a cross-sectional study showed a positive association between serum RBP4 levels and NAFLD prevalence in middle-aged and elderly people [21]. Another study selected school children aged 6 to 12 years as subjects and revealed that higher serum RBP4 levels were independently correlated with the presence of NAFLD and fasting TG levels [19]. Similarly, the present study also revealed a positive association between serum RBP levels and TG levels.
However, some other studies have found no or opposite results between RBP4 and NAFLD in the general population [23-25]. For example, Schina et al. [25] presented that patients with NAFLD had lower serum RBP4 levels than patients without NAFLD. We speculated that the different outcomes may be due to the different basic characteristics of the study subjects, such as race, age range and underlying diseases, and the different diagnostic methods for NAFLD and different determinations for RBP4.
Furthermore, there have been many investigations examining the association of RBP4 with NAFLD in the general population, but studies in T2DM patients have been scarce so far. A small-sample study from our hospital, in which serum RBP4 levels were compared between T2DM patients with NAFLD and without any liver diseases, presented that the increased RBP4 concentration was significantly related to NAFLD in T2DM patients [39]. However, another study showed that RBP4 had no correlation with the severity of NAFLD in T2DM patients [40]. Therefore, the correlation between RBP4 and NAFLD in T2DM patients is still unclear. Significantly, the present study provided new evidence that serum RBP levels were positively correlated with NAFLD in a relatively large number of T2DM patients, which was consistent with the results of most studies regarding the association of RBP4 with NAFLD in the general population.
IR may be one of the most important mechanisms for the association of RBP4 with NAFLD. IR is a main mechanism for the occurrence and progression of NAFLD [41]. IR impairs the ability of adipocytes to store fat and results in the release of free fatty acids into the circulatory system, which promote the deposition of lipids in the liver and exacerbate the development of NAFLD [42,43].
Although a few studies have shown that serum RBP4 levels are not correlated with IR [25,44], an increasing number of studies have confirmed the positive association between RBP4 and IR [3,45,46]. The close link between RBP4 and IR was confirmed for the first time by Yang et al. [45], in which serum RBP4 levels were elevated in both mice and humans with several IR states. They also pointed out that an increase in serum RBP4 may cause systemic IR, while a decrease can improve insulin action [45]. A subsequent study also showed that in patients with obesity and T2DM, elevated serum RBP4 was associated with components of metabolic syndrome and IR [3]. Consistently, our study also showed that serum RBP levels were positively related to IR parameters such as FCP, 2-hour PCP, and HOMA2-IR in T2DM patients. Moreover, higher RBP quartiles were accompanied by higher FCP, 2-hour PCP, and HOMA2-IR, which indicated more severe IR in higher RBP4 quartiles. In turn, severe IR in patients with high RBP levels may further promote the onset and development of NAFLD.
Another possible mechanism explaining the close correlation between RBP and NAFLD was that higher RBP4 levels were accompanied by more serious risk factors for NAFLD, such as dyslipidemia and obesity. For instance, as risk factors for NAFLD [47,48], the levels of TG and TC gradually rose from the lowest to the highest RBP quartile group in the present study. In addition, in the study, T2DM patients in the higher RBP quartile groups seemed more likely to have higher obesity-related indicators, such as WC, WHR, and BMI. A meta-analysis revealed that obesity was an independent risk factor for NAFLD, and a clear dose-dependent relationship between BMI and the risk of NAFLD was found [49]. Interestingly, HTN prevalence and the SBP of patients increased as the RBP quartiles increased in our study, and a previous study suggested that HTN may independently promote the development of NAFLD [50].
In addition to the above two mechanisms, RBP4 may directly affect hepatic lipid metabolism. For example, Xia et al. [51] performed a series of experiments in HepG2 cells and mice and found that RBP4 increases adipogenesis in hepatocytes by activating sterol regulatory element-binding proteins (SREBP-1) through the peroxisome proliferator-activated receptor-γ coactivator 1β (PGC-1β)-dependent pathway, which may result in the development and progression of NAFLD.
Certain limitations existed in this study. First, this cross-sectional study could only conclude that there was an association of serum RBP levels with NAFLD, but it was impossible to determine the causal relationship. Second, the study subjects were limited to T2DM inpatients; thus, the conclusions may not be applicable to other populations, such as community patients with diabetes. Furthermore, the gold standard for diagnosing NAFLD is liver biopsy, but the diagnosis of NAFLD in our study was based on ultrasound with limited sensitivity [36]. However, as an invasive test, it is impractical to use liver biopsy as a diagnostic method for NAFLD in a large-scale population study. Finally, there might have been other factors affecting NAFLD that were not corrected. However, we corrected as many clinical factors as possible that may affect the onset of NAFLD. Therefore, to further determine whether serum RBP4 levels can become an independent predictor of NAFLD in T2DM, large-scale prospective studies in more hospitals and regions are needed.
In conclusion, the present study provided new clinical evidence to demonstrate that serum RBP levels were independently positively correlated with NAFLD in Chinese inpatients with T2DM. Serum RBP levels might be used as an indicator for assessing the risk of NAFLD in T2DM patients, but more studies are needed to confirm this hypothesis.

Notes

CONFLICTS OF INTEREST

No potential conflict of interest relevant to this article was reported.

AUTHOR CONTRIBUTIONS

Conception or design: Z.H.Z., J.F.K., L.X.L.

Acquisition, analysis, or interpretation of data: Z.H.Z., J.F.K., J.X.L., Y.L., A.P.W., L.X.L.

Drafting the work or revising: Z.H.Z., J.F.K., L.X.L.

Final approval of the manuscript: Z.H.Z., J.F.K., J.X.L., Y.L., A.P.W., L.X.L.

FUNDING

This work was supported by grants from the National Key Research and Development Plan (2018YFC1314900 and 2018YFC1314905) and the National Natural Science Foundation of China (81170759, 81770813 and 82070866).

ACKNOWLEDGMENTS

We thank the support from Shanghai Municipal Key Clinical Specialty, and thank the other investigators, the staff and all the participants of the present study for their invaluable contributions.

REFERENCES

1. Zabetian-Targhi F, Mahmoudi MJ, Rezaei N, Mahmoudi M. Retinol binding protein 4 in relation to diet, inflammation, immunity, and cardiovascular diseases. Adv Nutr. 2015; 6:748–62.
crossref
2. Quadro L, Blaner WS, Salchow DJ, Vogel S, Piantedosi R, Gouras P, et al. Impaired retinal function and vitamin A availability in mice lacking retinol-binding protein. EMBO J. 1999; 18:4633–44.
crossref
3. Graham TE, Yang Q, Bluher M, Hammarstedt A, Ciaraldi TP, Henry RR, et al. Retinol-binding protein 4 and insulin resistance in lean, obese, and diabetic subjects. N Engl J Med. 2006; 354:2552–63.
crossref
4. Ram J, Snehalatha C, Selvam S, Nanditha A, Shetty AS, Godsland IF, et al. Retinol binding protein-4 predicts incident diabetes in Asian Indian men with prediabetes. Biofactors. 2015; 41:160–5.
crossref
5. Pandey GK, Balasubramanyam J, Balakumar M, Deepa M, Anjana RM, Abhijit S, et al. Altered circulating levels of retinol binding protein 4 and transthyretin in relation to insulin resistance, obesity, and glucose intolerance in Asian Indians. Endocr Pract. 2015; 21:861–9.
crossref
6. Lee JW, Im JA, Park KD, Lee HR, Shim JY, Lee DC. Retinol binding protein 4 and insulin resistance in apparently healthy elderly subjects. Clin Chim Acta. 2009; 400:30–2.
crossref
7. Dai W, Ye L, Liu A, Wen SW, Deng J, Wu X, et al. Prevalence of nonalcoholic fatty liver disease in patients with type 2 diabetes mellitus: a meta-analysis. Medicine (Baltimore). 2017; 96:e8179.
8. Marchesini G, Brizi M, Bianchi G, Tomassetti S, Bugianesi E, Lenzi M, et al. Nonalcoholic fatty liver disease: a feature of the metabolic syndrome. Diabetes. 2001; 50:1844–50.
9. Friedman SL, Neuschwander-Tetri BA, Rinella M, Sanyal AJ. Mechanisms of NAFLD development and therapeutic strategies. Nat Med. 2018; 24:908–22.
crossref
10. Younossi ZM, Koenig AB, Abdelatif D, Fazel Y, Henry L, Wymer M. Global epidemiology of nonalcoholic fatty liver disease-meta-analytic assessment of prevalence, incidence, and outcomes. Hepatology. 2016; 64:73–84.
crossref
11. Li TT, Wang AP, Lu JX, Chen MY, Zhao CC, Tang ZH, et al. Prevalence and clinical characteristics of non-alcoholic fatty liver disease in newly diagnosed patients with ketosis-onset diabetes. Diabetes Metab. 2018; 44:437–43.
crossref
12. Zhao CC, Wang AP, Li LX, Li TT, Chen MY, Zhu Y, et al. Urine uric acid excretion is associated with nonalcoholic fatty liver disease in patients with type 2 diabetes. J Diabetes Complications. 2016; 30:1074–80.
crossref
13. Forlani G, Giorda C, Manti R, Mazzella N, De Cosmo S, Rossi MC, et al. The burden of NAFLD and its characteristics in a nationwide population with type 2 diabetes. J Diabetes Res. 2016; 2016:2931985.
crossref
14. Yi M, Chen RP, Yang R, Chen H. Increased prevalence and risk of non-alcoholic fatty liver disease in overweight and obese patients with Type 2 diabetes in South China. Diabet Med. 2017; 34:505–13.
crossref
15. Dvorak K, Hainer R, Petrtyl J, Zeman M, Vareka T, Zak A, et al. The prevalence of nonalcoholic liver steatosis in patients with type 2 diabetes mellitus in the Czech Republic. Biomed Pap Med Fac Univ Palacky Olomouc Czech Repub. 2015; 159:442–8.
crossref
16. Younossi ZM, Golabi P, de Avila L, Paik JM, Srishord M, Fukui N, et al. The global epidemiology of NAFLD and NASH in patients with type 2 diabetes: a systematic review and meta-analysis. J Hepatol. 2019; 71:793–801.
crossref
17. Mandal A, Bhattarai B, Kafle P, Khalid M, Jonnadula SK, Lamicchane J, et al. Elevated liver enzymes in patients with type 2 diabetes mellitus and non-alcoholic fatty liver disease. Cureus. 2018; 10:e3626.
crossref
18. Seo JA, Kim NH, Park SY, Kim HY, Ryu OH, Lee KW, et al. Serum retinol-binding protein 4 levels are elevated in non-alcoholic fatty liver disease. Clin Endocrinol (Oxf). 2008; 68:555–60.
crossref
19. Huang SC, Yang YJ. Serum retinol-binding protein 4 is independently associated with pediatric NAFLD and fasting triglyceride level. J Pediatr Gastroenterol Nutr. 2013; 56:145–50.
crossref
20. Zwolak A, Szuster-Ciesielska A, Daniluk J, Semeniuk J, Kandefer-Szerszen M. Chemerin, retinol binding protein-4, cytokeratin-18 and transgelin-2 presence in sera of patients with non-alcoholic liver fatty disease. Ann Hepatol. 2016; 15:862–9.
21. Chen X, Shen T, Li Q, Chen X, Li Y, Li D, et al. Retinol binding protein-4 levels and non-alcoholic fatty liver disease: a community-based cross-sectional study. Sci Rep. 2017; 7:45100.
crossref
22. Cai H, Lu S, Chen Y, Das Mbbs Mrcog S, Niu Z, Zhuo G, et al. Serum retinol binding protein 4 and galectin-3 binding protein as novel markers for postmenopausal nonalcoholic fatty liver disease. Clin Biochem. 2018; 56:95–101.
crossref
23. Cengiz C, Ardicoglu Y, Bulut S, Boyacioglu S. Serum retinolbinding protein 4 in patients with nonalcoholic fatty liver disease: does it have a significant impact on pathogenesis? Eur J Gastroenterol Hepatol. 2010; 22:813–9.
crossref
24. Milner KL, van der Poorten D, Xu A, Bugianesi E, Kench JG, Lam KS, et al. Adipocyte fatty acid binding protein levels relate to inflammation and fibrosis in nonalcoholic fatty liver disease. Hepatology. 2009; 49:1926–34.
crossref
25. Schina M, Koskinas J, Tiniakos D, Hadziyannis E, Savvas S, Karamanos B, et al. Circulating and liver tissue levels of retinol-binding protein-4 in non-alcoholic fatty liver disease. Hepatol Res. 2009; 39:972–8.
crossref
26. Li L, Yu H, Zhu J, Wu X, Liu F, Zhang F, et al. The combination of carotid and lower extremity ultrasonography increases the detection of atherosclerosis in type 2 diabetes patients. J Diabetes Complications. 2012; 26:23–8.
crossref
27. Li LX, Zhao CC, Ren Y, Tu YF, Lu JX, Wu X, et al. Prevalence and clinical characteristics of carotid atherosclerosis in newly diagnosed patients with ketosis-onset diabetes: a cross-sectional study. Cardiovasc Diabetol. 2013; 12:18.
crossref
28. Chen MY, Zhao CC, Li TT, Zhu Y, Yu TP, Bao YQ, et al. Serum uric acid levels are associated with obesity but not cardio-cerebrovascular events in Chinese inpatients with type 2 diabetes. Sci Rep. 2017; 7:40009.
crossref
29. Hou XH, Zhu YX, Lu HJ, Chen HF, Li Q, Jiang S, et al. Non-alcoholic fatty liver disease’s prevalence and impact on alanine aminotransferase associated with metabolic syndrome in the Chinese. J Gastroenterol Hepatol. 2011; 26:722–30.
crossref
30. Zhou F, Zhou J, Wang W, Zhang XJ, Ji YX, Zhang P, et al. Unexpected rapid increase in the burden of NAFLD in China from 2008 to 2018: a systematic review and meta-analysis. Hepatology. 2019; 70:1119–33.
crossref
31. Tilg H, Moschen AR, Roden M. NAFLD and diabetes mellitus. Nat Rev Gastroenterol Hepatol. 2017; 14:32–42.
crossref
32. Kim CH, Park JY, Lee KU, Kim JH, Kim HK. Fatty liver is an independent risk factor for the development of type 2 diabetes in Korean adults. Diabet Med. 2008; 25:476–81.
crossref
33. Shibata M, Kihara Y, Taguchi M, Tashiro M, Otsuki M. Nonalcoholic fatty liver disease is a risk factor for type 2 diabetes in middle-aged Japanese men. Diabetes Care. 2007; 30:2940–4.
crossref
34. Leite NC, Villela-Nogueira CA, Pannain VL, Bottino AC, Rezende GF, Cardoso CR, et al. Histopathological stages of nonalcoholic fatty liver disease in type 2 diabetes: prevalences and correlated factors. Liver Int. 2011; 31:700–6.
crossref
35. Hossain N, Afendy A, Stepanova M, Nader F, Srishord M, Rafiq N, et al. Independent predictors of fibrosis in patients with nonalcoholic fatty liver disease. Clin Gastroenterol Hepatol. 2009; 7:1224–9.
crossref
36. Lv WS, Sun RX, Gao YY, Wen JP, Pan RF, Li L, et al. Nonalcoholic fatty liver disease and microvascular complications in type 2 diabetes. World J Gastroenterol. 2013; 19:3134–42.
crossref
37. Lu H, Zeng L, Liang B, Shu X, Xie D. High prevalence of coronary heart disease in type 2 diabetic patients with non-alcoholic fatty liver disease. Arch Med Res. 2009; 40:571–5.
crossref
38. Popovic L, Zamaklar M, Lalic K, Vasovic O. Analysis of the effect of diabetes type 2 duration on beta cell secretory function and insulin resistance. Srp Arh Celok Lek. 2006; 134:219–23.
crossref
39. Wu H, Jia W, Bao Y, Lu J, Zhu J, Wang R, et al. Serum retinol binding protein 4 and nonalcoholic fatty liver disease in patients with type 2 diabetes mellitus. Diabetes Res Clin Pract. 2008; 79:185–90.
crossref
40. Koh JH, Shin YG, Nam SM, Lee MY, Chung CH, Shin JY. Serum adipocyte fatty acid-binding protein levels are associated with nonalcoholic fatty liver disease in type 2 diabetic patients. Diabetes Care. 2009; 32:147–52.
crossref
41. Engin A. Non-alcoholic fatty liver disease. Adv Exp Med Biol. 2017; 960:443–67.
crossref
42. Brunt EM, Wong VW, Nobili V, Day CP, Sookoian S, Maher JJ, et al. Nonalcoholic fatty liver disease. Nat Rev Dis Primers. 2015; 1:15080.
crossref
43. Asrih M, Jornayvaz FR. Metabolic syndrome and nonalcoholic fatty liver disease: is insulin resistance the link? Mol Cell Endocrinol. 2015; 418 Pt 1:55–65.
crossref
44. Chavez AO, Coletta DK, Kamath S, Cromack DT, Monroy A, Folli F, et al. Retinol-binding protein 4 is associated with impaired glucose tolerance but not with whole body or hepatic insulin resistance in Mexican Americans. Am J Physiol Endocrinol Metab. 2009; 296:E758–64.
crossref
45. Yang Q, Graham TE, Mody N, Preitner F, Peroni OD, Zabolotny JM, et al. Serum retinol binding protein 4 contributes to insulin resistance in obesity and type 2 diabetes. Nature. 2005; 436:356–62.
crossref
46. Park SE, Lee NS, Park JW, Rhee EJ, Lee WY, Oh KW, et al. Association of urinary RBP4 with insulin resistance, inflammation, and microalbuminuria. Eur J Endocrinol. 2014; 171:443–9.
crossref
47. Chen Z, Qin H, Qiu S, Chen G, Chen Y. Correlation of triglyceride to high-density lipoprotein cholesterol ratio with nonalcoholic fatty liver disease among the non-obese Chinese population with normal blood lipid levels: a retrospective cohort research. Lipids Health Dis. 2019; 18:162.
crossref
48. Dowla S, Aslibekyan S, Goss A, Fontaine K, Ashraf AP. Dyslipidemia is associated with pediatric nonalcoholic fatty liver disease. J Clin Lipidol. 2018; 12:981–7.
crossref
49. Li L, Liu DW, Yan HY, Wang ZY, Zhao SH, Wang B. Obesity is an independent risk factor for non-alcoholic fatty liver disease: evidence from a meta-analysis of 21 cohort studies. Obes Rev. 2016; 17:510–9.
crossref
50. Oikonomou D, Georgiopoulos G, Katsi V, Kourek C, Tsioufis C, Alexopoulou A, et al. Non-alcoholic fatty liver disease and hypertension: coprevalent or correlated? Eur J Gastroenterol Hepatol. 2018; 30:979–85.
crossref
51. Xia M, Liu Y, Guo H, Wang D, Wang Y, Ling W. Retinol binding protein 4 stimulates hepatic sterol regulatory element-binding protein 1 and increases lipogenesis through the peroxisome proliferator-activated receptor-γ coactivator 1β-dependent pathway. Hepatology. 2013; 58:564–75.
crossref

Fig. 1.
Prevalence of nonalcoholic fatty liver disease (NAFLD) in the subjects. (A) Overall prevalence of NAFLD in the subjects and comparison of the NAFLD prevalence between men and women (P=0.004). (B) Comparison of the NAFLD prevalence among subjects stratified by age after controlling for sex and diabetes duration (DD) (P<0.001 for trend). (C) Comparison of the NAFLD prevalence among subjects stratified by DD after controlling for gender and age (P=0.013 for trend).
dmj-2020-0222f1.tif
Fig. 2.
Comparisons of nonalcoholic fatty liver disease (NAFLD) prevalence among the retinol-binding protein (RBP) quartile groups. (A) Comparisons of the prevalence of NAFLD across the RBP quartile groups after controlling for sex, age, and diabetes duration (P<0.001 for trend). (B) Comparisons of serum RBP levels between type 2 diabetes mellitus patients with and without NAFLD (P<0.001).
dmj-2020-0222f2.tif
Fig. 3.
Correlations between serum retinol-binding protein (RBP) levels and metabolic parameters. All results were obtained after adjusting for sex, age, and diabetes duration. (A) Correlation between serum RBP levels and fasting C-peptide (FCP; P<0.001). (B) Correlation between serum RBP levels and 2-hour postprandial C-peptide (PCP; P<0.001). (C) Correlation between serum RBP levels and homeostasis model assessment of insulin resistance (HOMA2-IR; P<0.001). (D) Correlation between serum RBP levels and triglycerides (TG; P<0.001).
dmj-2020-0222f3.tif
dmj-2020-0222f4.tif
Table 1.
Characteristics of the subjects according to RBP quartiles
Variable Q1 (n=560) Q2 (n=545) Q3 (n=576) Q4 (n=582) P value P valuea
RBP, mg/L <32 32–38 39–46 ≥47 - -
Male sex 296 (52.9) 263 (48.3) 259 (45.0) 265 (45.5) 0.032 0.024
Age, yr 61±13 60±13 60±12 61±12 0.541 0.355
DD, mo 96 (24–144) 84 (36–144) 84 (24–144) 87 (24–144) 0.919 0.985
Hypertension 282 (50.4) 279 (51.2) 313 (54.3) 349 (60.0) 0.004 0.005
Obesity 231 (41.3) 260 (47.7) 273 (47.4) 280 (48.1) 0.066 0.066
Smoking 114 (20.4) 116 (21.3) 111 (19.3) 112 (19.2) 0.800 0.775
IIA 431 (77.0) 389 (71.4) 386 (67.0) 407 (69.9) 0.002 0.002
LLD 134 (23.9) 150 (27.5) 172 (29.9) 221 (38.0) <0.001 <0.001
Metformin 297 (53.0) 318 (58.3) 326 (56.6) 320 (55.0) 0.325 0.412
SBP, mm Hg 130±17 133±18 133±18 134±18 0.005 0.007
DBP, mm Hg 79±10 80±10 80±9 80±10 0.061 0.065
WC, cm 87.9±10.4 88.9±10.3 88.7±9.8 89.9±10.3 0.016 0.006
WHR 0.9±0.06 0.91±0.06 0.91±0.06 0.91±0.06 0.044 0.009
BMI, kg/m2 24.5±3.4 24.8±3.5 24.9±3.5 25.0±3.5 0.035 0.036
WBC, ×109/L 6 (5.2–7.3) 6.1 (5.1–7.2) 6.1 (5.2–7.3) 6.2 (5.3–7.4) 0.213 0.149
NEUT, % 63.03±9.03 62.49±8.82 62.44±9.15 62.58±8.77 0.686 0.887
FPG, mmol/L 7.6 (6.04–9.72) 7.55 (6.07–9.39) 7.64 (6.18–9.5) 7.78 (6.2–9.48) 0.806 0.875
2-hr PPG, mmol/L 13.82 (10.32–17.14) 13.29 (9.68–16.44) 13.26 (9.84–16.8) 13.18 (9.91–16.62) 0.251 0.335
HbA1c, % 9.31±2.35 8.89±2.26 9.04±2.39 8.81±2.24 0.003 0.003
FCP, ng/mL 1.44 (0.85–2.12) 1.65 (0.99–2.39) 1.66 (1.09–2.53) 1.86 (1.24–2.9) <0.001 <0.001
2-hr PCP, ng/mL 3.29 (1.78–5.08) 3.73 (2.19–5.34) 3.92 (2.19–5.53) 4.07 (2.41–5.67) <0.001 <0.001
HOMA2-IR 1.30 (0.80–1.90) 1.4 (0.9–2.1) 1.4 (0.9–2.2) 1.6 (1–2.4) <0.001 <0.001
TG, mmol/L 1.22 (0.86–1.74) 1.35 (0.97–1.94) 1.47 (1.02–2.08) 1.68 (1.16–2.58) <0.001 <0.001
TC, mmol/L 4.53±1.05 4.65±0.98 4.7±1.14 4.92±1.12 <0.001 <0.001
HDL-C, mmol/L 1.13±0.33 1.13±0.3 1.13±0.3 1.1±0.27 0.198 0.123
LDL-C, mmol/L 3.04±0.92 3.12±0.84 3.13±0.99 3.2±0.98 0.044 0.074
Lp(a) 8.1 (4.7–17.1) 9.6 (5.3–17.7) 9.8 (5.63–18.88) 11.75 (6.37–23.33) <0.001 <0.001
ALT, U/L 16 (12–26) 17 (12–26) 19 (14–29) 19.5 (14–31) <0.001 <0.001
γ-GT, U/L 21 (15–34) 21 (15–31) 23 (16–34) 24 (17–36) <0.001 <0.001
Scr, μmol/L 64 (53–79) 65 (54–78) 65 (54–78) 67 (55–86) 0.014 <0.001
SUA, μmol/L 295 (242–355) 307 (257–366) 313 (254–374) 325 (277–383) <0.001 <0.001
UAE, mg/day 10.73 (6.28–23.28) 11.15 (6.6–26.11) 10.77 (6.35–29.1) 12.32 (7.02–50.23) 0.001 <0.001
eGFR, mL/min/1.73 m2 112 (91–137) 109 (92–131) 108 (90–131) 104 (81–129) <0.001 <0.001
CRP, mg/L 1.09 (0.44–3.39) 1.1 (0.48–2.96) 1.1 (0.5–2.72) 1.22 (0.54–3.01) 0.727 0.781

Values are presented as number (%), mean±standard deviation, or median (interquartile range). The P values were not adjusted for sex for the trend.

RBP, retinol-binding protein; DD, diabetes duration; IIA, insulin or insulin analogue; LLD, lipid-lowering drug; SBP, systolic blood pressure; DBP, diastolic blood pressure; WC, waist circumference; WHR, waist-to-hip ratio; BMI, body mass index; WBC, white blood cell; NEUT, neutrophils; FPG, fasting plasma glucose; PPG, postprandial plasma glucose; HbA1c, glycated hemoglobin A1c; FCP, fasting C-peptide; PCP, postprandial C-peptide; HOMA2-IR, homeostasis model assessment of insulin resistance; TG, triglycerides; TC, total cholesterol; HDL-C, high-density lipoprotein cholesterol; LDL-C, low-density lipoprotein cholesterol; Lp(a), lipoprotein(a); ALT, alanine aminotransferase; γ-GT, γ-glutamyltransferase; Scr, serum creatinine; SUA, serum uric acid; UAE, urinary albumin excretion; eGFR, estimated glomerular filtration rate; CRP, C-reactive protein.

a The P values were adjusted for sex for the trend.

Table 2.
The association of RBP quartiles with NAFLD
OR (95% CI)
P for trend
Q1 Q2 Q3 Q4
Model 1 1 1.427 (1.091–1.866) 1.600 (1.229–2.082) 1.747 (1.343–2.273) <0.001
Model 2 1 1.373 (1.044–1.804) 1.556 (1.191–2.032) 1.639 (1.253–2.144) 0.002
Model 3 1 1.426 (1.062–1.914) 1.611 (1.209–2.148) 1.674 (1.252–2.237) 0.002
Model 4 1 1.702 (1.193–2.428) 1.645 (1.160–2.332) 1.445 (1.014–2.059) 0.014

Model 1: adjusted for age, sex, diabetes duration, smoking, hypertension, and obesity. Model 2: further adjusted for the use of lipid-lowering drugs, metformin, and insulin or insulin analogues. Model 3: further adjusted for systolic blood pressure, diastolic blood pressure, waist circumference, waist-to-hip ratio, and body mass index. Model 4: further adjusted for white blood cell, neutrophils, total cholesterol, triglycerides, low-density lipoprotein cholesterol, high-density lipoprotein cholesterol, lipoprotein(a), serum creatinine, estimated glomerular filtration rate, serum uric acid, urinary albumin excretion, C-reactive protein, glycated hemoglobin A1c, fasting plasma glucose, 2-hour postprandial plasma glucose, fasting C-peptide, 2-hour postprandial C-peptide, and homeostasis model assessment of insulin resistance.

RBP, retinol-binding protein; NAFLD, nonalcoholic fatty liver disease; OR, odds ratio; CI, confidence interval.

Table 3.
The association of serum RBP levels with NAFLD
B statistic OR 95% CI P value
Model 1 0.224 1.251 1.136–1.377 <0.001
Model 2 0.197 1.218 1.103–1.344 <0.001
Model 3 0.194 1.215 1.091–1.353 <0.001
Model 4 0.144 1.155 1.012–1.318 0.033

Model 1: adjusted for age, sex, diabetes duration, smoking, hypertension, and obesity. Model 2: further adjusted for the use of lipid-lowering drugs, metformin, and insulin or insulin analogues. Model 3: further adjusted for systolic blood pressure, diastolic blood pressure, waist circumference, waist-to-hip ratio, and body mass index. Model 4: further adjusted for white blood cell, neutrophils, total cholesterol, triglycerides, low-density lipoprotein cholesterol, high-density lipoprotein cholesterol, lipoprotein(a), serum creatinine, estimated glomerular filtration rate, serum uric acid, urinary albumin excretion, C-reactive protein, glycated hemoglobin A1c, fasting plasma glucose, 2-hour postprandial plasma glucose, fasting C-peptide, 2-hour postprandial C-peptide, and homeostasis model assessment of insulin resistance.

RBP, retinol-binding protein; NAFLD, nonalcoholic fatty liver disease; OR, odds ratio; CI, confidence interval.

TOOLS
Similar articles