

 PDF
PDF Citation
 Print
Print


INTRODUCTION
MATERIALS AND METHODS
Data source
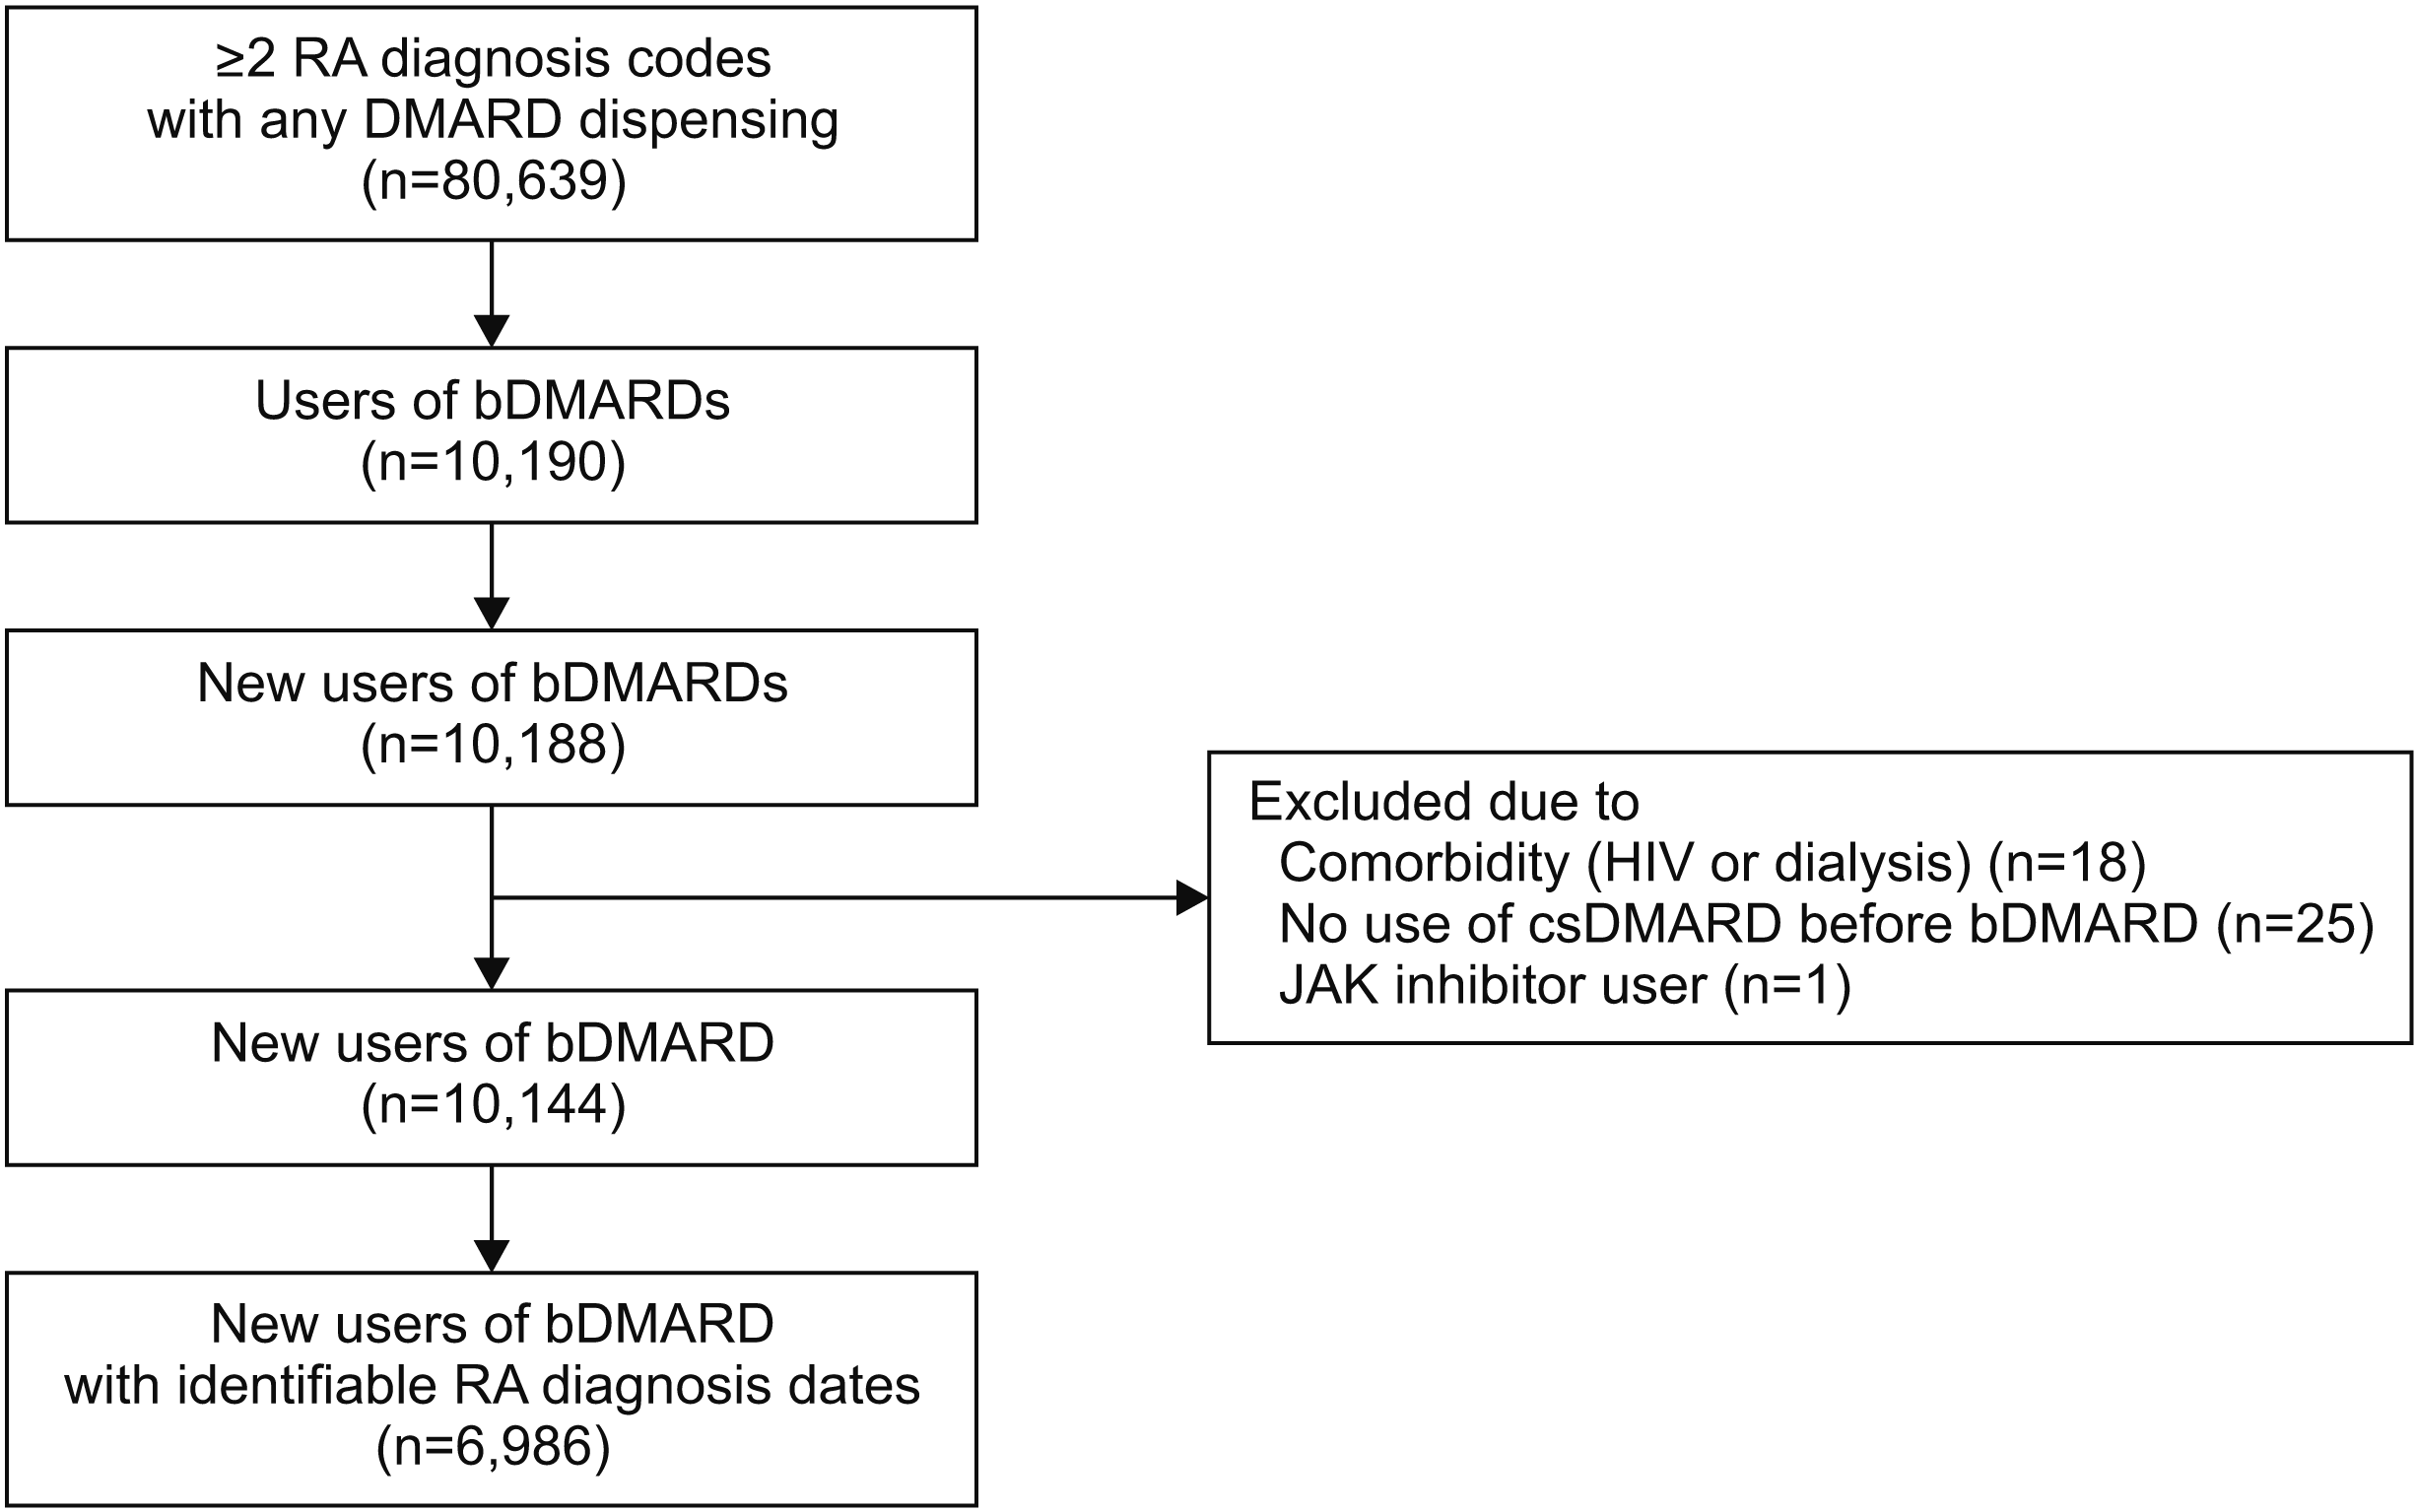
Study population
Outcomes
Patient comorbidities
Table 1
| Covariates |
bDMARD initiators with identifiable RA diagnosis dates (n=6,986) |
|---|---|
| Age at index date (yr) | 56.5±10.6 |
| Female sex | 5,466 (78.2) |
| Index bDMARDs | |
| TNF inhibitors | 5,887 (84.3) |
| Abatacept | 524 (7.5) |
| Tocilizumab | 536 (7.7) |
| Rituximab | 39 (0.6) |
| Index year | |
| 2004 | 25 (0.4) |
| 2005 | 75 (1.1) |
| 2006 | 106 (1.5) |
| 2007 | 156 (2.2) |
| 2008 | 251 (3.6) |
| 2009 | 496 (7.1) |
| 2010 | 496 (7.1) |
| 2011 | 640 (9.2) |
| 2012 | 895 (12.8) |
| 2013 | 856 (12.3) |
| 2014 | 1,237 (17.7) |
| 2015 | 1,008 (14.4) |
| 2016 | 745 (10.7) |
| Pre-RA comorbidities* | |
| Stroke or TIA | 269 (3.9) |
| Myocardial infarction | 34 (0.5) |
| Angina pectoris | 304 (4.4) |
| Coronary revascularization | 11 (0.2) |
| Heart failure | 103 (1.5) |
| Atrial fibrillation | 44 (0.6) |
| Venous thromboembolism | 79 (1.1) |
| Hypertension | 2,179 (31.2) |
| Hyperlipidemia | 1,665 (23.8) |
| Obesity | 18 (0.3) |
| Diabetes | 1,095 (15.7) |
| Chronic hepatitis B or C | 280 (4.0) |
| COPD | 1,275 (18.3) |
| Bronchiectasis | 160 (2.3) |
| Asthma | 876 (12.5) |
| IBD | 39 (0.6) |
| Chronic kidney disease | 94 (1.4) |
| Hypothyroidism | 537 (7.7) |
| Cancer | 249 (3.6) |
| Hospitalizations | 2,234 (32.0) |
| Comorbidity index | 1.9±1.3 |
Values are presented as mean±standard deviation or number (%). bDMARDs: biologic disease modifying anti-rheumatic drugs, COPD: chronic obstructive pulmonary disease, IBD: inflammatory bowel disease, NA: not applicable, RA: rheumatoid arthritis, TNF: tumor necrosis factor, TIA: transient ischemic attack. *Pre-RA omorbidities ascertained from the 1-year period prior to RA diagnosis.
![]()
Statistical analysis
RESULTS
Characteristics of the study population
Treatment patterns and proxy fulfillments within 1-year post-diagnosis
Table 2
| bDMARD initiators with RA diagnosis dates (n=6,986) | |||
|---|---|---|---|
| At RA diagnosis | 1-year post-diagnosis period | 1-year pre-index period | |
| csDMARD used | |||
| MTX | 3,834 (54.9) | 5,953 (85.2) | 6,339 (90.7) |
| leflunomide | 240 (3.4) | 2,263 (32.4) | 3,699 (53.0) |
| Sulfasalazine | 2,006 (28.7) | 3,668 (52.5) | 2,875 (41.2) |
| Tacrolimus | 14 (0.2) | 489 (7.0) | 1,474 (21.1) |
| Hydroxychloroquine | 4,417 (63.2) | 5,545 (79.4) | 4,226 (60.5) |
| Dose regimen of MTX | |||
| Mean maximal dose (mg/week) | 9.2±10.1* | 14.1±13.1† | 14.8±17.3‡ |
| Maximal MTX dose ever used | |||
| <10 mg/week | 2,108 (55.0)* | 773 (13.0)† | 563 (8.9)‡ |
| 10~<15 mg/week | 1,435 (37.4)* | 2,271 (38.2)† | 2,442 (38.5)‡ |
| 15~<20 mg/week | 237 (6.2)* | 2,357 (39.6)† | 2,700 (42.6)‡ |
| ≥20 mg/week | 54 (1.4)* | 552 (9.3)† | 634 (10.0) |
| Subcutaneous MTX users | 29 (0.4) | 196 (2.8) | 313 (4.5) |
| csDMARD combination | 3,300 (47.2) | 5,987 (85.7) | 6,898 (98.7) |
| MTX-based combination | 2,738 (39.2) | 5,526 (79.1) | 5,956 (85.3) |
| Ever-users of glucocorticoid | 5,253 (75.2) | 6,727 (96.3) | 6,845 (98.0) |
| Mean daily dose of glucocorticoid (mg)§ | - | 4.4±4.2 | 5.5±3.7 |
Values are presented as number (%) or mean±standard deviation. bDMARD: biologic disease modifying anti-rheumatic disease, csDMARD: conventional synthetic disease modifying anti-rheumatic drug, MTX: methotrexate, RA: rheumatoid arthritis. *% among 3,834 MTX users; †% among 5,953 MTX users; ‡% among 6,339 MTX users; §prednisone-equivalent dose.
![]()
Treatment patterns and MTX dose escalation fulfillment during the 1-year pre-index period
Longitudinal trends in treatment patterns of csDMARDs
Table 3
|
~2007 (n=362) |
2008 (n=251) |
2009 (n=496) |
2010 (n=496) |
2011 (n=640) |
2012 (n=895) |
2013 (n=856) |
2014 (n=1,237) |
2015 (n=1,008) |
2016 (n=745) |
p for trend |
|
|---|---|---|---|---|---|---|---|---|---|---|---|
| MTX as a first csDMARD | 56.1 | 49.0 | 52.0 | 52.2 | 50.6 | 54.2 | 54.6 | 57.6 | 56.7 | 57.7 | |
| Initial MTX dose | |||||||||||
| ≥15 mg/week | 15.8 | 11.4 | 9.7 | 6.2 | 8.1 | 6.6 | 8.3 | 7.4 | 5.5 | 5.1 | <0.001 |
| Maximal MTX dose ever used* | |||||||||||
| ≥15 mg/week | 61.6 | 50.2 | 54.2 | 52.2 | 50.6 | 48.2 | 50.0 | 47.7 | 44.0 | 42.5 | <0.001 |
| csDMARDs ever used | |||||||||||
| MTX | 91.2 | 82.5 | 86.7 | 85.7 | 84.5 | 84.4 | 84.0 | 86.1 | 84.5 | 84.4 | 0.073 |
| Leflunomide | 32.6 | 31.5 | 37.5 | 32.9 | 33.6 | 30.2 | 29.8 | 34.4 | 32.4 | 30.6 | |
| Sulfasalazine | 59.7 | 57.4 | 58.3 | 53.8 | 53.0 | 51.6 | 52.8 | 48.5 | 52.3 | 49.7 | <0.001 |
| Tacrolimus | 0.0 | 0.0 | 2.4 | 7.3 | 7.7 | 6.3 | 8.3 | 6.7 | 10.4 | 10.6 | <0.001 |
| Hydroxychloroquine | 80.4 | 82.9 | 81.7 | 82.7 | 81.4 | 77.7 | 76.4 | 79.2 | 78.9 | 78.5 | 0.019 |
| csDMARD combination | 90.1 | 85.7 | 90.1 | 86.7 | 86.9 | 84.7 | 82.6 | 85.4 | 84.6 | 85.9 | 0.003 |
Values are presented as percent. csDMARD: conventional synthetic disease modifying anti-rheumatic disease, MTX: methotrexate, RA: rheumatoid arthritis. *% among annual MTX users (n=330 in ~2007, 207 in 2008, 430 in 2009, 425 in 2010, 541 in 2011, 755 in 2012, 719 in 2013, 1,065 in 2014, 852 in 2015, 629 in 2016).
![]()
Predictors associated with proxy fulfillments
Table 4
| Predictors | MTX ≥15 mg/week* | Glucocorticoid discontinuation† |
|---|---|---|
| Age at diagnosis (per 1-year decrease) | 1.02 (1.01~1.02) | |
| Male | 1.27 (1.12~1.45) | 1.34 (1.12~1.60) |
| Medications | ||
| Maximal MTX ≥15 mg/week | NA | 1.63 (1.40~1.89) |
| csDMARD combination | 3.74 (3.02~4.62) | 1.34 (1.01~1.79) |
| Glucocorticoid use | 2.50 (1.74~3.59) | NA |
| Cox-2 inhibitor use | 1.27 (1.14~1.41) | |
| Comorbidities | ||
| Chronic hepatitis B or C | 1.33 (1.03~1.73) | 1.93 (1.25~2.96) |
| Hospitalization | 1.30 (1.11~1.53) |
Values are presented as odds ratio (95% confidence interval). Cox: cyclooxygenase, csDMARD: conventional synthetic disease modifying antirheumatic drug, MTX: methotrexate, NA: not applicable, RA: rheumatoid arthritis. *The model included age, sex, index year, csDMARDs (leflunomide, tacrolimus, hydroxychloroquine, sulfasalazine), combination therapy, glucocorticoids, analgesics, and comorbidity list in Table 1. Comorbidities included in the model were ascertained from the 1st year after RA diagnosis. †The model included age, gender, index year, csDMARDs (MTX, leflunomide, tacrolimus, hydroxychloroquine, sulfasalazine), MTX dose, combination therapy, analgesics, and comorbidity list in Table 1. Comorbidities included in the model were ascertained from the 1st year after RA diagnosis.
![]()
 XML Download