

 PDF
PDF Citation
 Print
Print


Introduction
As the most durable parts of the human body, dental data enable the identification of unknown human remains, which are useful for the reconstruction of a biological profile given that this data can allow one to ascertain age and sex in a forensic context [1, 2]. Obviously, dental morphological traits help to restrict the number of identification candidates [3, 4]. Human identification through dental evidence is based on the detection of dental features by comparisons of ante-mortem (AM) dental records and post-mortem (PM) findings, and this process has been shown to be the preeminent method for human identification in mass disaster situations [5]. Typically, forensic radiologists evaluate the similarities and differences between AM and PM dental data based on radiographs [6].
Recent new technologies allow us to reconstruct an individual’s dental traits with a high level of accuracy. As an example, intraoral scanners (IOSs) perform three-dimensional (3D) reconstructions of an individual’s oral cavity and can analyze the adequacy of treatments [3]. Scanned 3D images of teeth and soft tissues in the oral cavity are considered alternatives to the traditional plaster model in dentistry [7]. In addition, scanned data can be permanently stored in a digital medium, such as a computer, and can be transmitted via the internet, enabling quick information exchanges [8]. For this reason, this technology enables more accurate and convenient diagnoses and treatments by those who practice dentistry [7]. Furthermore, the scope of its usage is currently expanding with the convergence of various technologies [8].
However, there are few studies that take advantage of these 3D dental images in a forensic context. For purposes of human identification, dental data produced by an intraoral scanner can be applied to population studies. The high reliability, ease of handling, and the reproducible 3D images produced through IOSs are appealing aspects for potential forensic applicability. For example, a study using 3D dental images obtained with IOSs exhibited a clear trend towards the validity of the use of 3D images for human identification purposes [3]. The study showed that intraoral 3D images present sufficient morphological detail to be classified for ancestry estimation. Furthermore, human identification using the intraoral digital scanning technique can be more rapid and convenient than the traditional method based on dental radiographs. Based on these advantages, 3D surface scanning images enable one to assess many opportunities during the presentation of case reports, for both teaching and research [9, 10]. In this context, it is believed that future applications of such 3D data can be expected to contribute to advancing forensic odontology [11].
Although the field of digital scanning is expanding rapidly, it is necessary to consider the limitations of current IOSs before the application of this technology, as all IOSs do not perform equally in terms of accuracy (i.e., trueness and precision) [12]. In forensic odontology, a fundamental question regarding the use of intraoral 3D images is whether they are capable of the recognition of dental morphological traits with a high level of accuracy. In this study, the accuracy of IOSs was quantitatively evaluated. The results of this study can be considered before the application of IOSs for the recording and analysis of teeth morphology and defects in forensic odontology.
Go to : 
Materials and Methods
The less damaged mandible specimen with many teeth remaining was selected to be scanned. The mandible was from an archaeological skeleton (estimated to be from the 16th–18th century) stored at the biological anthropology laboratory of the Department of Anthropology, Seoul National University (Fig. 1). This mandible is retrospective study data and is not subject to institutional review board review. The accuracy levels of three different scanners (CS3600; Carestream, Rochester, NY, USA; i500; Medit, Seoul, Korea, and Trios3; 3Shape, Copenhagen, Denmark) were evaluated and compared considering the features of the scanners, as shown in Table 1. These are the most popular scanners used in dentistry.
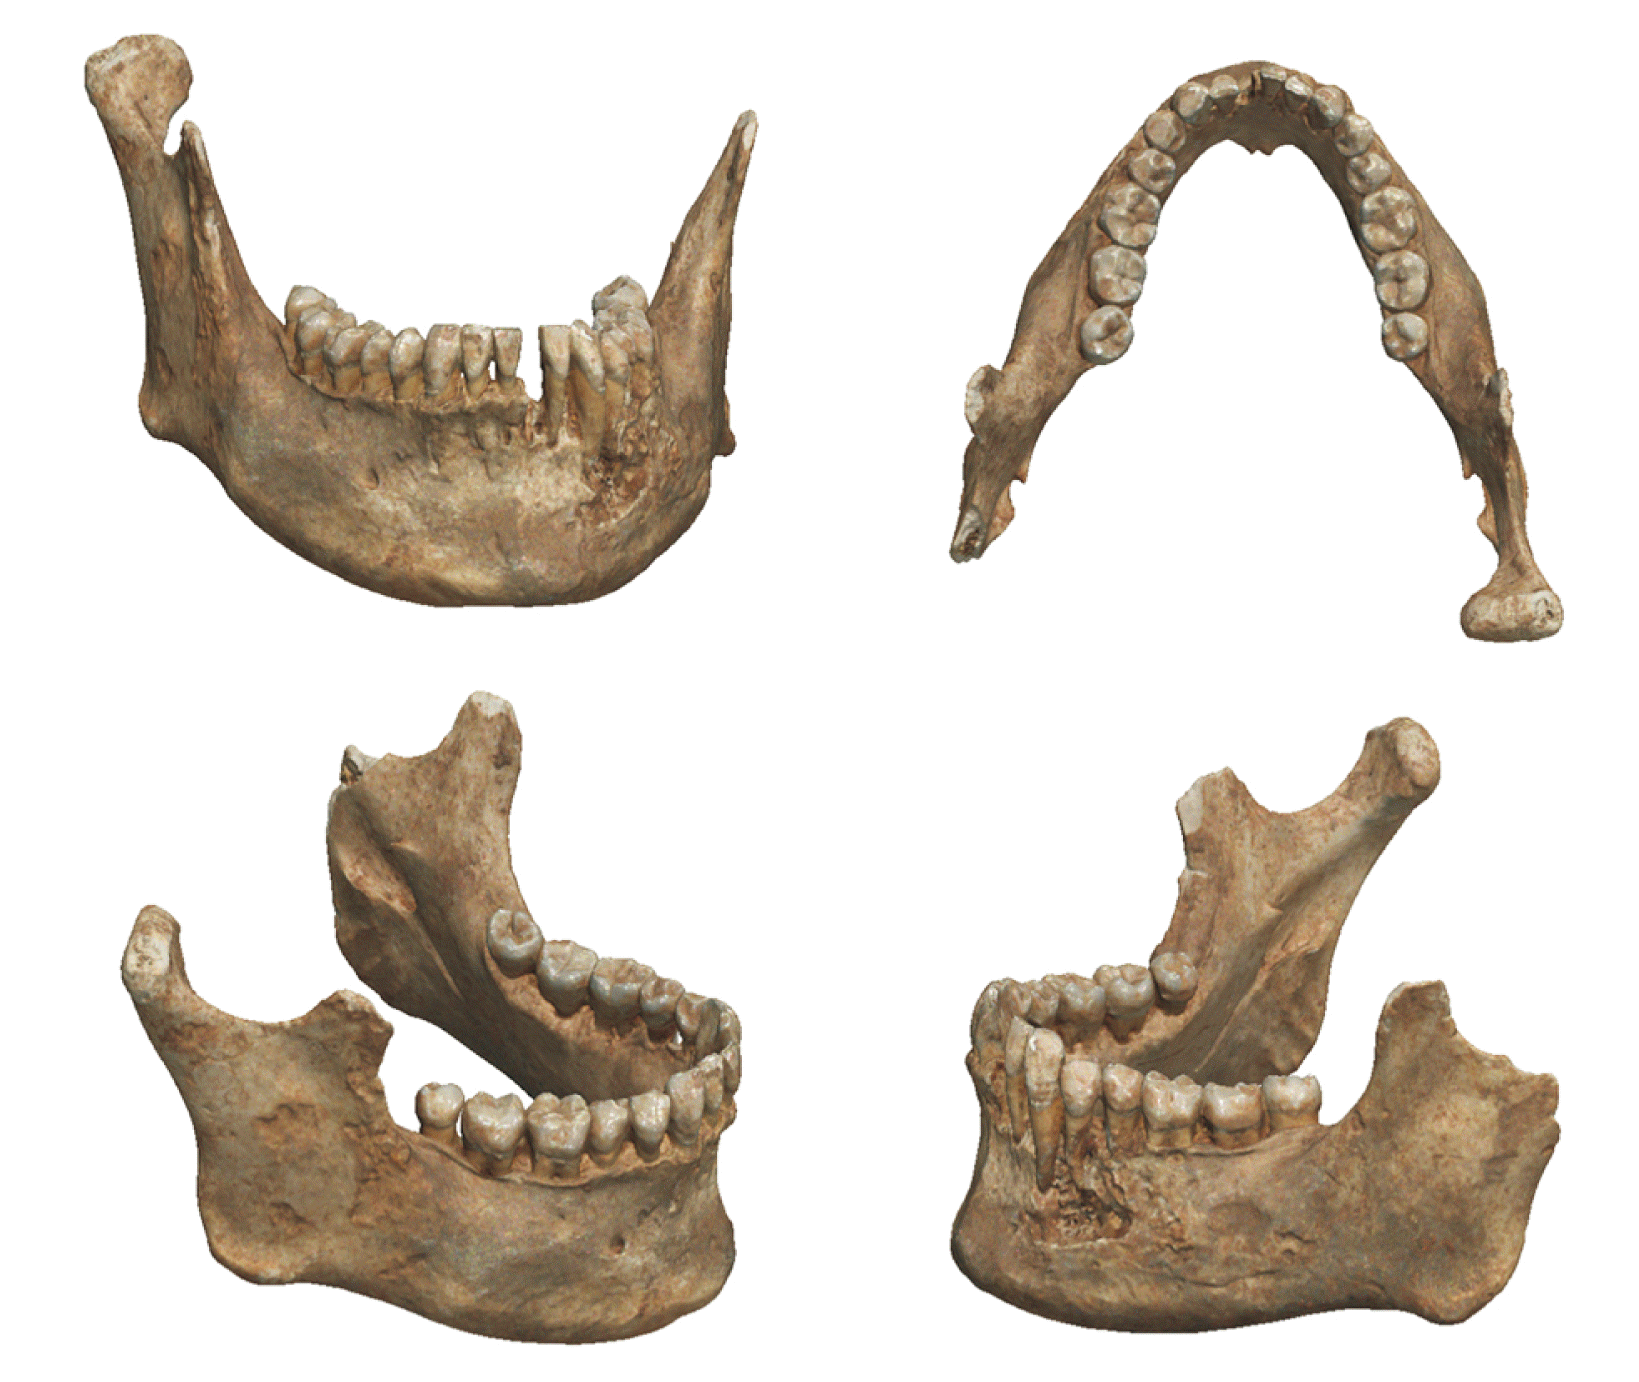
Table 1
Reference scanner (industrial) and intraoral scanner systems
![]()
Scanning started with the occlusal surface of the left rearmost teeth. The teeth and roots were scanned in the occlusal-buccal-lingual order by an experienced researcher (first author) [13]. After scanning the teeth and roots, we attempted to scan as many areas as possible from the base to the head of the mandible.
The specimen was scanned ten times with each scanner to compare precision rates, and an industrial 3D scanner (C500, Medit) was used as the reference scanner to analyze the degree of repeatability. All scan data were stored in stereolithography format.
The root mean square (RMS) is used as a standard statistical metric to measure model performance outcomes [14]. We used the RMS value to analyze errors in the scan data. The RMS value was calculated using a 3D analysis program (Geomagic Control X inspection software; 3D Systems Inc., Cary, NC, USA).
First, in order to check the repeatability of each scanner, the data measured by the same scanner were compared to each other. The nesting method used was as follows. After the initial alignment of the two datasets to approximate the position, the best fit was selected by setting the sampling rate to 50%. Thereafter, the sampling rate was set to 100% and a 3D comparison analysis was conducted. The analytical results were calculated for the minimum, maximum, mean, RMS, standard deviation, variance, plus average, minus average, and tolerance values.
The precision rates of three different scanners were analyzed based on one scan of the reference scan data, and the method used was identical to that described above. After repeatability and precision analyses of the full-scan data, only the section with teeth was extracted, and the repeatability and precision analyses were performed again. For teeth extraction, the Geomagic program was used to delete the teeth, leaving the anatomical cervical line.
To compare the repeatability and precision results, a one-way ANOVA analysis and a Tukey HSD (honestly significant difference) post hoc analysis were performed with a significance level of 0.05 (statistical software version 23.0; IBM Corp., Armonk, NY, USA).
Go to :
Results
Tables 2 and 3 present the results of repeated scanning by the three scanners. In the full-scan data, repeatability was highest with the i500 device (0.14±0.03 mm), followed by the Trios3 (0.69±0.11 mm), and the CS3600 (1.31±0.53 mm). There were statistically significant differences among the groups, and a Tukey HSD post-hoc test confirmed a significant difference between the CS3600 and the i500 outcomes (P-value=0.003).
Table 2
Precision results of full scan data and partial (teeth) scan data
![]()
Table 3
ANOVA analysis of precision of RMS values of full scan data and partial (teeth) scan data
| Variable | Full scan data | Partial scan data | |||||
|---|---|---|---|---|---|---|---|
| Mean difference | Standard error | P-value | Mean difference | Standard error | P-value | ||
| C500 | |||||||
| CS3600 | –1.30* | 0.22 | 0.002 | –0.11* | 0.02 | 0.001 | |
| i500 | –0.13 | 0.22 | 0.931 | –0.04 | 0.02 | 0.259 | |
| Trios | –0.68 | 0.22 | 0.063 | –0.09* | 0.02 | 0.006 | |
| CS3600 | |||||||
| i500 | 1.17* | 0.22 | 0.003 | 0.07* | 0.02 | 0.016 | |
| Trios | 0.62 | 0.22 | 0.088 | 0.02 | 0.02 | 0.609 | |
| i500 | |||||||
| Trios | –0.54 | 0.22 | 0.146 | -0.05 | 0.02 | 0.091 | |
![]()
In the partial-scan data, repeatability was highest with the i500 (0.08±0.02 mm), followed by the Trios3 (0.13±0.03 mm), and the CS3600 (0.16±0.02 mm). There were significant differences among the groups, and a post-hoc test again confirmed a significant difference between the CS3600 and the i500 outcomes (P-value=0.016).
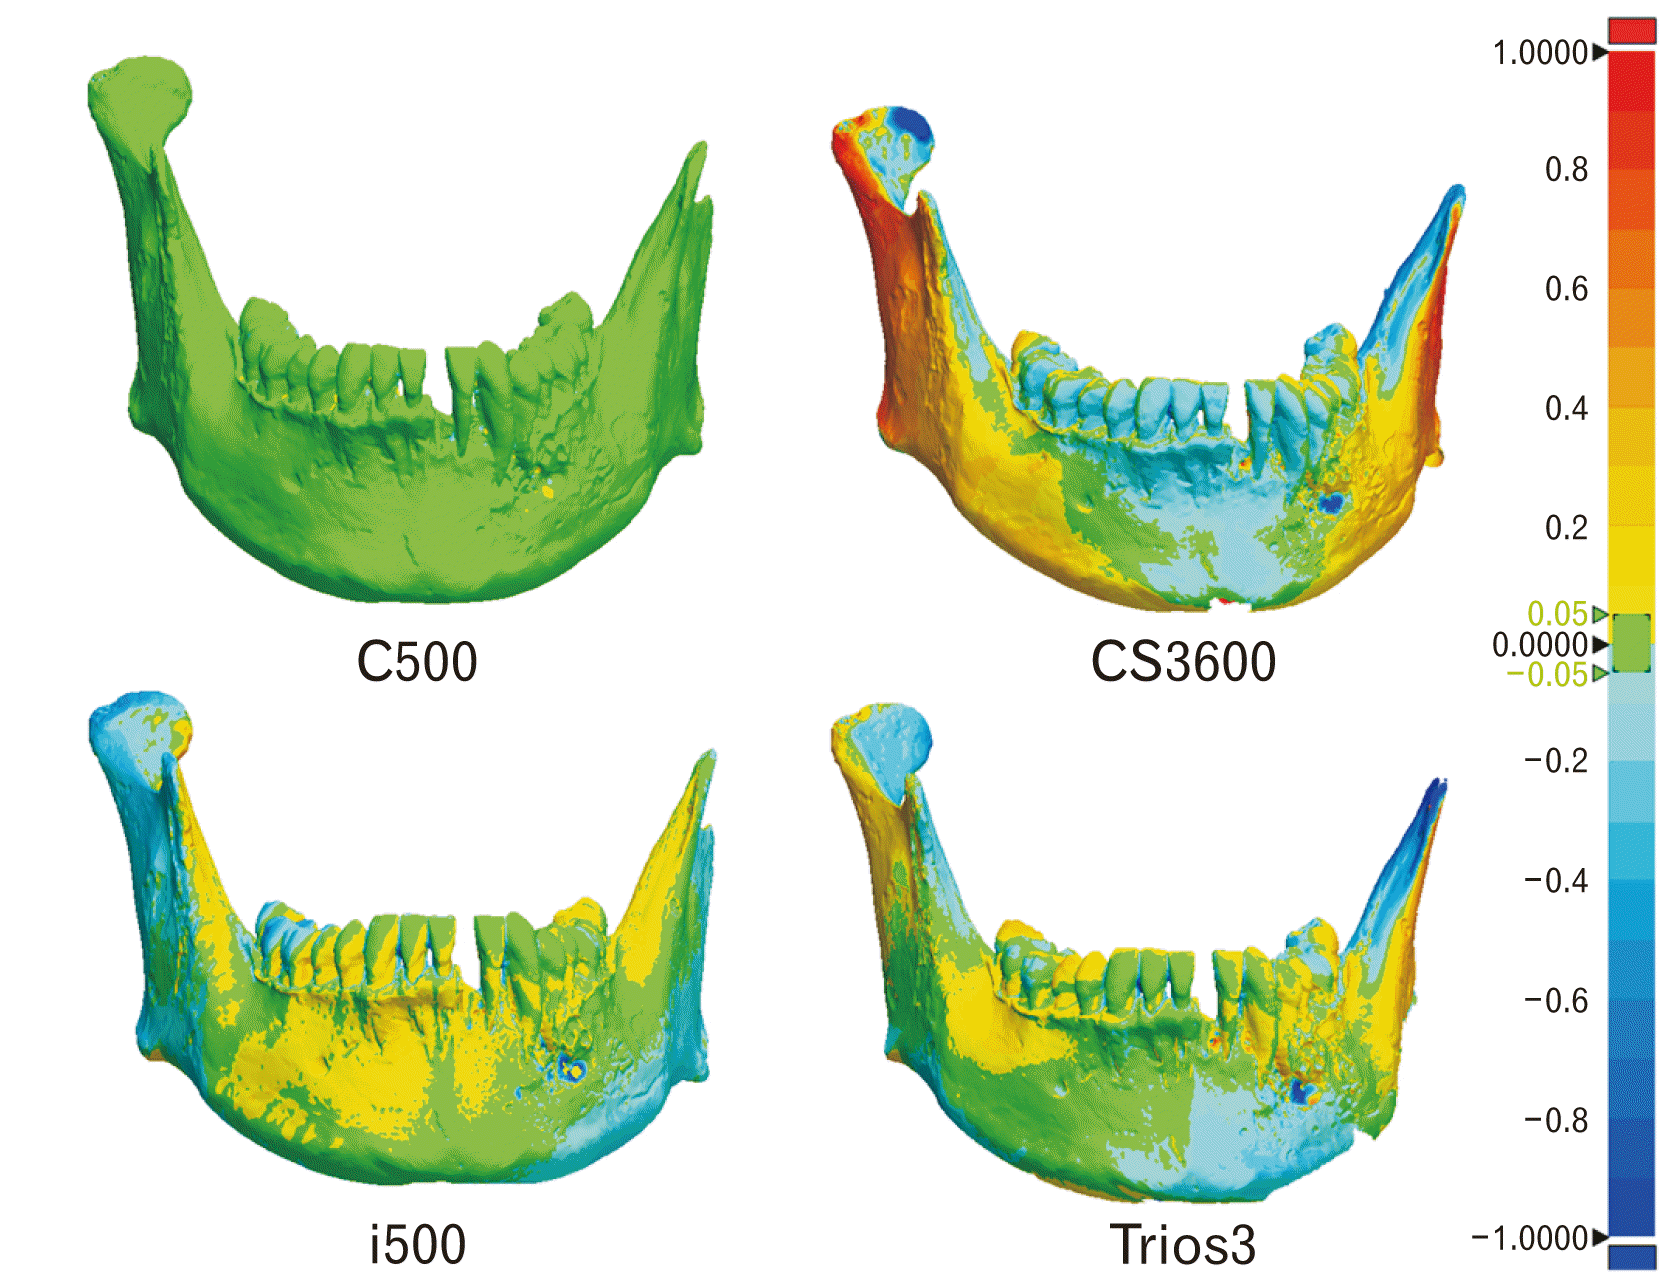
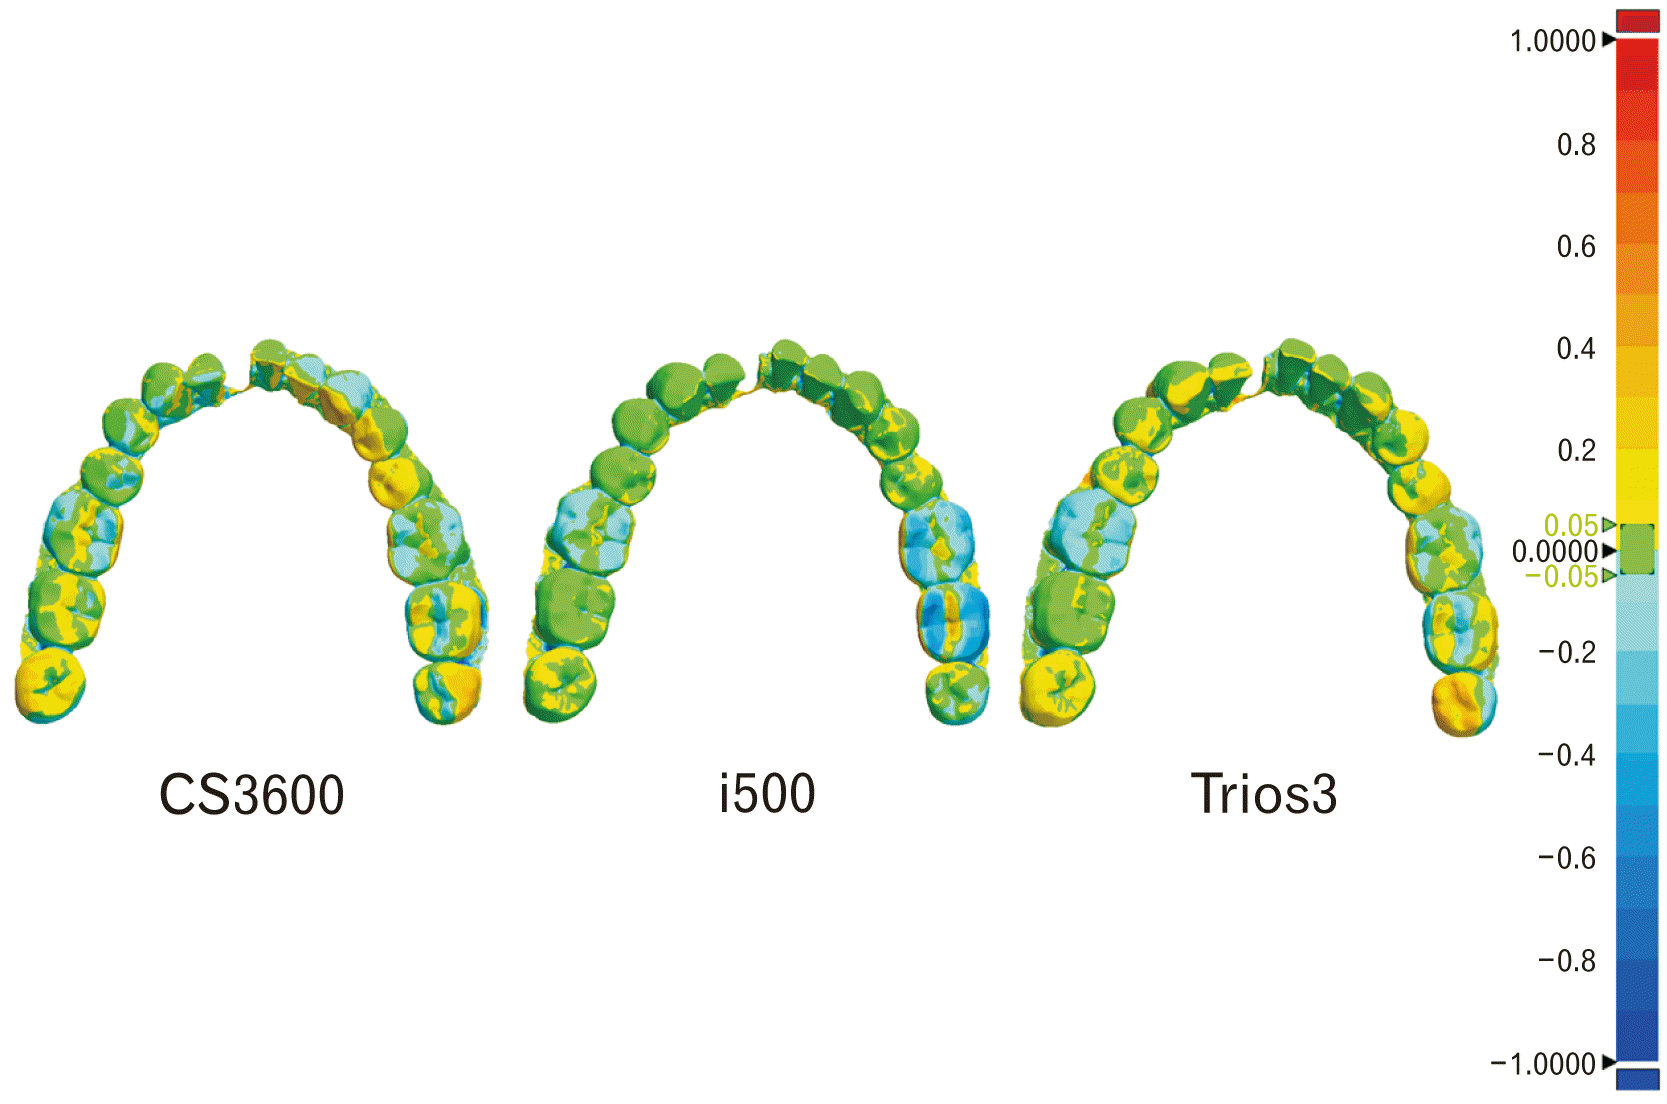
The amount of error for each instrument is represented as a spectrum in Fig. 2. Green indicates data within the tolerance threshold of 0.05 mm, red indicates upper deviations, and blue lower deviations. There were fewer partial-scan data from the CS3600 compared to the reference data, while errors in the head of the mandible area were mostly in the upper deviation category.
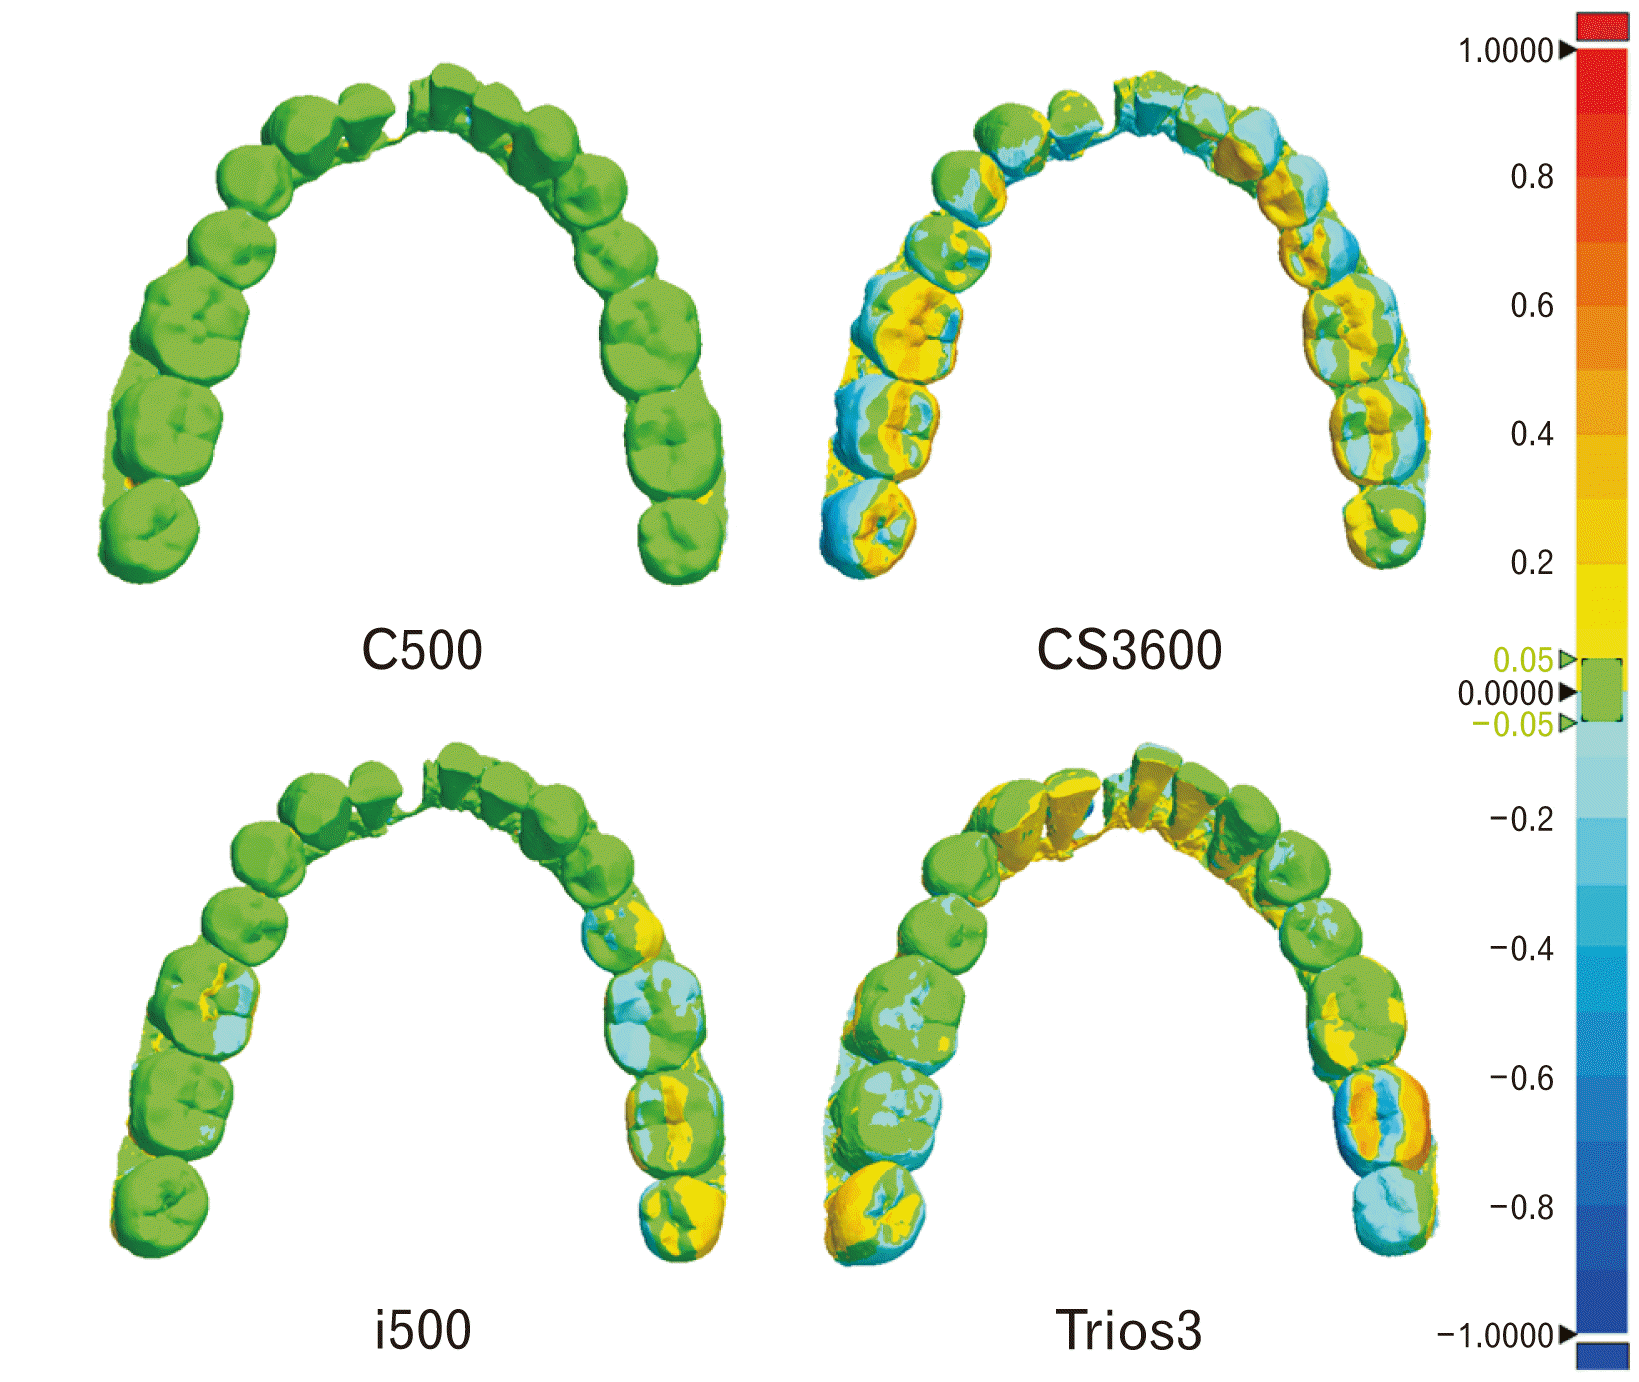
In Fig. 3, only partial-scan data are compared. In the i500 data, some errors in the molar area were lower deviations, while the Trios3 data showed both upper and lower deviations in the molar area. In the CS3600 data, both upper and lower deviations were apparent.
Tables 4 and 5 show the results of the precision RMS for the three scanners relative to the reference scanner result. In the full-scan data, the i500 had the highest precision (0.16±0.01 mm), followed by the Trios3 (0.22±0.01 mm), and the CS3600 (0.33±0.13 mm), but the differences were not statistically significant (P-value=0.091). In the partial-scan data, the Trios 3 device had the highest precision (0.22±0.02 mm), followed by the i500 (0.23±0.01 mm) and the CS3600 (0.24±0.04 mm), but again the differences were not statistically significant (P-value=0.762).
Table 4
Trueness results of full scan data and partial (teeth) scan data
![]()
Table 5
ANOVA analysis of the precisions of the RMS values of full scan data and partial (teeth) scan data
![]()
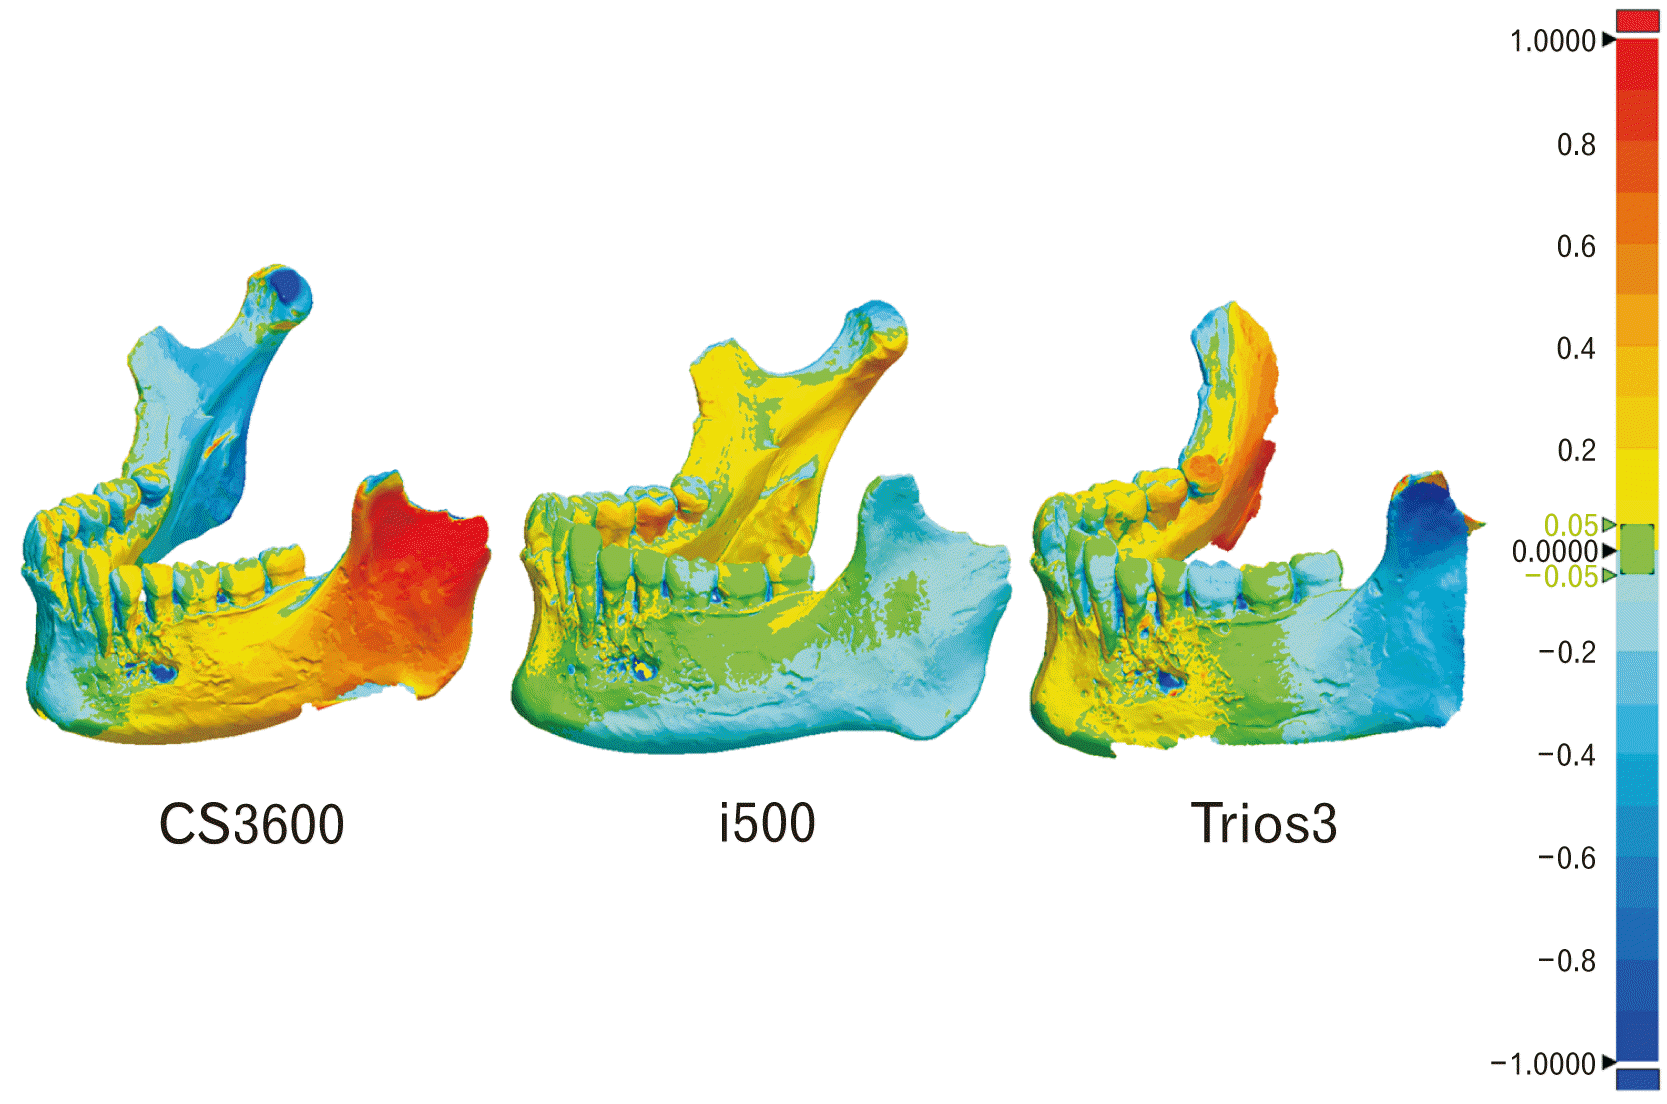
Figs. 4 and 5 show the precision analyses as spectra. Most partial-scan data from the three scanners were within the tolerance threshold, but there were upper and lower deviations in the data for the lower border of the mandible and the head of the mandible.
Go to :
Discussion
Since the fourth industrial revolution, research in the new paradigm has been underway as various technologies have converged. In this context, the field of forensic odontology is now using digital images of teeth for quick and accurate identification, and IOSs will increase the value of the utilization of digital images [13].
In this study, we selected oral scanners of the types popularly used in the dental field and analyzed the precision and trueness of images obtained from these scanners [15]. The results from three corresponding IOS analyses demonstrated that the precision of both the full-scan data (140 μm) and the tooth-scan data (80 μm) was highest in the i500 IOS. Trueness outcomes demonstrated showed that i500 (160 μm) was highest in full-scan data, whereas the Trios 3 was highest (220 μm) in tooth-scan data. However, there were no statistically significant differences. In a related study, Imburgia et al. [16] scanned a fully edentulous model and analyzed the precision and trueness. The precision of the fully edentulous model scan data was approximately 32–75 μm, higher than the results in this study. The trueness outcome was in the range of 60–106 μm, higher than the results in this study. Work by Lee et al. [17] found a trueness range of approximately 50–115 μm for the i500 and CS3600.
According to the American Dental Association, the clinically acceptable fit for indirect restorations is 50–100 μm, and several studies report clinical acceptable levels for restorations obtained from an IOS of 120 μm [18, 19]. The results of this study showed a larger error value than the studies mentioned above. It is estimated that the mandible used in this study came from an individual who died during the 16 to 18th century. As a result, over a long period of time, some of the mandible surface fractured or chipped. Also, some of the teeth may now be cracked and dry, and foreign matter may have prevented a surface smooth. Relevance can be gleaned from studies that show that cracks or debris on the tooth surface, or the complexity of the shape, can sometimes prevent a perfect scan or affect the accuracy [20]. Concerning this point, further research is needed to find the exact basis.
In this study, a larger area was scanned than is typically scanned for diagnosis or treatment in order to analyze a scan of the image across the mandible. Although the teeth were scanned well, some areas of the mandible could not be scanned well. In particular, scanning was difficult in sharp or angled areas such as coronoid process and mandibular angle. Mizumoto and Yilmaz [21] reported that sharp, undercut, angled, and steep structures are difficult to scan and result in inaccurate point clouds. Cuperus et al. [22] reported some omissions in the scan data because it is difficult to identify contact points when scanning the dental arch. The application of an IOS to forensic odontology requires additional research to ensure accurate scans of wider areas, which is a recent IOS-related issue. However, because we attempted to scan as much area as possible, we did not consider the time or amount of measurement data needed to obtain these scans.
In most IOS studies, the implications of forensic science are limited because laboratory or living patients are studied. In this study, real human remains (dried mandible) were used to check whether IOS can be applied to forensics. It may be difficult simply to contend that a dried mandible is directly related to forensic odontology, but discussing the applicability of an IOS, at least in the context of forensic odontology, can be expected to take the influence of dental identification to a new level in the realm of human identification.
The tooth shape scanned in 3D can be used in many ways. Further analysis can be carried out by modeling data obtained from scan images, or images can be 3d-printed and used for training after identification is completed. The accumulated images can also be used for artificial intelligence learning.
Traditional forensic analysis sometimes shows limitations related to the observer's subjective judgment [23, 24]. This research is expected to provide basic data pertaining to the progress of legal medicine toward digitalization and objective analysis. We also hope that the research results here will serve a scientific basis for improving the accuracy of PM data stored in 3D images.
In conclusion, there were differences in the precision and repeatability outcomes of full- and partial-scan data among the CS3600, i500, and Trios3 IOSs. For both full- and partial-scan data, the i500 had the highest precision. In terms of repeatability, the i500 was highest with full-scan data, while the Trios3 had the highest repeatability with partial-scan data. Considering that scanning of other areas of the oral cavity besides the teeth is important in order for IOS systems to be used in forensic odontology, the i500 appears to be the most appropriate IOS. However, as the scope of oral scanning is generally limited to teeth in dental practice, further discussion is needed on how to apply IOSs in the field of forensic odontology.
Exploiting the set of benefits of IOSs for forensic dental identification would enable a quick, accurate and objective analysis. It is expected that the results of this study can be used as part of a scientific basis for improving the accuracy of PM data stored as 3D images.
Go to :
 XML Download