

 PDF
PDF Citation
 Print
Print


INTRODUCTION
MATERIALS AND METHODS
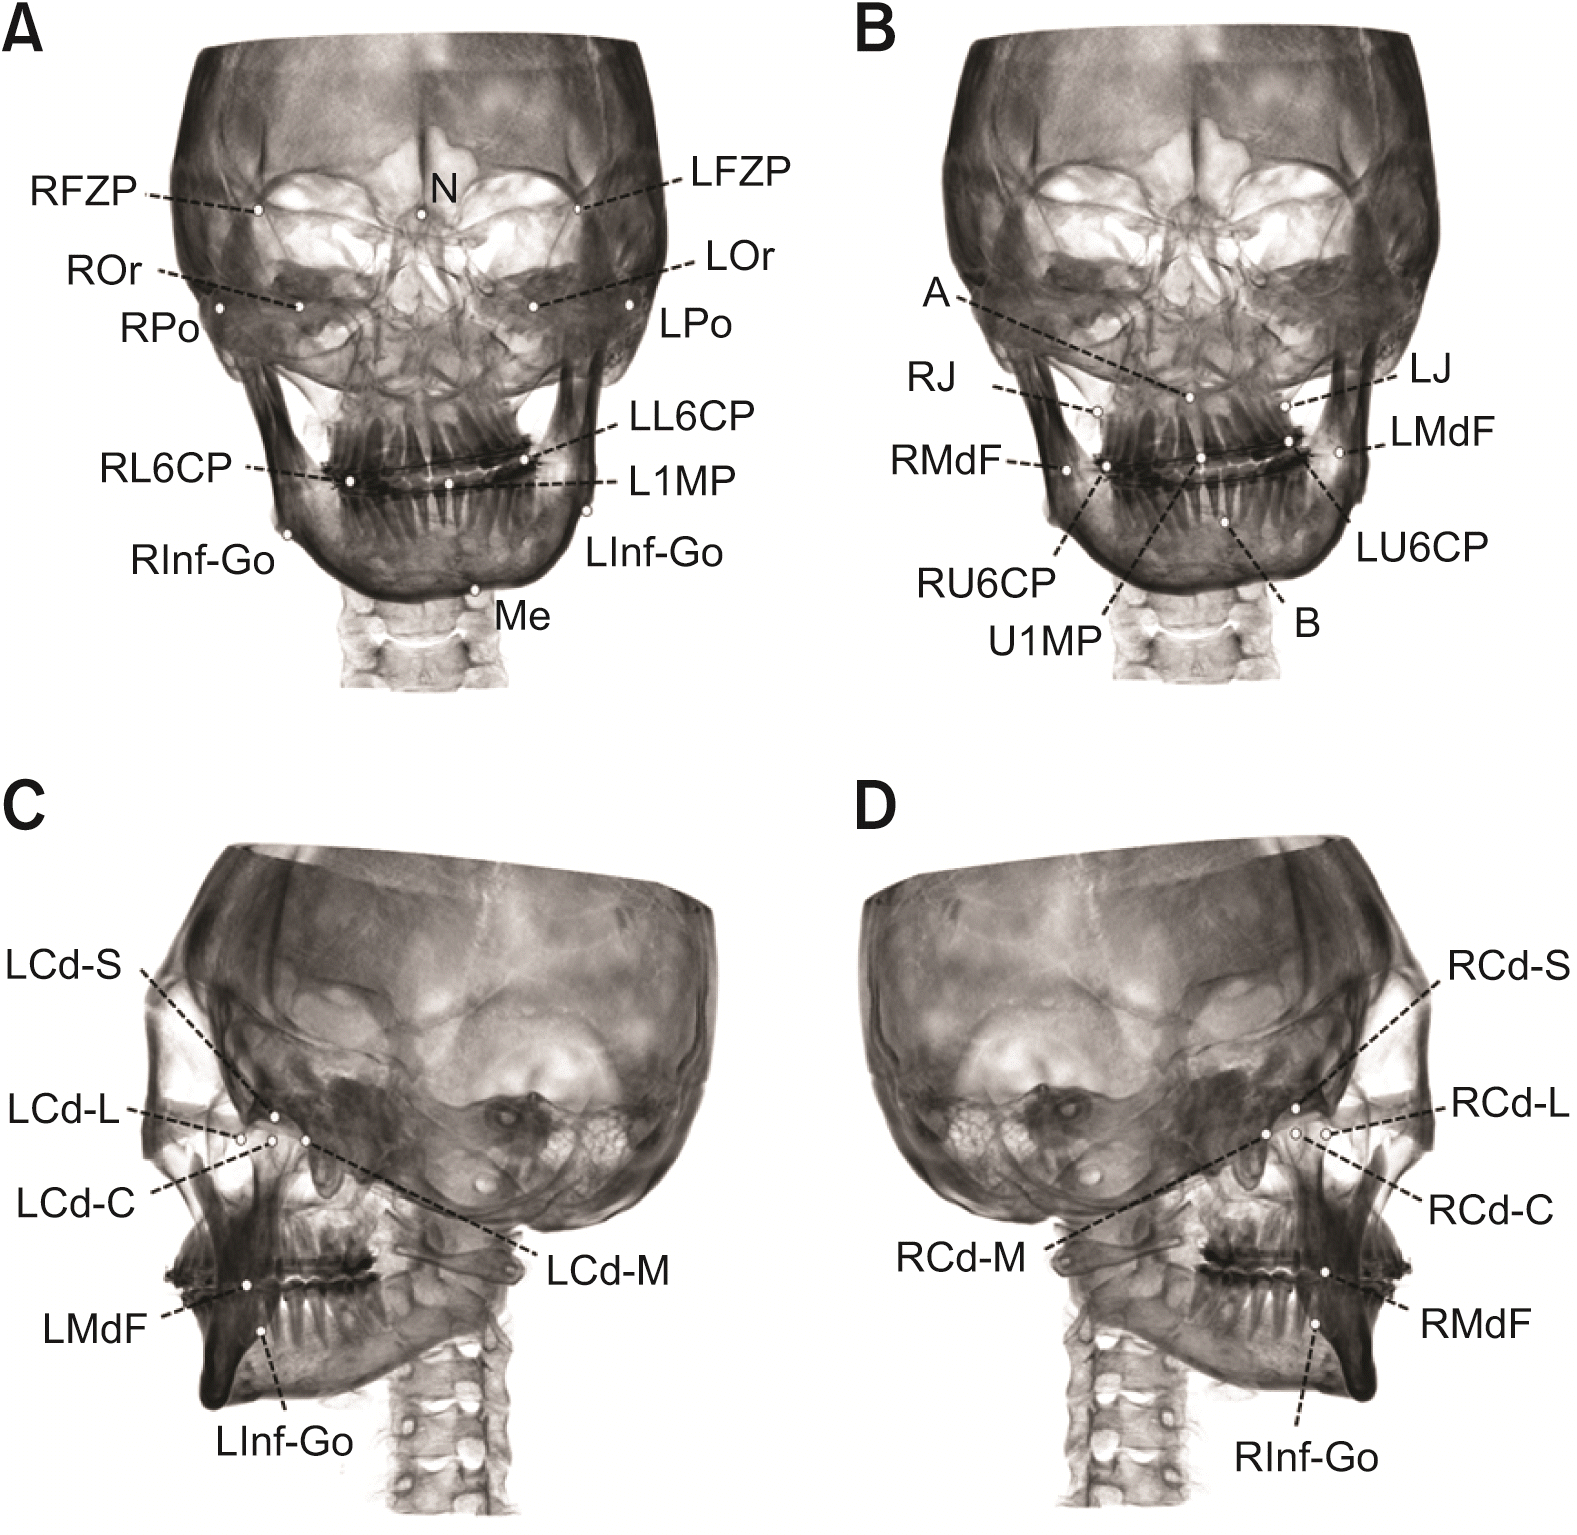 | Figure 1The landmarks used in this study. A, Nasion (N), frontozygomatic point, (FZP, R and L), porion (Po, R and L), orbitale (Or, R and L), mesiobuccal (MB) cusp tip of the mandibular first molar (L6CP, R and L), lower dental midline point (L1MP), inferior gonion (Inf-Go, R and L), and menton (Me). B, A point (A), jugal process point (J, R and L), mandibular foramen (MdF, R and L), MB cusp tip of the maxillary first molar (U6CP, R and L), B point (B), and upper dental midline point (U1MP). C and D, Condylion (Cd-S, R and L), lateral pole of condyle (Cd-L, R and L), medial pole of condyle (Cd-M, R and L), and condylar center (Cd-C, R and L).
R, right; L, left.
|
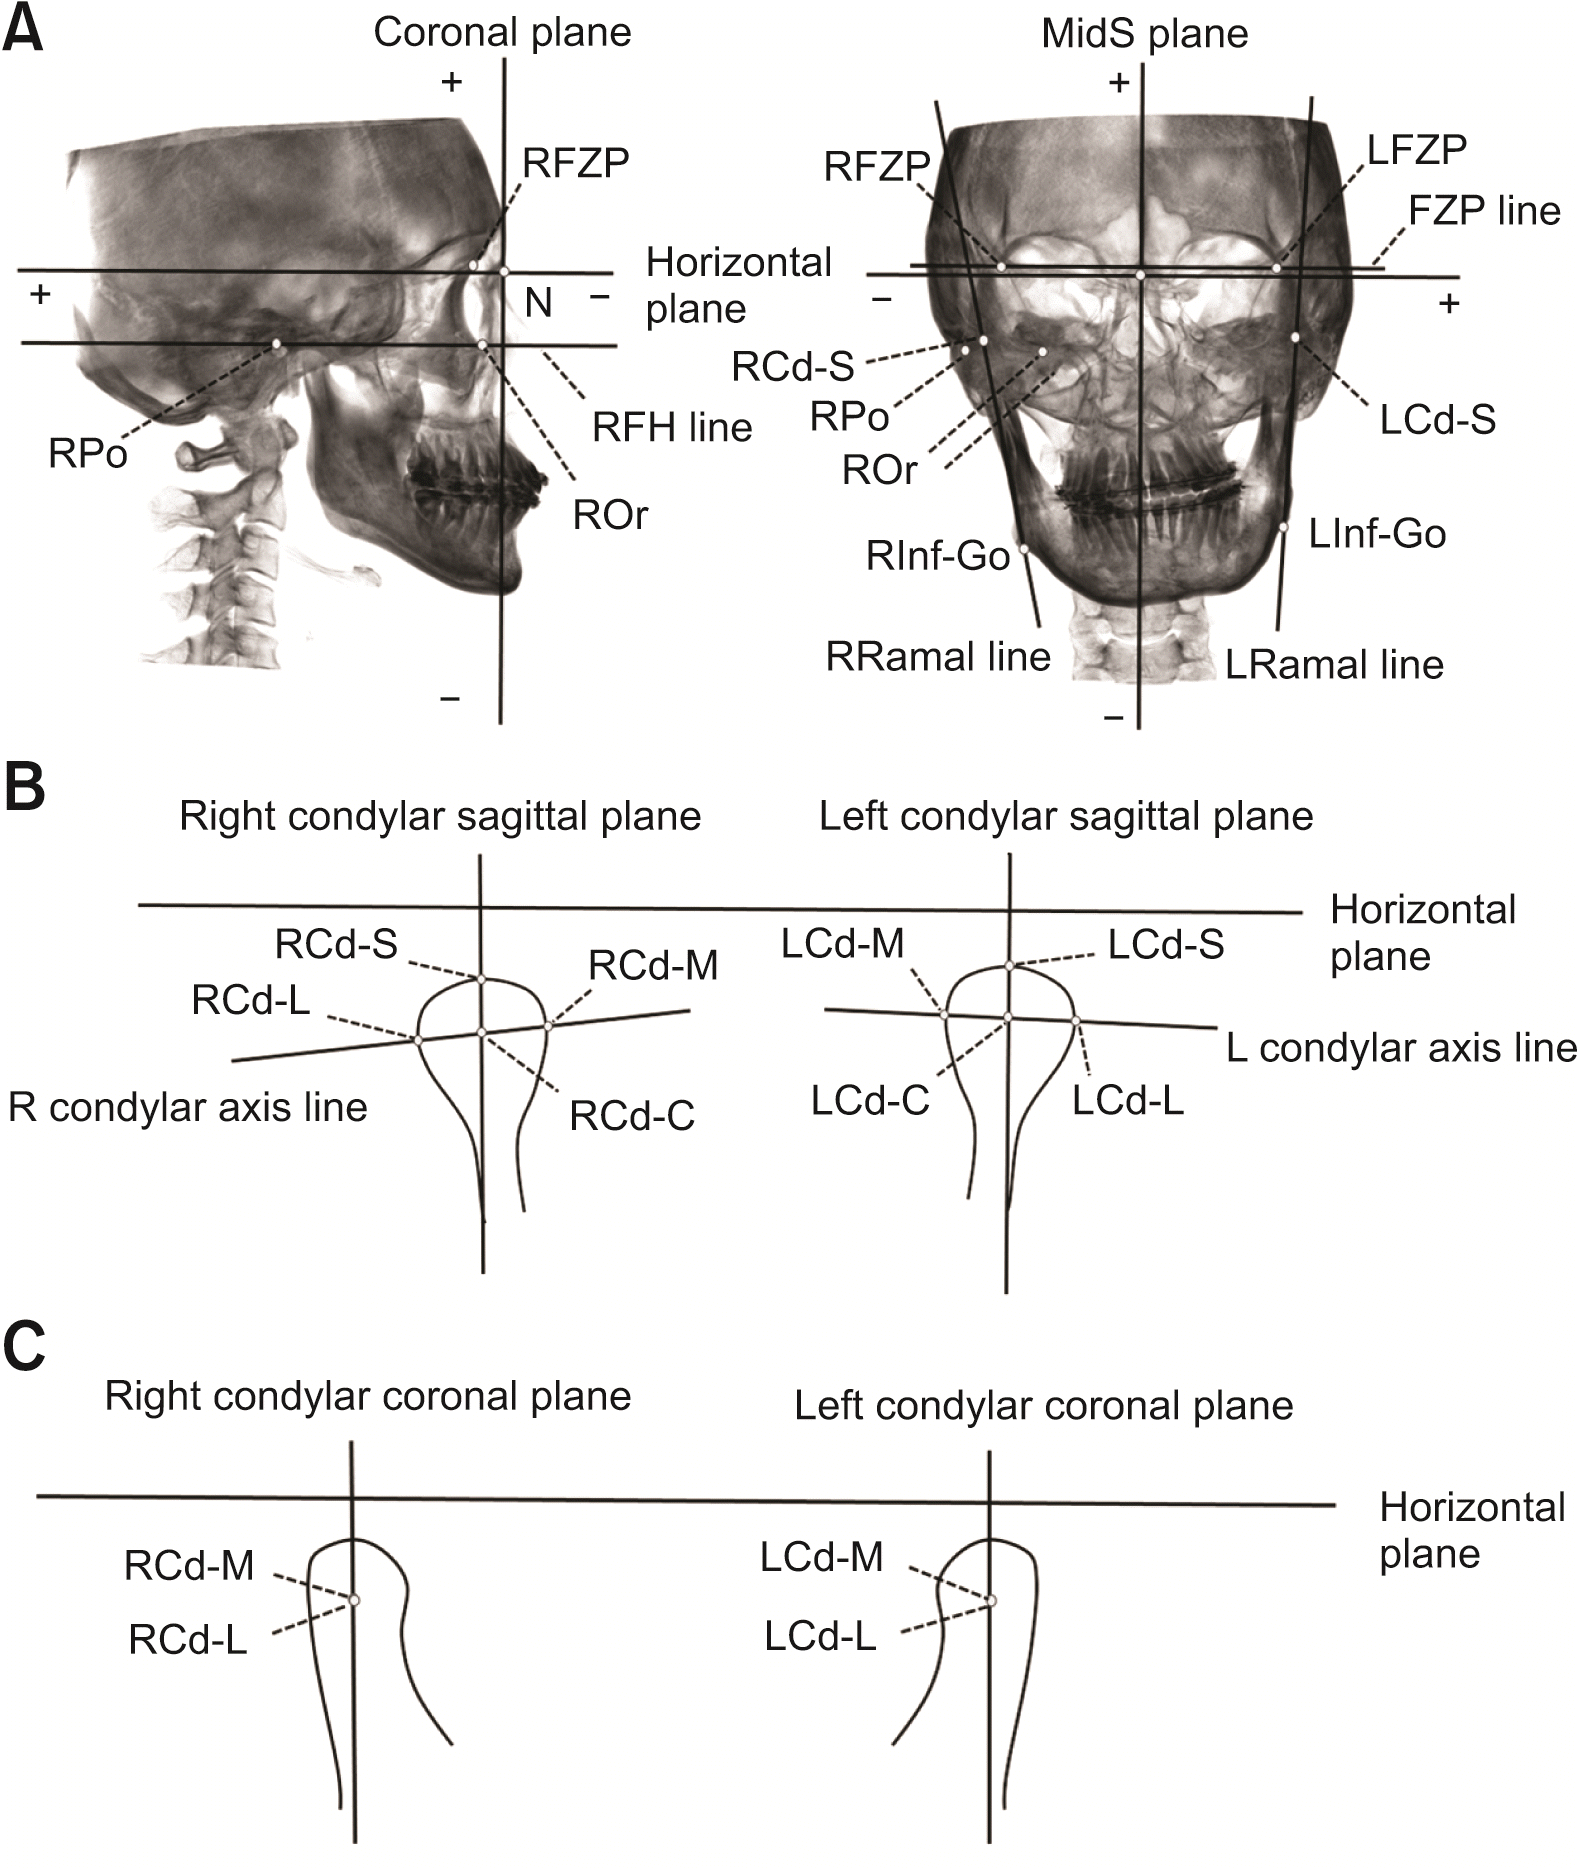 | Figure 2The planes and lines used in this study. A, Horizontal plane, coronal plane, mid-sagittal (MidS) plane, frontozygomatic point (FZP) line, right Frankfort horizontal (RFH) line, and ramal line (R and L). B, Condylar sagittal plane (R and L) and condylar axis line (R and L). C, Condylar coronal plane (R and L).
R, right; L, left.
See Figure 1 for definitions of the other landmarks.
|
Table 1
Adapted from the article of Hong et al. (Korean J Orthod 2020;50:293-303).17
![]()
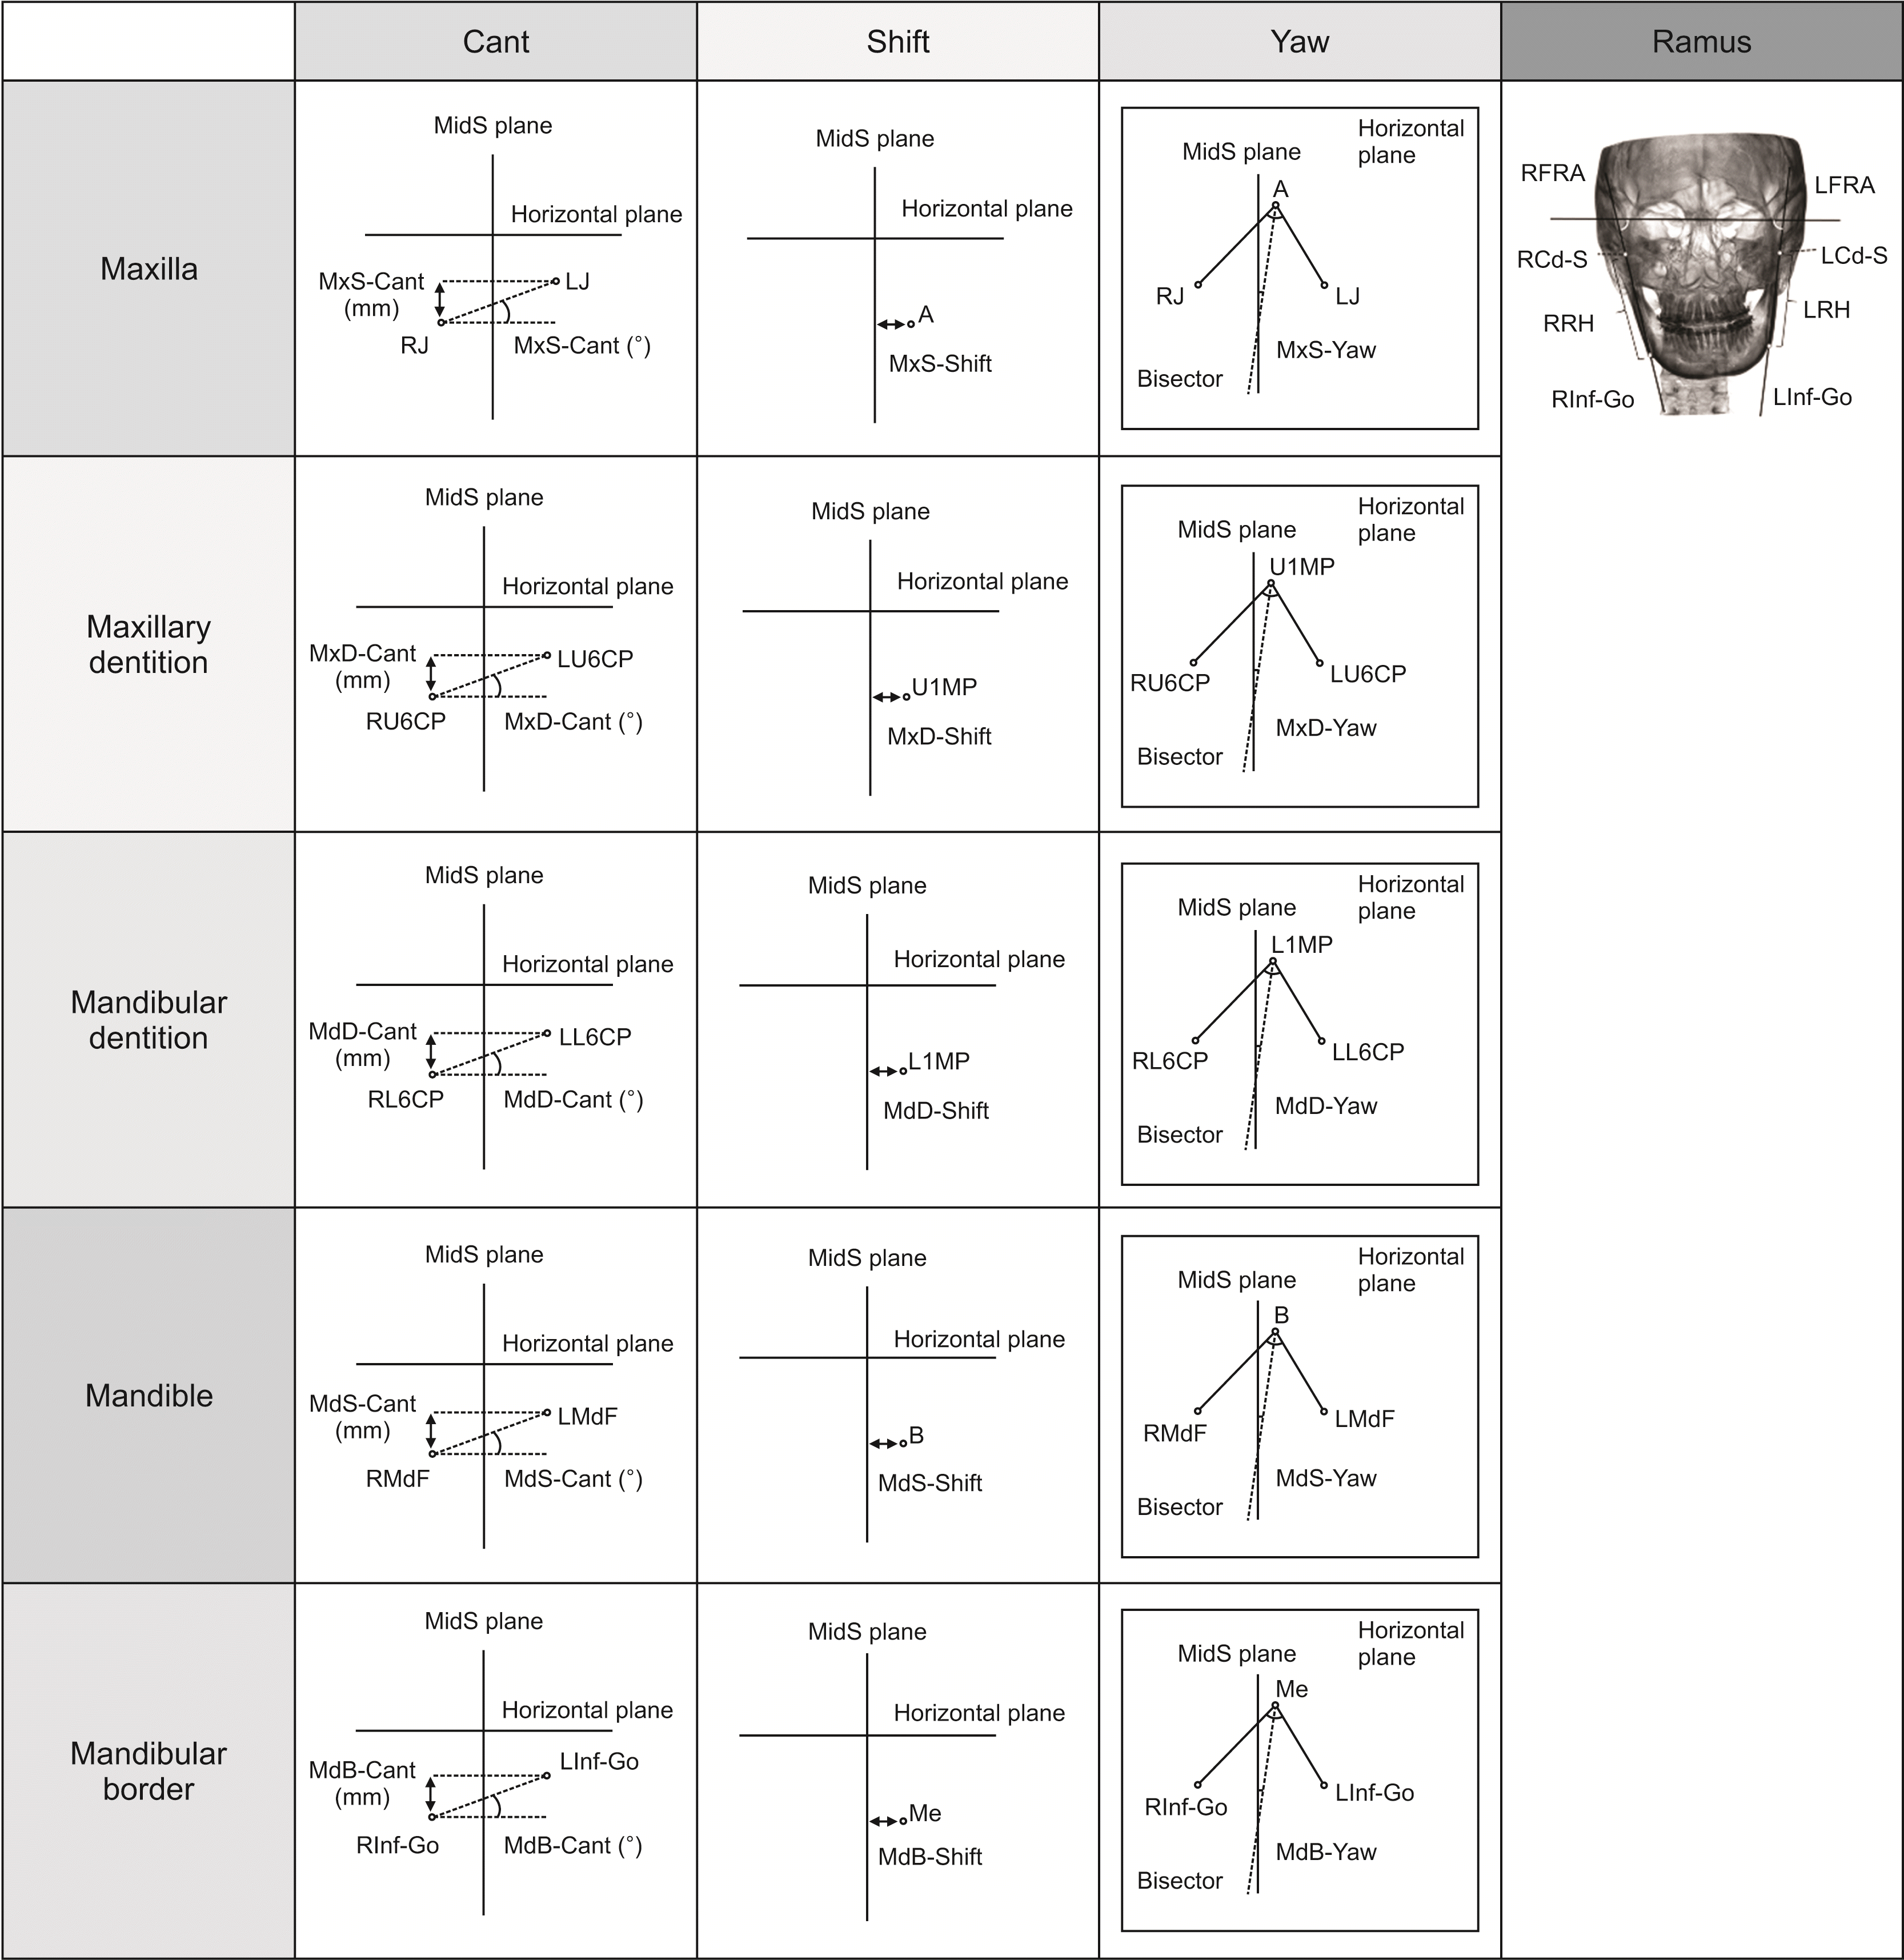 | Figure 3The variables used in this study. Maxillary skeletal (MxS)-Cant (°), MxS-Cant (mm), MxS-Shift (mm), MxS-Yaw (°), maxillary dental (MxD)-Cant (°), MxD-Cant (mm), MxD-Shift (mm), MxD-Yaw (°), mandibular dental (MdD)-Cant (°), MdD-Cant (mm), MdD-Shift (mm), MdD-Yaw (°), mandibular skeletal (MdS)-Cant (°), MdS-Cant (mm), MdS-Shift (mm), MdS-Yaw (°), mandibular border (MdB)-Cant (°), MdB-Cant (mm), MdB-Shift (mm), MdB-Yaw (°), frontal ramus angle (FRA, °) (R and L, difference), Ramus height (RH, mm) (R and L, difference).
MidS, mid-sagittal; R, right; L, left.
See Figure 1 for definitions of the other landmarks.
|
Table 2
See Table 1 for definitions of each landmark, line, and plane.
![]()
Table 3
The mean and standard deviation (SD) from the non-asymmetry group were used for deciding the severity of each variable.
See Table 2 for definitions of each measurement variable.
![]()
RESULTS
Morphological characteristics of five FA phenotypes (Table 4, Figure 4)
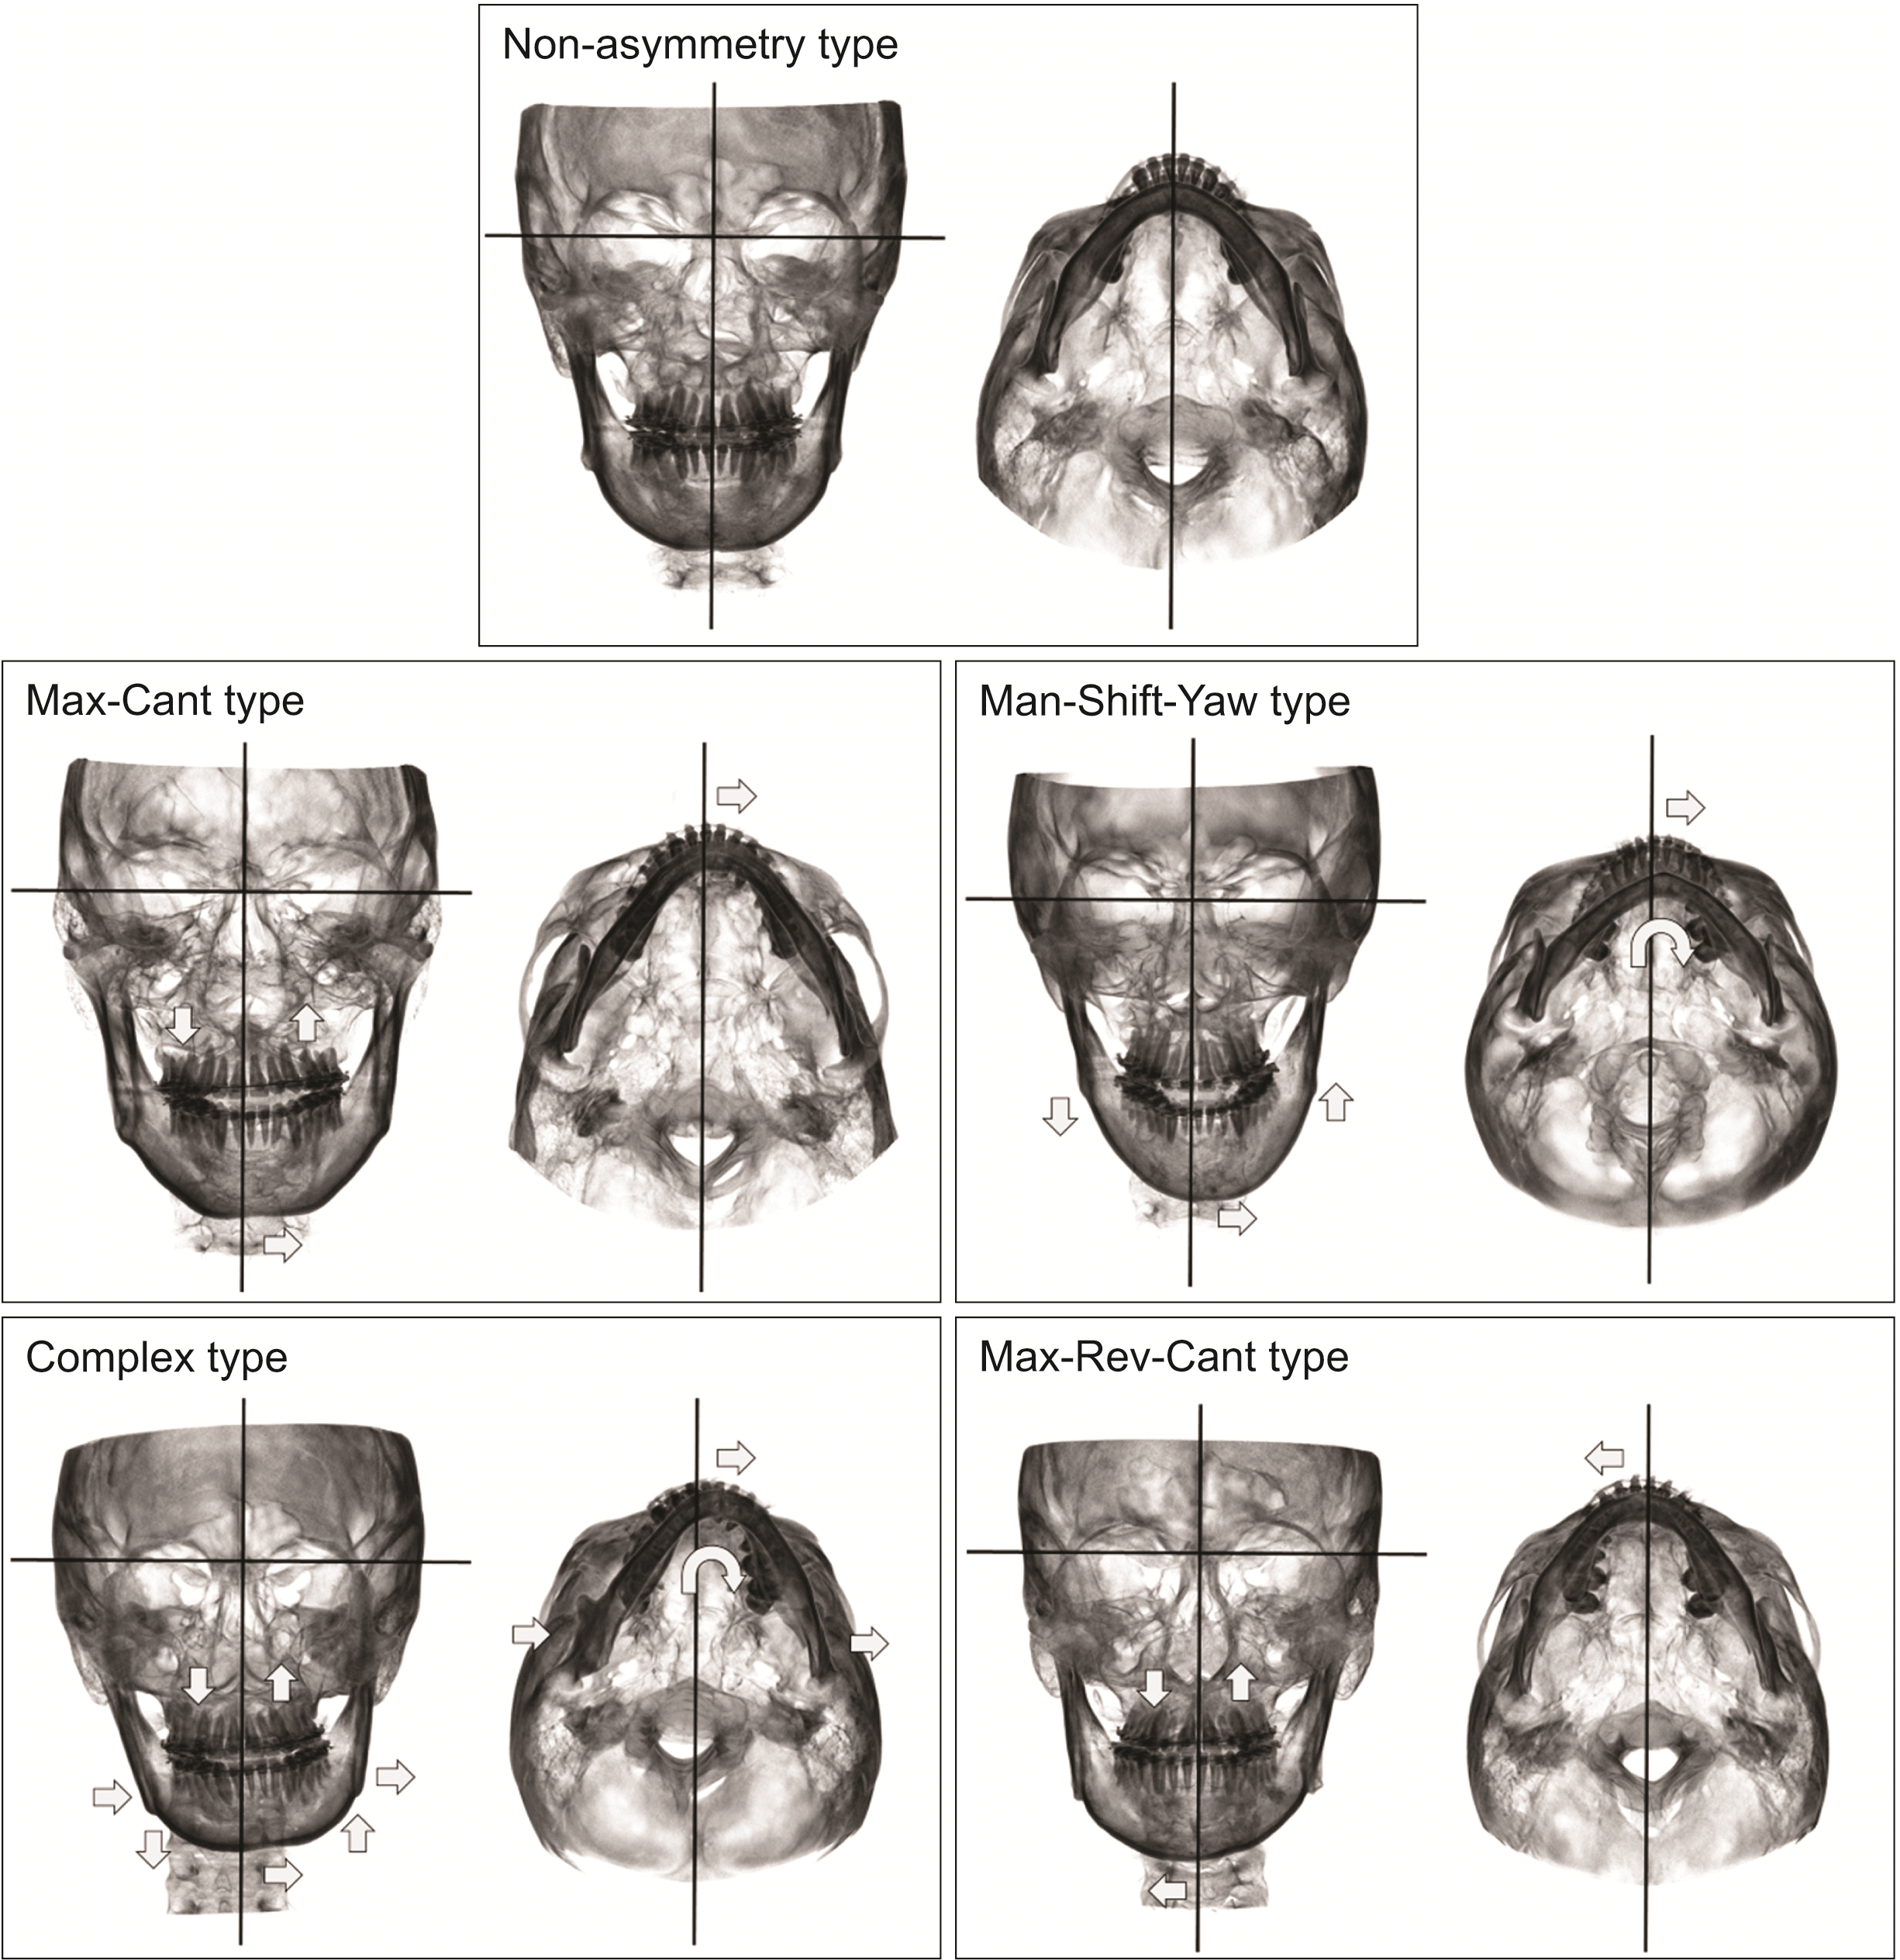 | Figure 4Examples of the non-asymmetry type and 4 facial asymmetry phenotypes. 1) Non-asymmetry type (35.8%); 2) maxillary-cant (Max-Cant) type (14.2%; severe cant of the maxillary dentition, mild shift of the mandibular border); 3) mandibular-shift and yaw (Man-Shift-Yaw) type (16.7%; moderate shift and yaw of the mandibular border, mild ramus height difference); 4) complex type (9.2%; severe cant of the maxillary dentition, moderate cant, severe shift, and severe yaw of the mandibular border, moderate differences in frontal ramus angle and ramus height); and 5) maxillary reverse-cant (Max-Rev-Cant) type (24.2%; reverse-cant of the maxillary dentition).
|
Table 4
| Parameter |
Non-asymmetry type (n = 43, 35.8%, 1) |
Max-Cant type (n = 17, 14.2%, 2) |
Man-Shift-Yaw type (n = 20, 16.7%, 3) |
Complex type (n = 11, 9.2%, 4) |
Max-Rev-Cant type (n = 29, 24.2%, 5) | p-value | Multiple comparison | |||||||||||
|---|---|---|---|---|---|---|---|---|---|---|---|---|---|---|---|---|---|---|
| Mean | SD | Mean | SD | Mean | SD | Mean | SD | Mean | SD | |||||||||
| Cant | Angulation | MxS-Cant (°) | 0.41 | 1.24 | 1.15 | 1.11 | 1.04 | 2.24 | 2.05† | 1.54 | −0.80 | 1.17 | < 0.001*** | 5 < (1, 3, 2) < (3, 2, 4) | ||||
| MxD-Cant (°) | 0.83 | 0.50 | 2.87c | 0.96 | 1.03 | 0.85 | 3.40c | 1.67 | −0.87c | 0.61 | < 0.001*** | 5 < (1, 3) < (2, 4) | ||||||
| MdD-Cant (°) | 0.80 | 0.96 | 2.35† | 1.05 | 2.15† | 1.56 | 5.44c | 1.46 | 0.01 | 1.13 | < 0.001*** | (5, 1) < (3, 2) < 4 | ||||||
| MdS-Cant (°) | 0.61 | 1.11 | 1.05 | 0.91 | 1.30 | 1.58 | 3.81b | 1.46 | −0.30 | 1.74 | < 0.001*** | (5, 1) < (1, 2, 3) < 4 | ||||||
| MdB-Cant (°) | 0.52 | 1.48 | 1.17 | 0.98 | 1.36 | 1.60 | 3.94b | 1.80 | 0.17 | 1.73 | < 0.001*** | (5, 1, 2, 3) < 4 | ||||||
| p-value | 0.363 | < 0.001*** | 0.207 | < 0.001*** | < 0.011* | |||||||||||||
|
Multiple comparison |
(MdS, MxS, MdB) < (MdD, MxD) | (MxS, MxD, MdS, MdB) < (MdS, MdB, MdD) | (MxD, MxS, MdS, MdD) < (MxS, MdS, MdD, MdB) | |||||||||||||||
| Distance | MxS-Cant (mm) | 0.45 | 1.32 | 1.26 | 1.22 | 1.07 | 2.22 | 2.13† | 1.51 | −0.84 | 1.22 | < 0.001*** | 5 < (1, 3, 2) < (3, 2, 4) | |||||
| MxD-Cant (mm) | 0.75 | 0.45 | 2.69§ | 0.91 | 0.94 | 0.79 | 3.20§ | 1.56 | −0.81§ | 0.58 | < 0.001*** | 5 < (1, 3) < (2, 4) | ||||||
| MdD-Cant (mm) | 0.67 | 0.79 | 2.01† | 0.89 | 1.82† | 1.34 | 4.65§ | 1.35 | 0.02 | 0.93 | < 0.001*** | (5, 1) < (3, 2) < 4 | ||||||
| MdS-Cant (mm) | 0.90 | 1.64 | 1.63 | 1.39 | 2.00 | 2.36 | 5.74‡ | 2.12 | −0.42 | 2.54 | < 0.001*** | (5, 1) < (1, 2, 3) < 4 | ||||||
| MdB-Cant (mm) | 0.85 | 2.40 | 1.92 | 1.67 | 2.17 | 2.57 | 6.39‡ | 2.95 | 0.27 | 2.83 | < 0.001*** | (5, 1, 2, 3) < 4 | ||||||
| p-value | 0.664 | < 0.028* | 0.204 | < 0.001*** | < 0.096 | |||||||||||||
|
Multiple comparison |
(MxS, MdS, MdB, MdD) < (MdS, MdB, MdD, MxD) | (MxS, MxD) < (MxD, MdD) < (MdD, MdS, MdB) | ||||||||||||||||
| Shift | MxS-Shift (mm) | 0.26 | 1.13 | −0.23 | 1.86 | 0.69 | 1.30 | 0.88 | 1.17 | 0.48 | 0.79 | 0.122 | ||||||
| MxD-Shift (mm) | 0.45 | 1.51 | 0.91 | 2.10 | 1.37 | 1.28 | 1.92 | 1.52 | 0.49 | 1.45 | 0.029* | |||||||
| MdD-Shift (mm) | 1.54 | 1.52 | 2.53 | 2.17 | 4.68‡ | 1.58 | 8.65§ | 1.74 | 1.83 | 1.68 | < 0.001*** | (1, 5, 2) < 3 < 4 | ||||||
| MdS-Shift (mm) | 1.58 | 1.55 | 3.14† | 2.13 | 5.39‡ | 1.47 | 10.25§ | 2.11 | 1.82 | 1.49 | < 0.001*** | (1, 5) < (5, 2) < 3 < 4 | ||||||
| MdB-Shift (mm) | 2.20 | 1.47 | 4.05† | 2.07 | 6.51‡ | 1.58 | 13.73§ | 2.79 | 2.19 | 1.49 | < 0.001*** | (5, 1) < 2 < 3 < 4 | ||||||
| p-value | < 0.001*** | < 0.001*** | < 0.001*** | < 0.001*** | < 0.001*** | |||||||||||||
|
Multiple comparison |
(MxS, MxD) < (MdD, MdS, MdB) |
(MxS, MxD) < (MxD, MdD) < (MdD, MdS, MdB) |
(MxS, MxD) < (MdD, MdS) < (MdS, MdB) |
(MxS, MxD) < (MdD, MdS) < MdB |
(MxD, MxS, MdS, MdD) < (MxS, MdS, MdD, MdB) | |||||||||||||
| Yaw | MxS-Yaw (°) | −0.14 | 1.57 | −0.03 | 1.81 | 0.64 | 1.49 | 1.19 | 1.37 | −0.24 | 1.35 | 0.042* | ||||||
| MxD-Yaw (°) | −0.55 | 1.87 | −0.12 | 1.60 | 0.18 | 2.00 | −0.14 | 1.20 | −0.32 | 1.92 | 0.677 | |||||||
| MdD-Yaw (°) | 0.41 | 1.93 | 1.42 | 1.74 | 3.72† | 1.63 | 6.97§ | 2.29 | 1.03 | 1.85 | < 0.001*** | (1, 5, 2) < 3 < 4 | ||||||
| MdS-Yaw (°) | 0.36 | 1.51 | 1.62 | 1.47 | 4.05‡ | 1.40 | 7.13§ | 2.29 | 1.08 | 1.09 | < 0.001*** | (1, 5) < (5, 2) < 3 < 4 | ||||||
| MdB-Yaw (°) | 0.53 | 1.43 | 1.73 | 1.29 | 4.52‡ | 1.42 | 8.54§ | 2.37 | 1.36 | 1.32 | < 0.001*** | (5, 1, 2) < 3 < 4 | ||||||
| p-value | 0.017* | < 0.001*** | < 0.001*** | < 0.001*** | < 0.001*** | |||||||||||||
|
Multiple comparison |
(MxD, MxS, MdS, MdD) < (MxS, MdS, MdD, MdB) |
(MxD, MxS, MdD) < (MdD, MdS, MdB) |
(MxD, MxS) < (MdD, MdS, MdB) |
(MxD, MxS) < (MdD, MdS, MdB) |
(MxD, MxS) < (MdD, MdS, MdB) |
|||||||||||||
| Ramus |
FRA-difference (°) |
1.66 | 2.44 | 2.25 | 2.54 | 2.74 | 2.01 | 7.33‡ | 2.54 | 1.35 | 2.27 | < 0.001*** | (5, 1, 2, 3) < 4 | |||||
|
RH-difference (mm) |
0.65 | 2.63 | 2.08 | 2.26 | 3.42† | 2.46 | 8.41‡ | 3.06 | 0.24 | 2.87 | < 0.001*** | (5, 1, 2) < (2, 3) < 4 | ||||||
The K-mean cluster analysis was conducted using three representative variables, which provide significant clinical information: MxD-Cant (mm), MdB-Shift (mm), and MdB-Yaw (°).
The one-way analysis of variance test with Tukey’s honestly significant difference post hoc comparison was conducted.
See Table 2 for definitions of each measurement variable.
![]()
Comparison of cant, yaw, and shift among the FA phenotypes (Table 4, Figure 4)
DISCUSSION
Classification of the FA phenotypes (Tables 4 and 5, Figure 5)
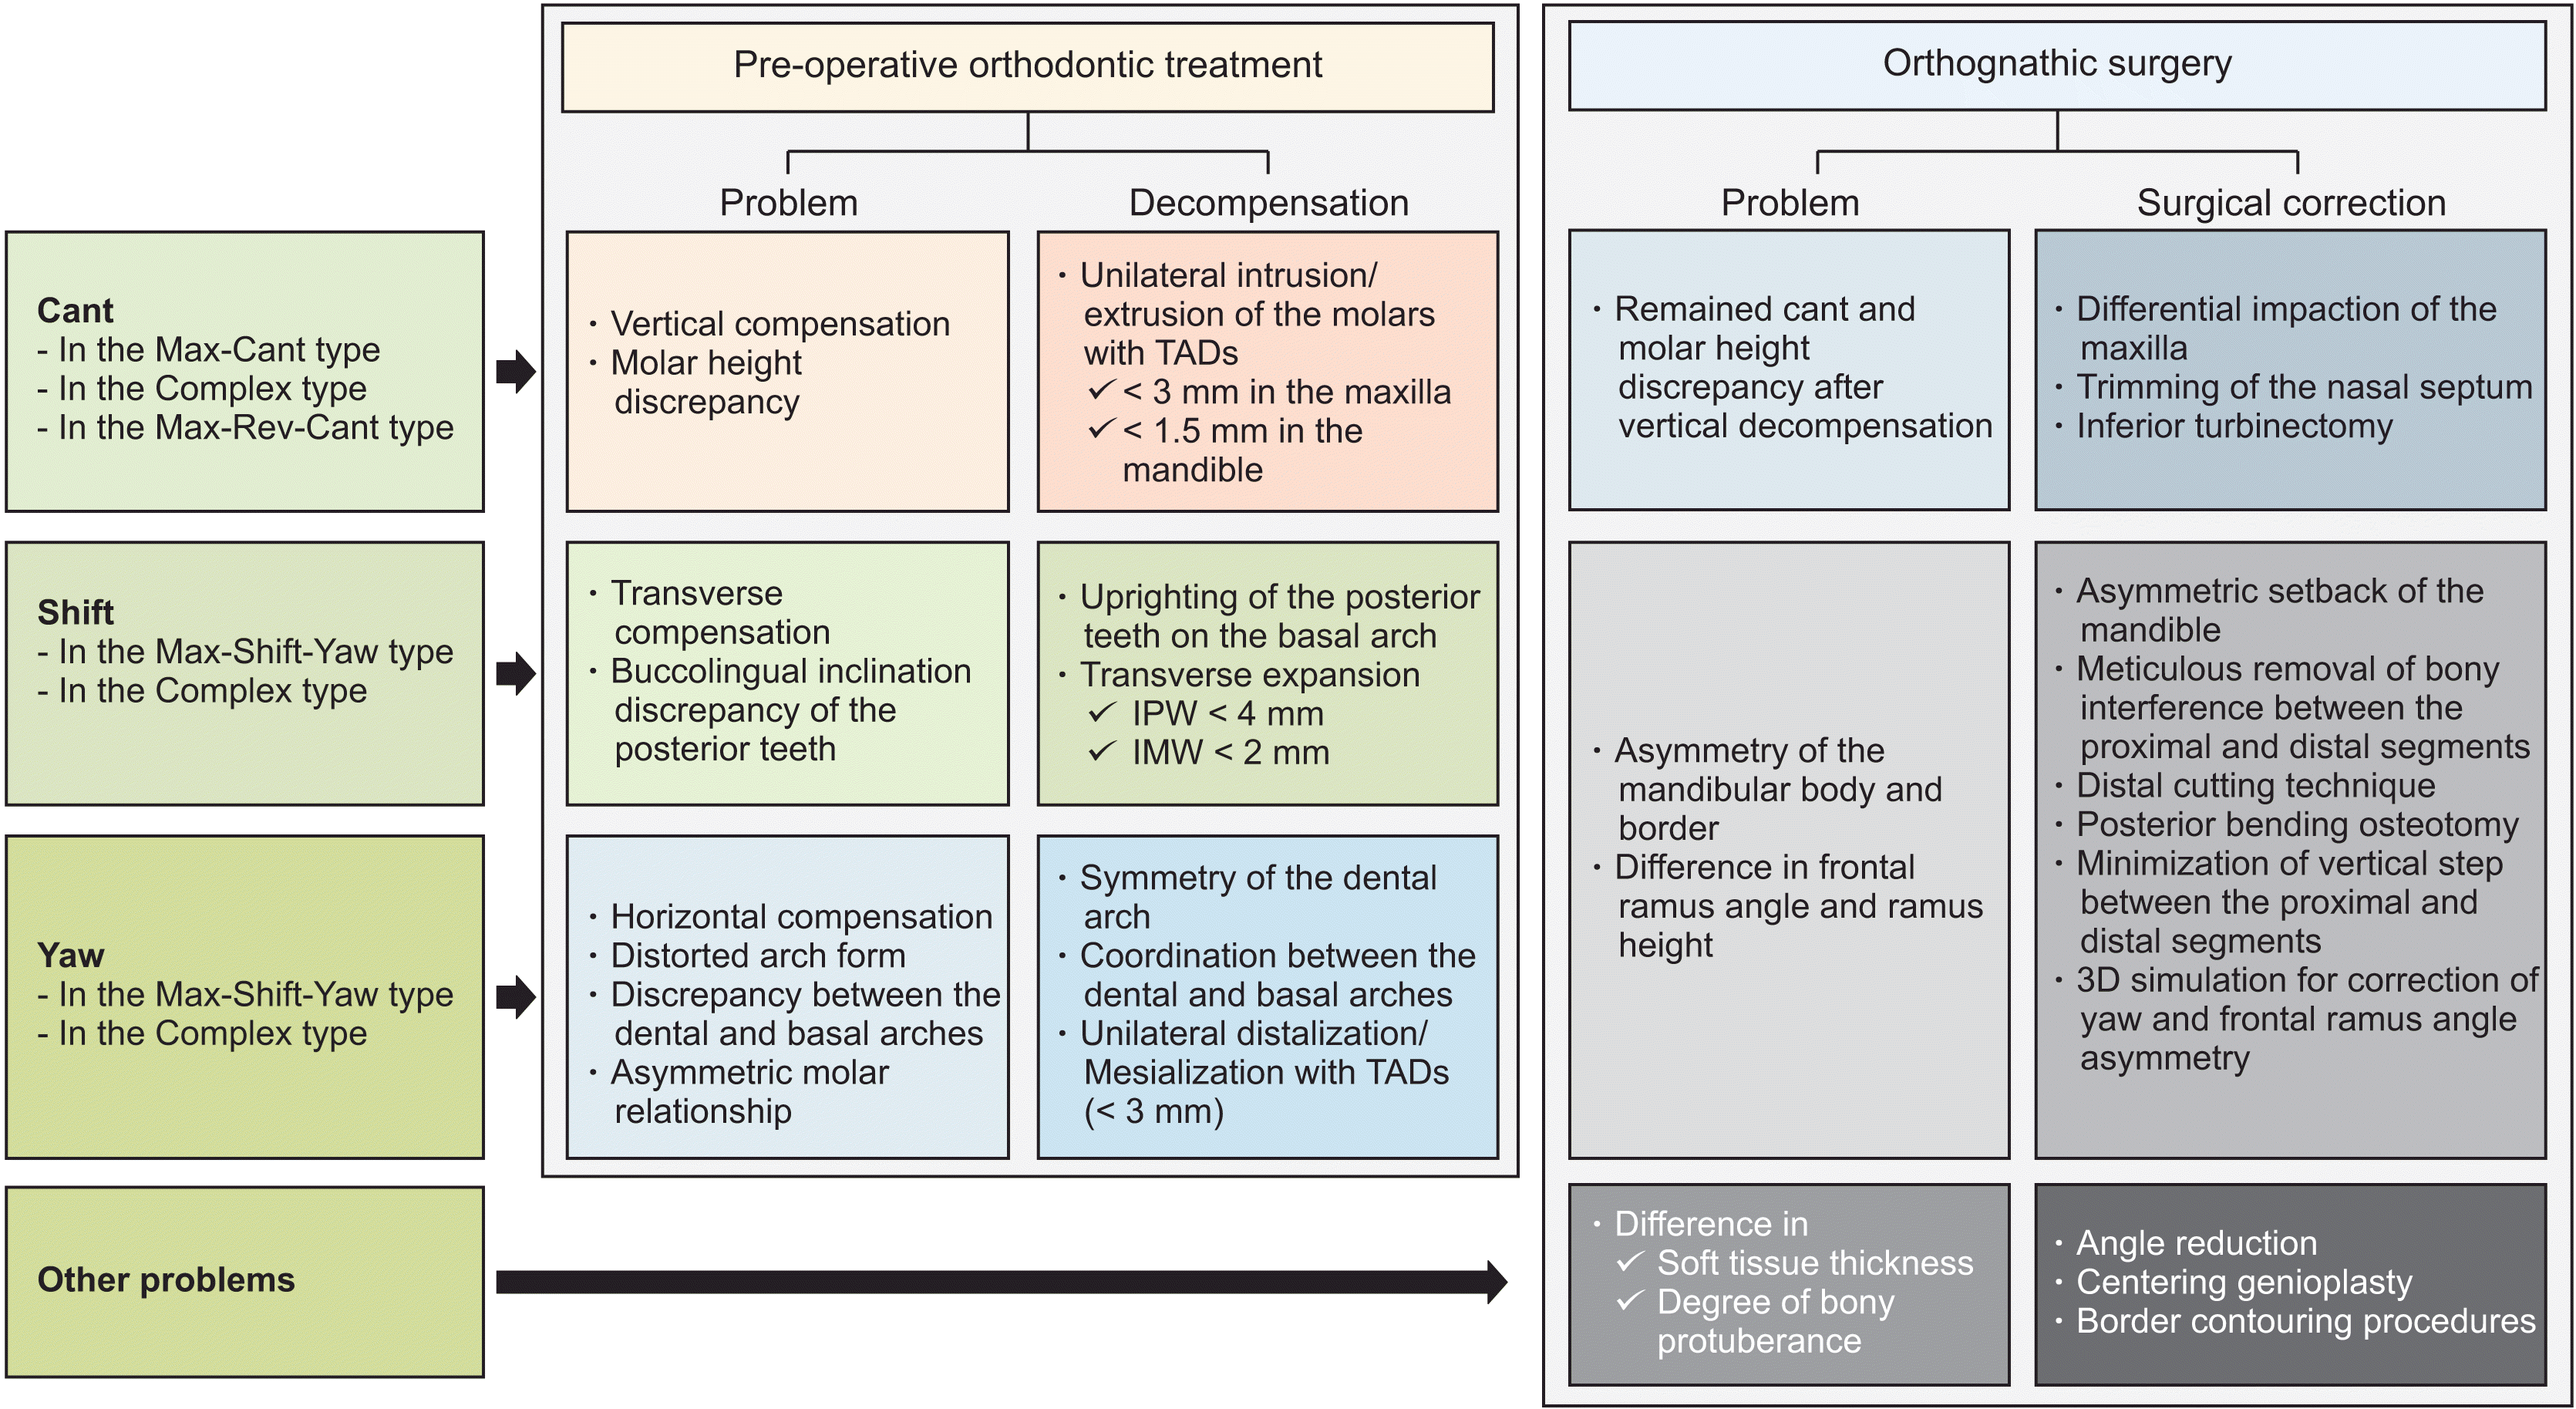 | Figure 6Strategic decompensation and surgical planning according to the facial asymmetry phenotypes.
Max-Cant, maxillary-cant; Man-Shift-Yaw, mandibular-shift and yaw; Max-Rev-Cant, maxillary reverse-cant; TAD, temporary anchorage device; IPW, inter-premolar width; IMW, inter-molar width; 3D, three-dimensional.
|
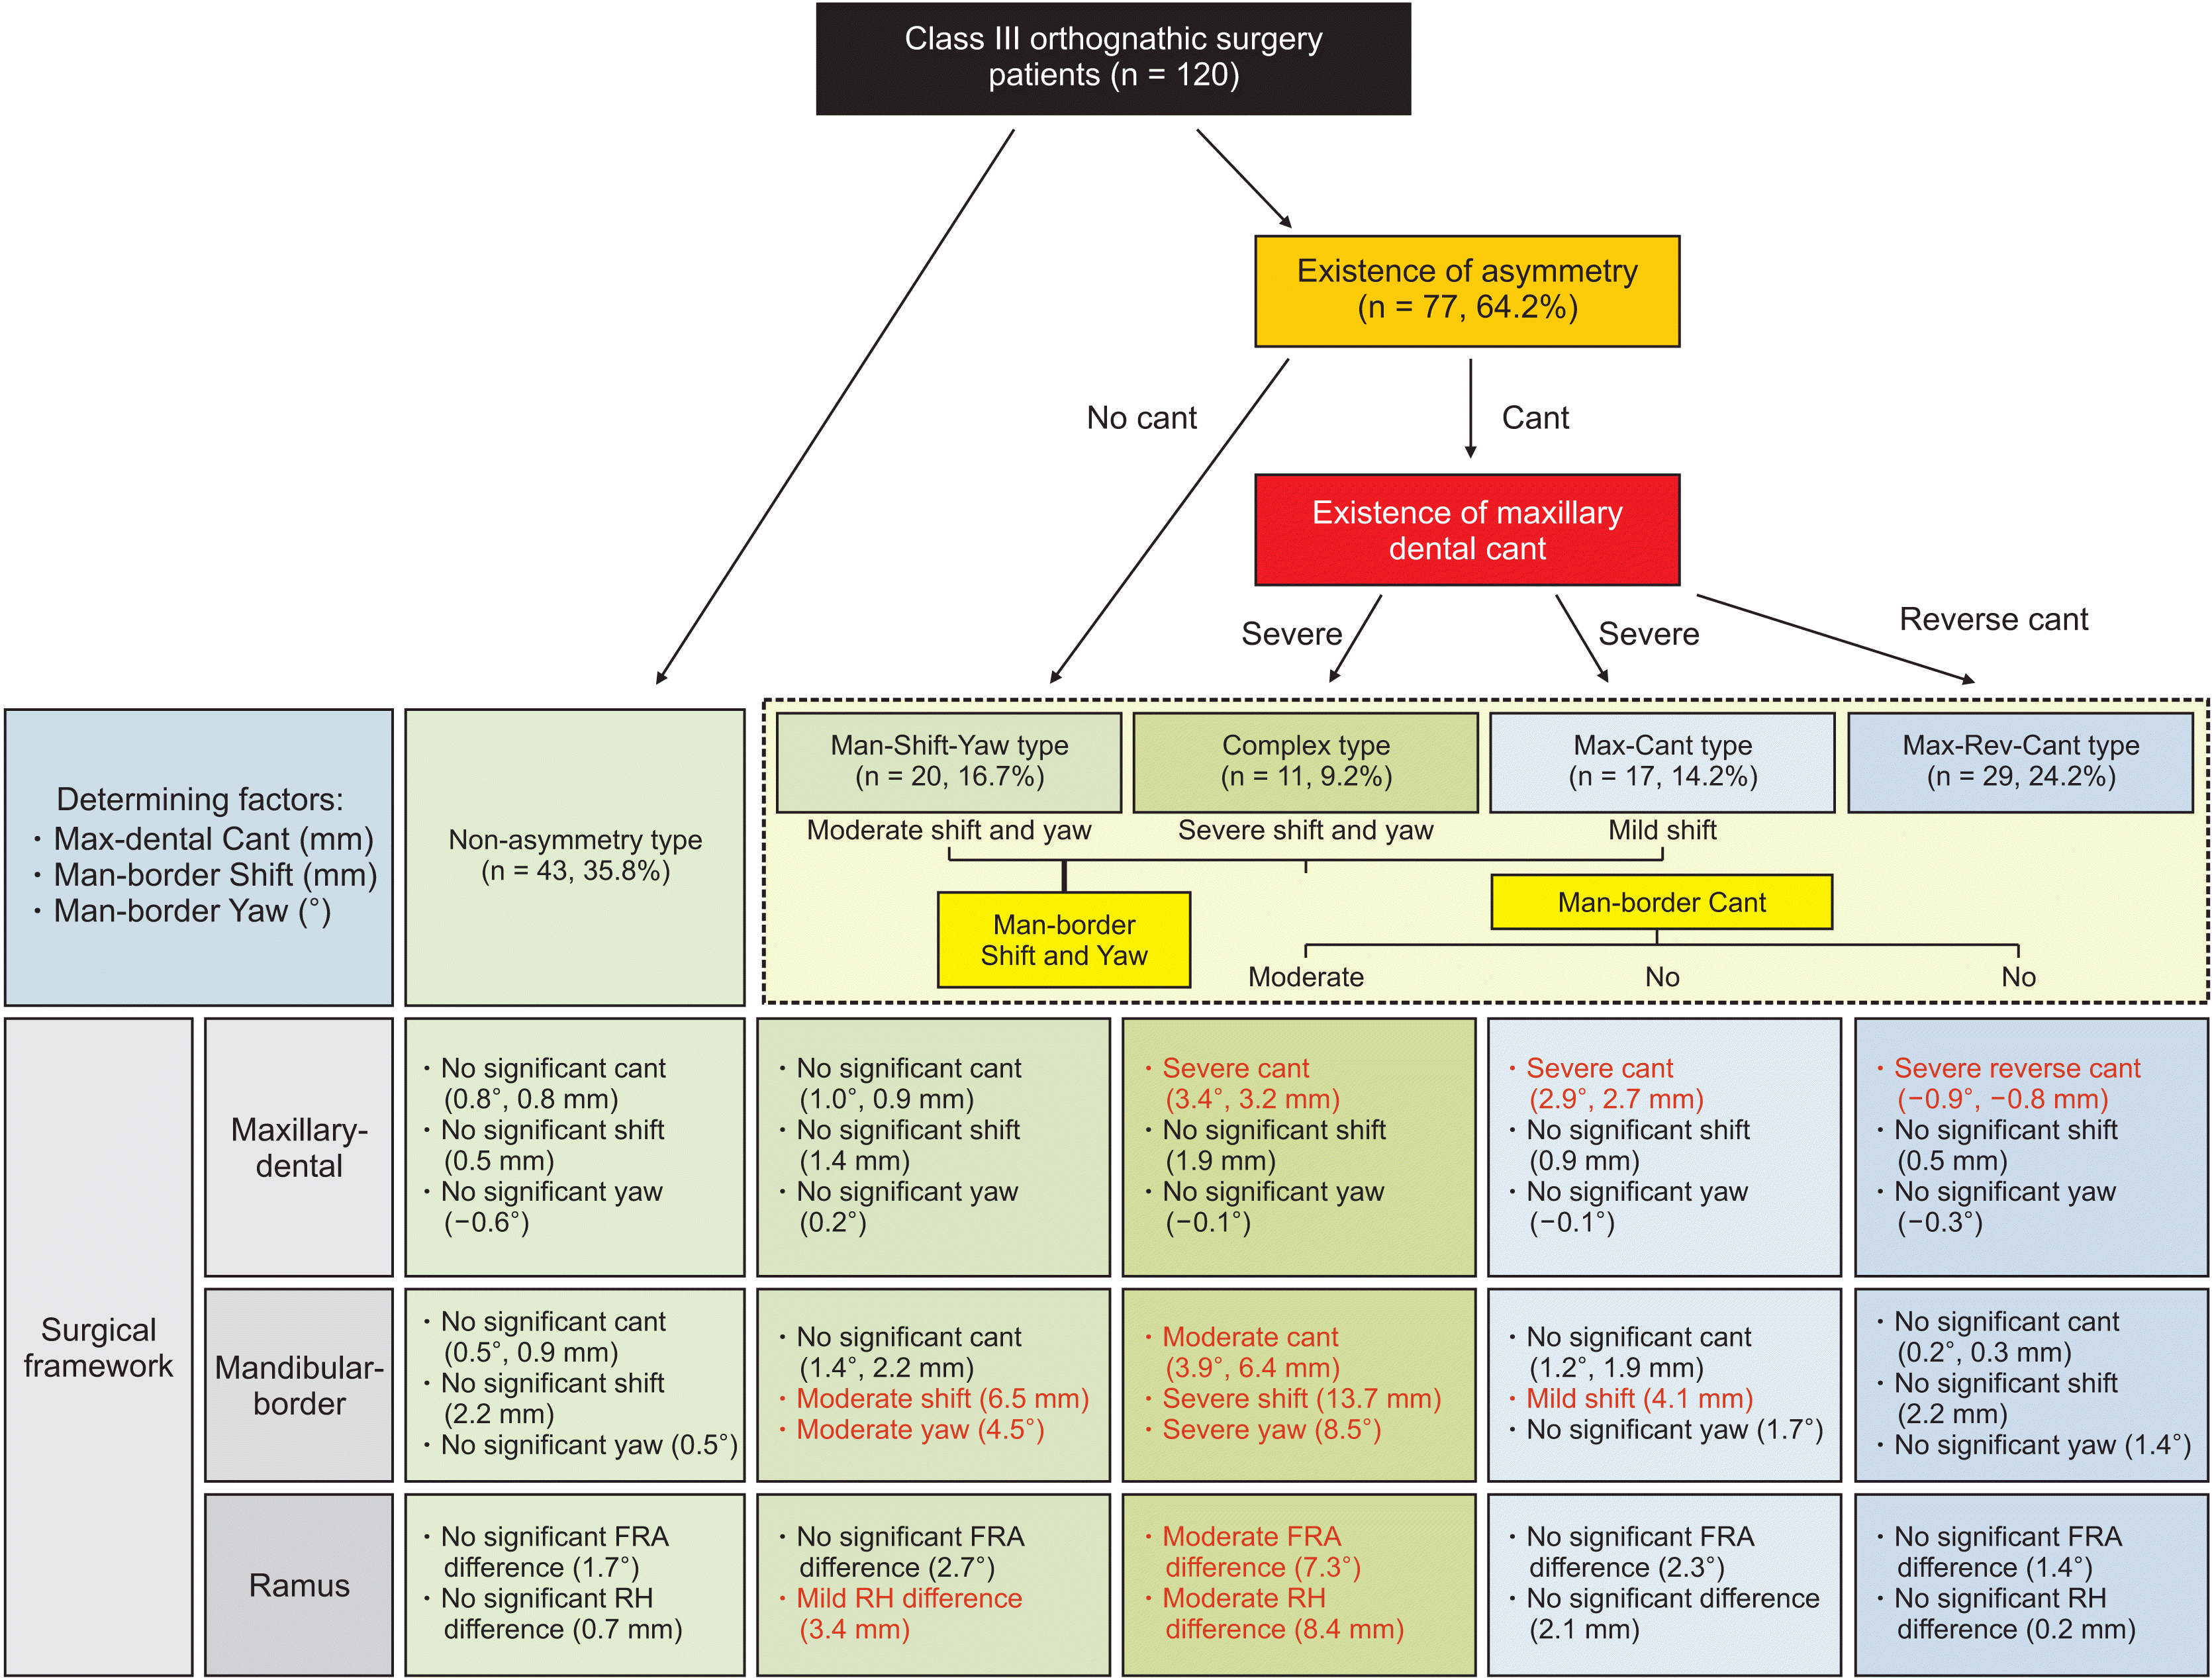 | Figure 5Flow chart that explains the characteristics of the facial asymmetry phenotypes in skeletal Class III patients who underwent orthognathic surgery.
Max-Cant, maxillary-cant; Man-Shift-Yaw, mandibular-shift and yaw; Max-Rev-Cant, maxillary reverse-cant; FRA, frontal ramus angle; RH, ramus height.
|
Table 5
| Phenotype | This study |
Hwang et al.9 Hwang et al.18 |
Baek et al.10 | Chen et al.15 |
|---|---|---|---|---|
| Samples | ||||
| Ethnicity | Korean | Korean | Korean | Taiwanese |
| Subjects | Patients who underwent orthognathic surgery | Patients who were diagnosed with facial asymmetry | Patients who wanted correction of facial asymmetry | Patients who wanted correction of facial asymmetry |
| Number | 120 | 100 | 43 | 70 |
| Study design | ||||
| Angle classification | Skeletal Class III | Skeletal Class I, II, and III | Skeletal Class I, II, and III | Skeletal Class III |
| Exclusion criteria | ||||
| Reference planes | Horizontal plane | Frankfort horizontal plane | Frankfort horizontal plane | Mid-sagittal plane |
| Coronal plane | Mid-sagittal reference line | Coronal plane | Horizontal plane | |
| Mid-sagittal plane | Mid-sagittal plane | Coronal plane | ||
| Origin (0, 0, 0) | N point | None | Not mentioned | Not mentioned |
| Variables for | Max-dental Cant (mm) | Menton deviation (°) | Upper midline deviation (mm) | The direction and magnitude oftransverse ramus discrepancy relative to menton deviation |
| classification | Man-border Shift (mm) | Apical base midline discrepancy (mm) | Maxilla canting of U3 and U6 (mm) | |
| Man-border Yaw (°) | Vertical difference of the right and left Ag (mm) | Arch form discrepancy (mm) | ||
| Horizontal difference of the right and left Ag (mm) | Gonion to the mid-sagittal plane (mm) | |||
| Maxillary base canting (°) | Ramus height (mm) | |||
| Maxillary alveolar canting (°) | Frontal ramus inclination (°) | |||
| Bulkiness difference of the mandibular inferior border | Menton deviation (mm) | |||
| Lip line canting (°) | ||||
| Inclusion of yaw | Yes | No | No | No |
| Analyzed data | 3D-CT | PA cephalogram and frontal photograph | 3D-CT | CBCT |
| Statistical method | Cluster analysis | Cluster analysis | Cluster analysis | No cluster |
| Types | Non-asymmetry type (35.8%) | Group E (Normal, 28%) | Not mentioned | Not mentioned |
| Max-Cant type (14.2%) | Not mentioned | Group 2 (Universal lateral condylar hyperplasia asymmetry, 39%) | Not mentioned | |
| Man-Shift-Yaw type (16.7%) | Group C (Menton type, 21%) | Group 1 (Mandibular body asymmetry, 44%) | Group 2 (27%) | |
| Complex type (9.2%) | Group A (Ramus–Menton type, 7%) | Group 4 (C-shaped asymmetry, 5%) | Group 1 (47%) | |
| Max-Rev-Cant type (24.2%) | Group B (Ramus–Angle type, 16%) | Group 3 (Atypical asymmetry, 12%) | Group 3 (26%) | |
| Not matched | Group D (Bulkiness type, 28%) | |||
Max-Cant, maxillary-cant; Man-Shift-Yaw, mandibular-shift and yaw; Max-Rev-Cant, maxillary reverse-cant; Ag, antegonion; U3, distance between Frankfort horizontal plane and midpoint of bracket slot of upper canine; U6, distance between Frankfort horizontal plane and midpoint of bracket slot of upper first molar; 3D-CT, three-dimensional computed tomography; PA, posteroanterior; CBCT, cone beam computed tomography.
![]()
 XML Download