Journal List > Ann Hepatobiliary Pancreat Surg > v.26(1) > 1160409

Kulkarni, Kabir, Hodson, Raza, Shah, Pandanaboyana, and Dasari: Impact of the extent of resection of neuroendocrine tumor liver metastases on survival: A systematic review and meta-analysis

Abstract

In patients with neuroendocrine tumors with liver metastases (NETLMs), complete resection of both the primary and liver metastases is a potentially curative option. When complete resection is not possible, debulking of the tumour burden has been proposed to prolong survival. The objective of this systematic review was to evaluate the effect of curative surgery (R0-R1) and debulking surgery (R2) on overall survival (OS) in NETLMs. For the subgroup of R2 resections, outcomes were compared by the degree of hepatic debulking (≥ 90% or ≥ 70%). A systematic review of the literature was conducted according to the Preferred Reporting Items for Systematic Reviews and Meta-analysis (PRISMA) guidelines using PubMed, Medline, CINAHL, Cochrane, and Embase databases. Hazard ratios (HRs) were estimated for each study and pooled using a random-effects inverse-variance meta-analysis model. Of 538 articles retrieved, 11 studies (1,729 patients) reported comparisons between curative and debulking surgeries. After pooling these studies, OS was found to be significantly shorter in debulking resections, with an HR of 3.49 (95% confidence interval, 2.70–4.51; p < 0.001). Five studies (654 patients) compared outcomes between ≥ 90% and ≥ 70% hepatic debulking approaches. Whilst these studies reported a tendency for OS and progression-free survival to be shorter in those with a lower degree of debulking, they did not report sufficient data for this to be assessed in a formal meta-analysis. In patients with NETLM, OS following surgical resection is the best to achieve R0-R1 resection. There is also evidence for a progressive reduction in survival benefit with lesser debulking of tumour load.

INTRODUCTION

Neuroendocrine tumors (NETs) are slow growing, indolent neoplasms that often have delayed presentation [1]. Distant metastases are common in NETs, developing in 30%–70% patients at the time of presentation, with the liver being the most common site of metastases, accounting for 60%–90% of cases [2]. Presence of neuroendocrine tumors with liver metastases (NETLMs) is an important prognostic indicator of survival regardless of the site of origin. It often results in significant constitutional symptoms [3-5]. The five-year survival of untreated NETLMs is around 30%–40% [5,6]. NETLMs are not infiltrative, but are expansive, pushing the surrounding liver parenchyma. For this reason, survival outcomes after R0 and R1 resections have been shown to be similar to each other. Hence, both R0 and R1 resections are generally considered to be of curative intent [7]. Although curative resection (R0-R1) is ideal, it is only possible in 5%–15% patients as most patients have numerous bilobar metastases that are not amenable to complete resection [8,9]. Several studies have assessed the impact of debulking resections (R2) in patients from whom curative resection is not possible, with some studies also comparing between degrees of debulking defined by the percentage of the tumor that can be resected [9-16]. However, these studies were often based on small sample sizes with inconsistent findings. As such, this systematic review was conducted to evaluate the effect of curative intent surgery (R0-R1) and debulking surgery (R2) on overall survival (OS) in NETLM. This review further examined effects of two hepatic debulking thresholds (≥ 90% and ≥ 70%) in NETLM patients with tumors not amenable to curative resection.

MATERIALS AND METHODS

Search terms

A systematic review of Embase, CINAHL, Medline, Cochrane, and PubMed was undertaken using search a strategy based on a combination of Medical Subject Headings (MeSH) and free-text (neuroendocrine tumor, pancreatic NET, carcinoid, small bowel NET, rectal NET, liver metastasis, neuroendocrine liver metastasis, debulking surgery, cytoreductive surgery, R0, R1, R2 resection, survival) to find studies published before December 2020.

Inclusion criteria

• Participants: Adults (over 18 years) who underwent surgery for resection of NETLM.
• Comparisons: R0-R1 resection vs. debulking surgery (R2 resection) or a comparison between debulking strategies (≥ 90% and ≥ 70%).

Definitions

• R0 resection: resection with microscopically negative margins.
• R1 resection: resection with microscopically positive margin without any gross residual disease. R0/R1 resections together were considered as resections of curative intent.
• R2 resection: presence of gross residual disease (hepatic or extrahepatic disease) after resection ± ablative therapy.
• Extent of hepatic debulking surgery for NETLM: the extent of debulking was calculated by the surgeon based on imaging studies (pre- and postoperative), intraoperative ultrasonographic assessment, and pathology reports. Patients were classified based on the percentage of gross hepatic disease resected, with common thresholds being ≥ 90% and ≥ 70%.

Outcomes evaluated

The primary outcome measure was OS. Secondary outcome measures were other measures of survival and recurrence, including progression-free survival (PFS), disease-free survival (DFS), and disease-specific survival (DSS) if reported.

Data extraction and quality assessment

Three authors (RK, IK, BD) extracted data from the included studies using predefined proformas. The quality of included studies in meta-analysis was assessed using ROBINS-I [17], a tool for assessing the risk of bias. Results are reported using ROBIS tool (Supplementary Table 1, 2). When studies included patients managed by non-surgical treatment, cohorts of patients were excluded from analysis (137 patients; 8%).

Types of studies

All prospective and retrospective studies were considered for the analysis. Abstracts of potentially relevant articles were independently screened by two authors (RK, BD). Full texts of all articles identified as potentially relevant were then reviewed. Reference lists of these studies were also scanned to identify any additional studies not previously identified. When multiple articles from the same group within an overlapping study period were found, only the most recent studies were included to avoid duplication. Any disagreement over the relevance of a study was resolved after discussion. Review articles, editorials, letters/comments, and non-English papers were excluded.

Statistical analysis

Differences in survival following a curative surgery (R0-R1) and a debulking surgery (R2) were quantified using hazard ratios (HRs) from individual studies. When HRs were not reported, these were estimated from Kaplan-Meier curves using the approach described by Tierney et al. [18]. Numbers at risk were incorporated into this calculation if reported, with constant censoring assumed otherwise. Resulting HRs were then log-transformed and pooled using a random-effects inverse-variance meta-analysis model with Review Manager 5.3 [19]. Survival outcomes following the two hepatic debulking approaches (≥ 90% and ≥ 70%) were also compared in a similar manner if sufficient data were reported. For comparisons when data were inadequate to perform a formal meta-analysis, a descriptive summary of studies was reported instead.

RESULTS

Included studies

The literature search initially identified a total of 538 studies (Fig. 1), 13 of which met the inclusion criteria. Thus, they were included in the analysis [10,12-16,20-26]. For these 13 included studies, the average patient age was in the range of 51 to 61 years and the majority of primaries were in the small bowel or pancreas. Further details of patient characteristics of included studies are summarized in Table 1 and Supplementary Table 3.

Curative vs. debulking surgery

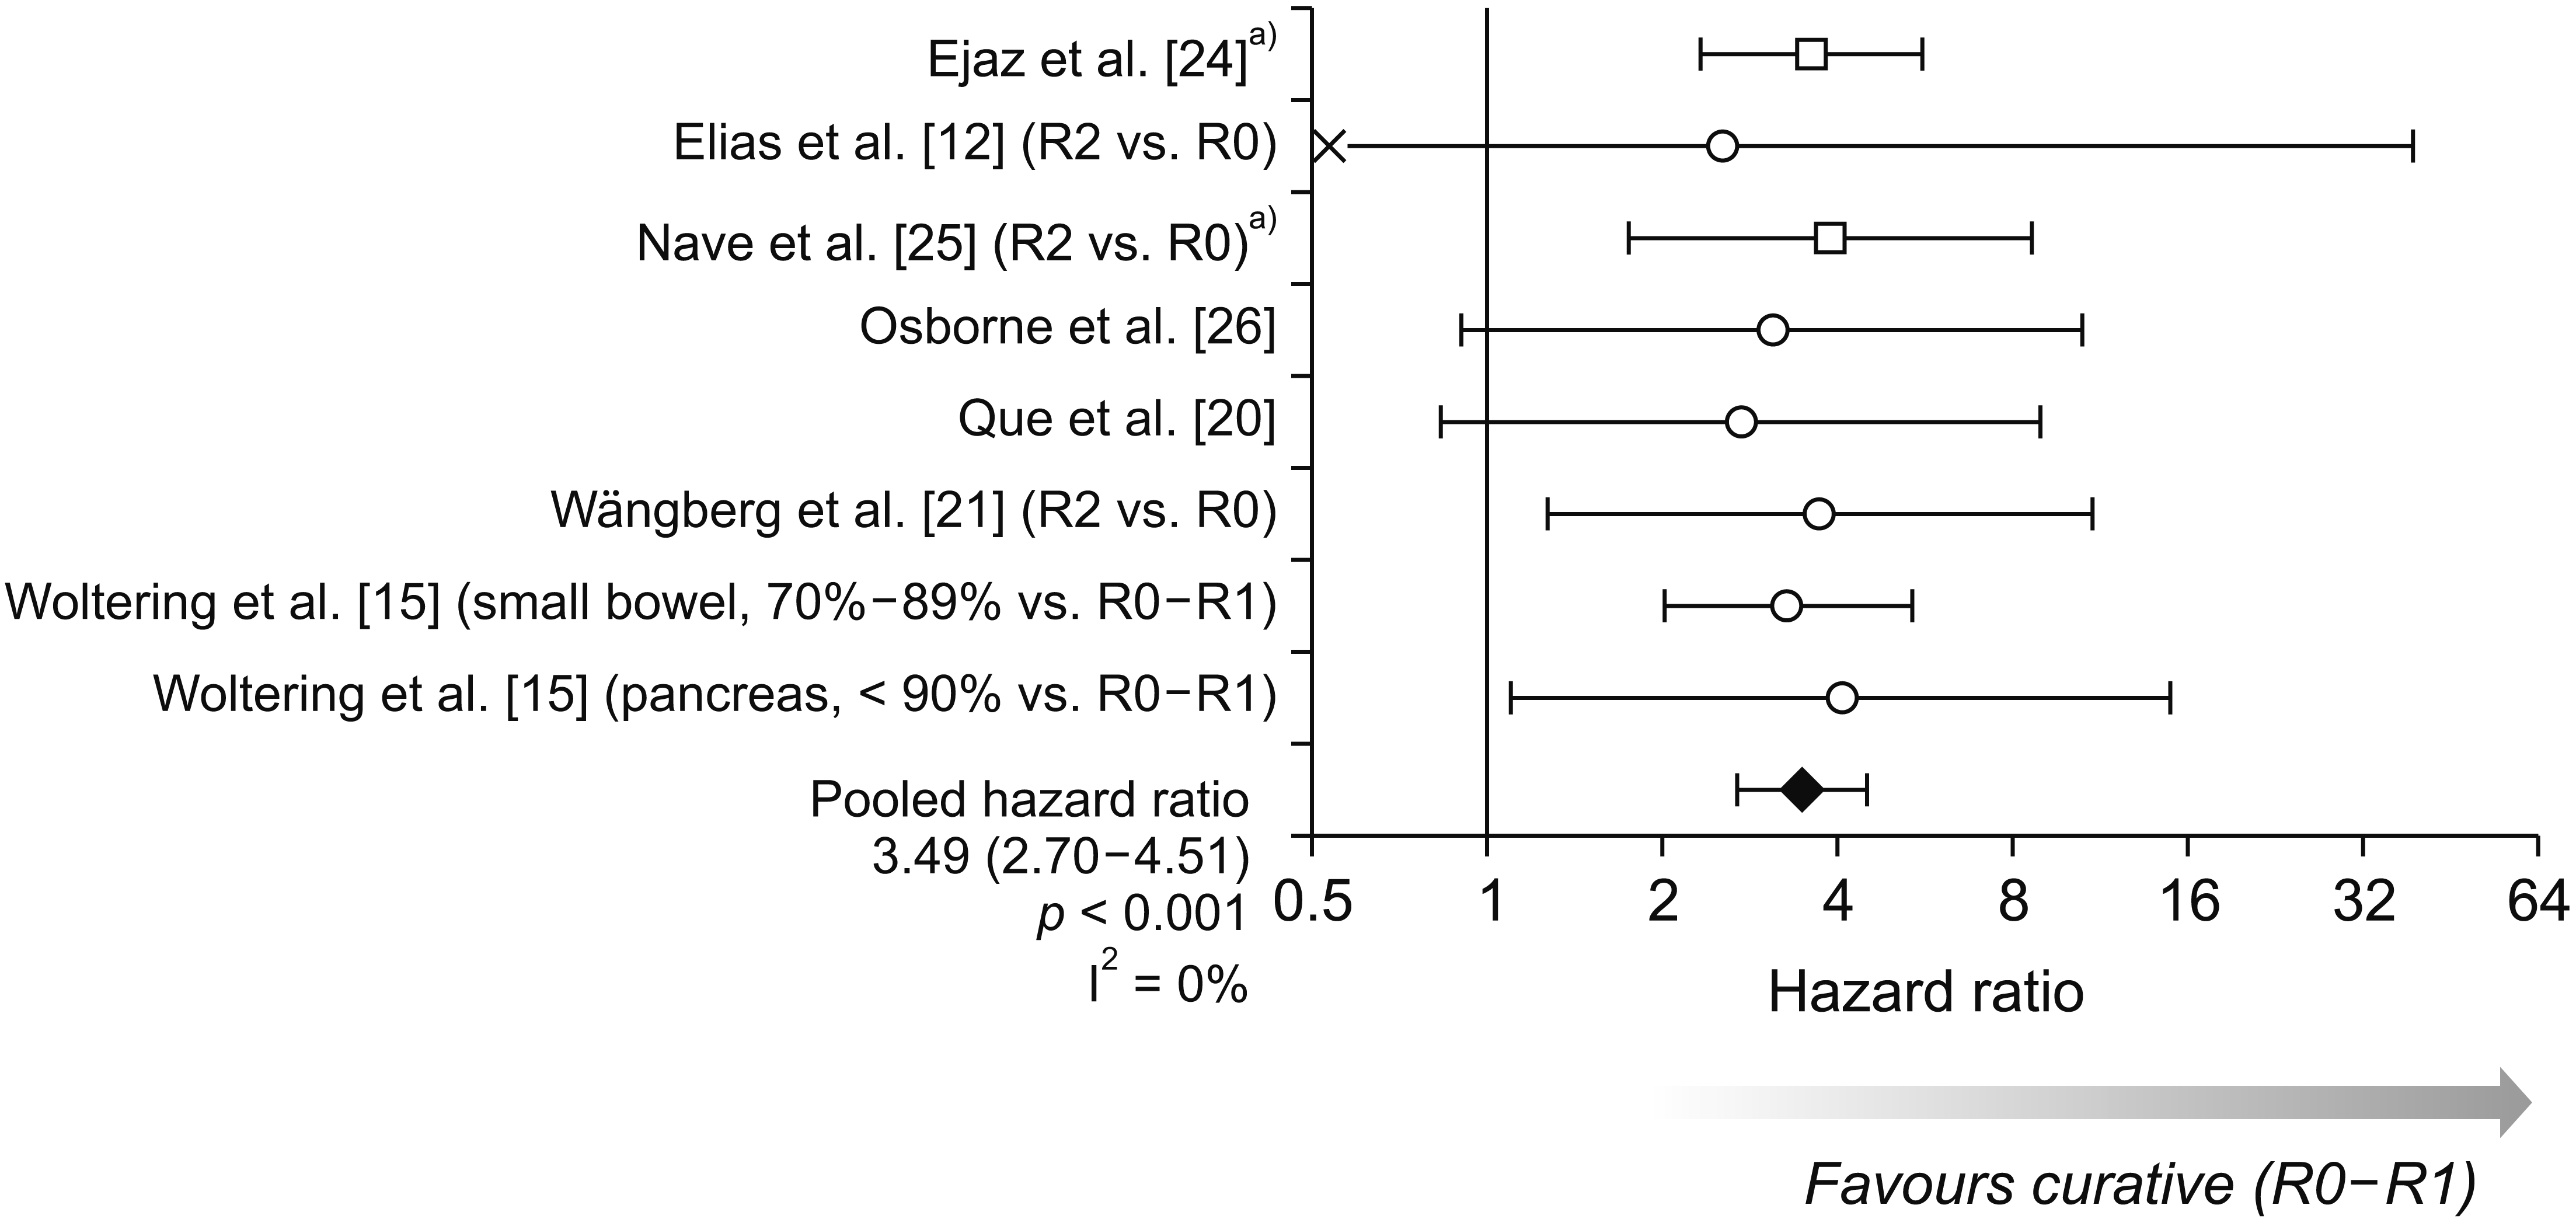
Eleven studies comprising 1,729 patients compared outcomes between resection with curative intent (R0-R1) and debulking (R2) surgery, details of which are reported in Table 2 [10,12,14,15,20-26]. The majority of these studies defined the completeness of a surgery based on the overall R-status, with two studies using liver-specific R-status instead [24,25]. No studies reported a HR with associated 95% confidence interval (CI) from univariable analysis. Hence, these were estimated if possible. Four studies [10,14,22,23] reported no significant differences in OS between curative or debulking surgery on OS. They did not give sufficient data for a HR to be estimated. In three studies [20,24,26], Kaplan–Meier curves comparing OS between R2 vs. R0-R1 resection were reported. Hence, these curves were used to estimate the HR for this comparison. HRs for further three studies were estimated from Kaplan–Meier curves comparing R2 vs. R0 resections [12,21,25]. Woltering et al. [15] reported outcomes for small bowel and pancreatic NETLMs separately. These were treated as two cohorts for analysis [14,15]. In each case, the reference category was 99%–100% debulking (categorized as R0-R1 resection), which was compared to 70%–89% hepatic debulking for small bowel and < 90% debulking for pancreatic NETLMs, respectively.
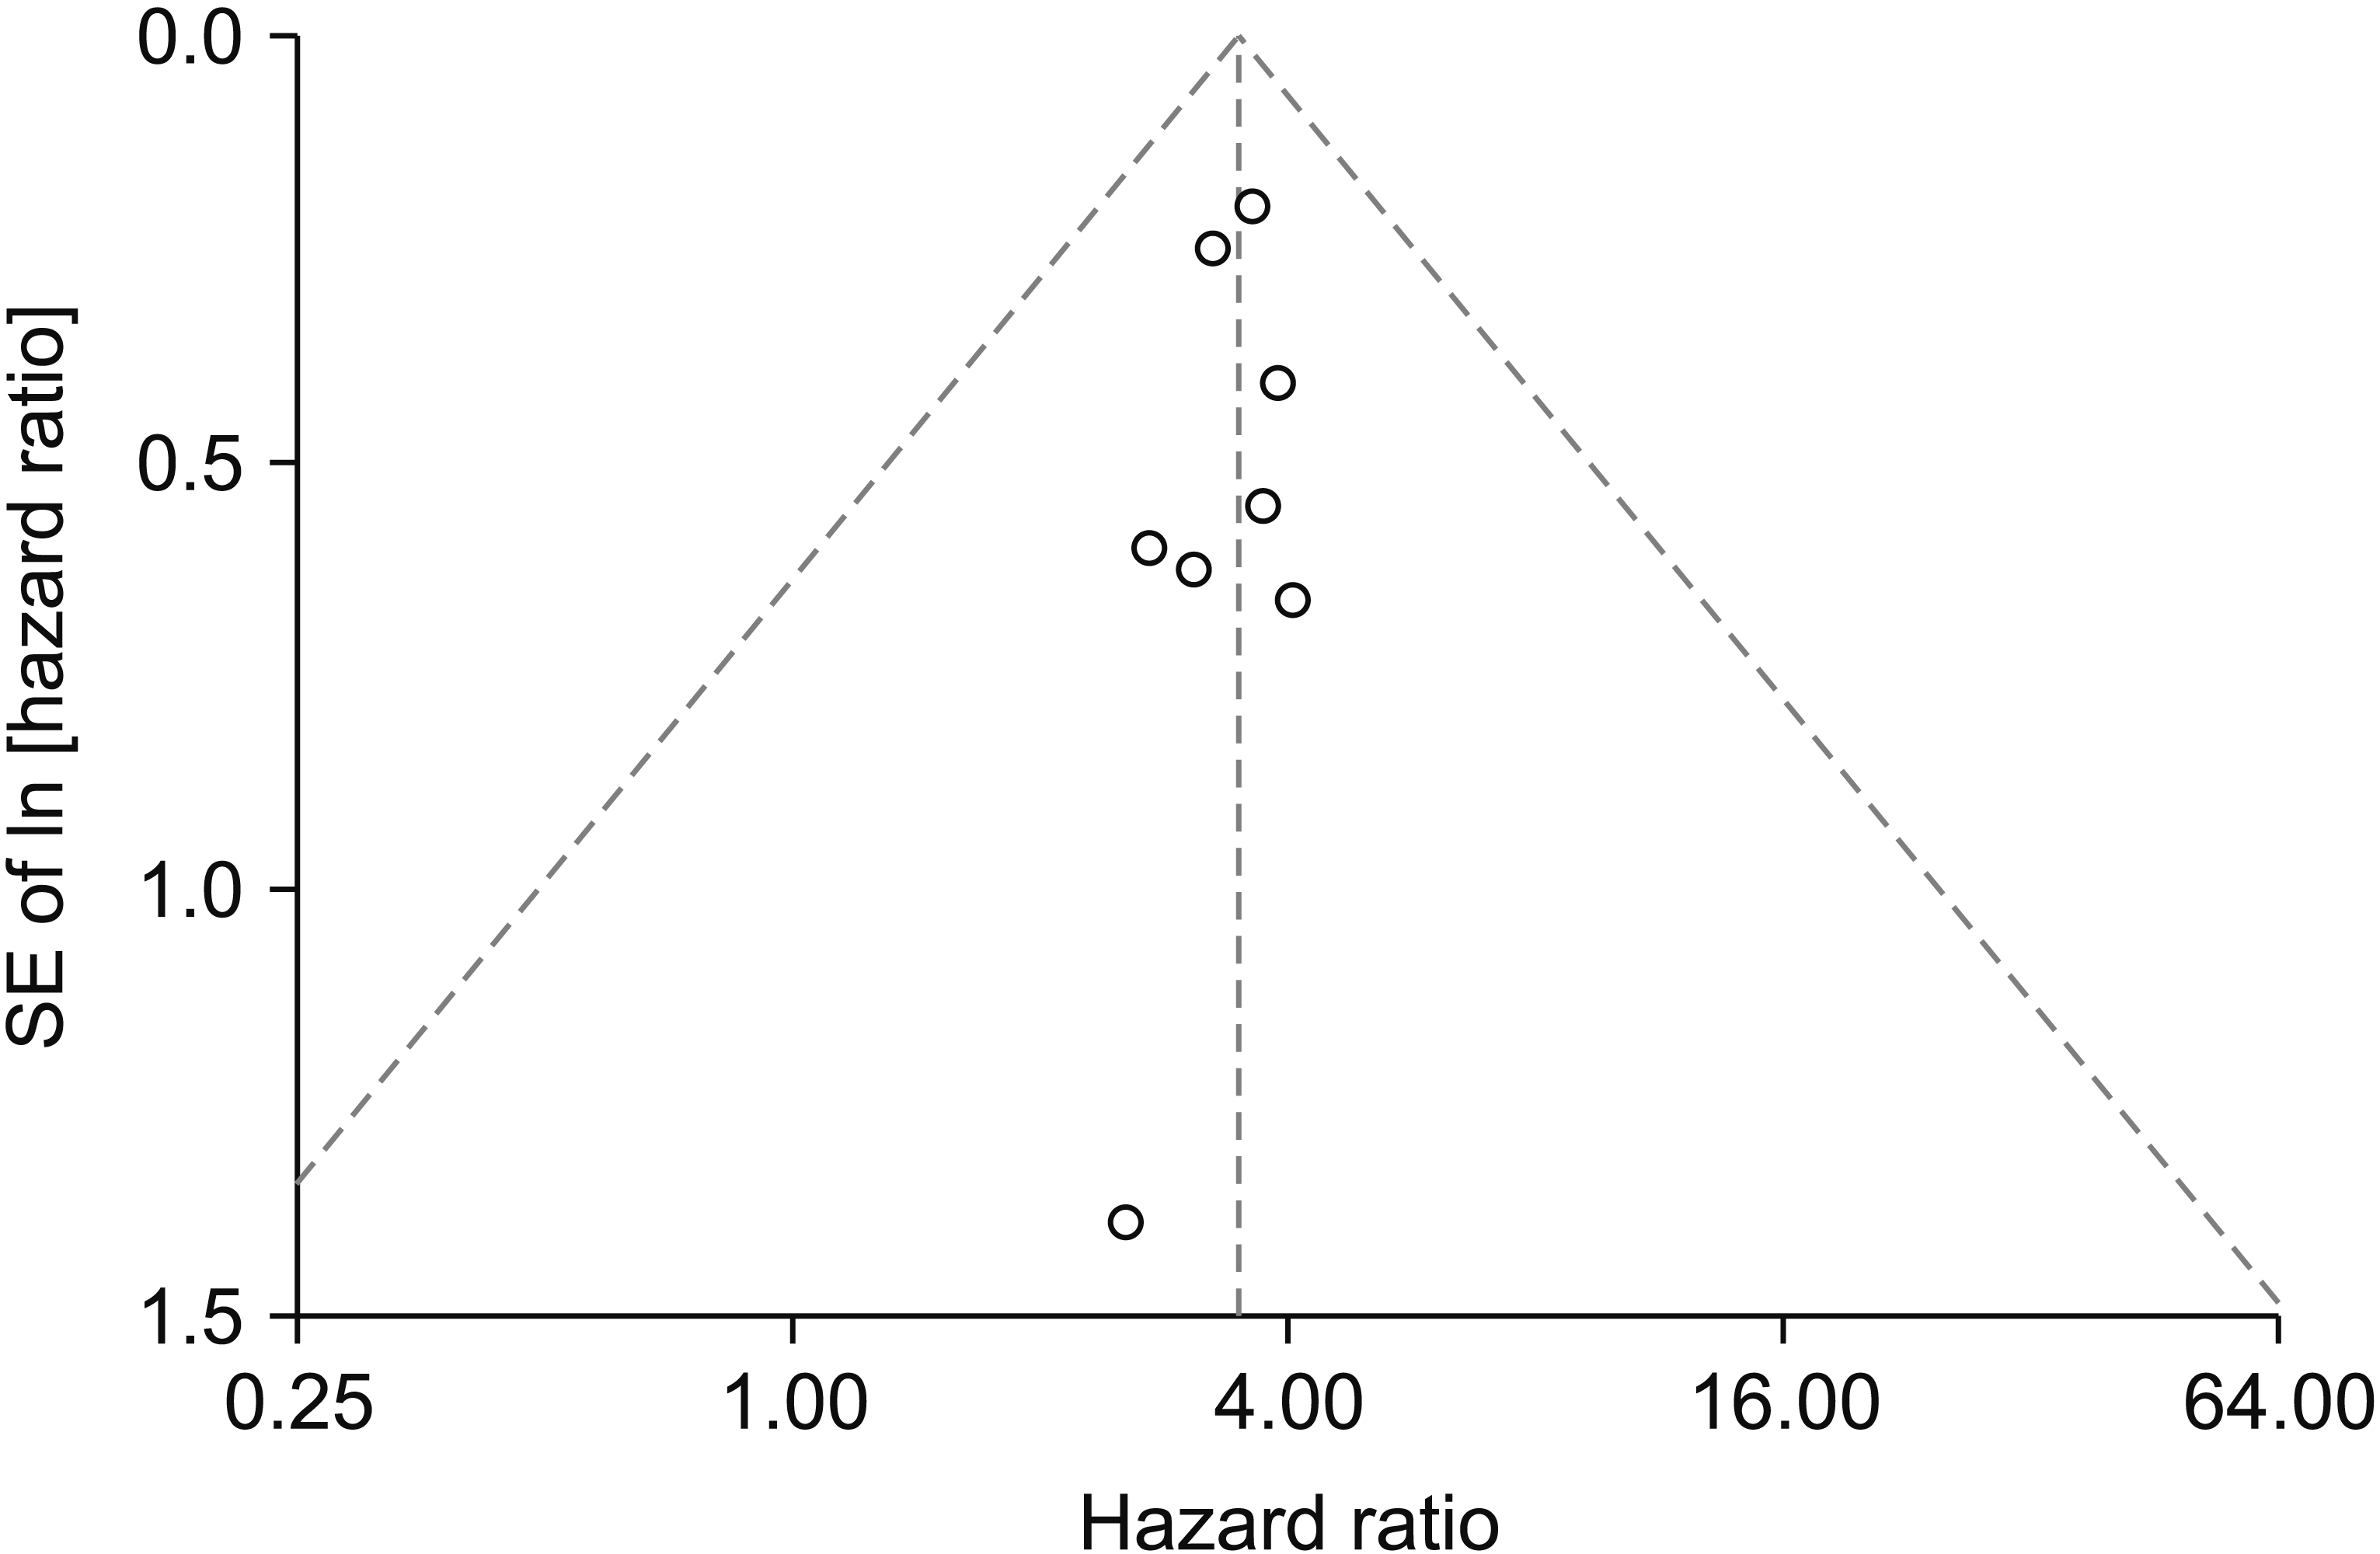
As such, a total of eight cohorts from seven studies were included in the meta-analysis of OS by the completeness of surgery (Fig. 2). After pooling these studies, it was found that OS was significantly shorter in debulking (R2) relative to curative intent (R0/R1) resections (p < 0.001), with a pooled HR of 3.49 (95% CI, 2.70–4.51). Effect sizes reported by these studies were similar, with an I2 statistic of 0%. A funnel plot gave no indication of publication bias (Fig. 3). Sensitivity analysis excluding the two studies using a liver-specific rather than overall R-status returned consistent results (HR, 3.28; 95% CI, 2.26–4.77; p < 0.001; I2 = 0%).
Two studies reported multivariable analyses of OS with aim to isolate the independent effect of the extent of resection after accounting for other potentially confounding factors [10,24]. Glazer et al. [10] did not find that the completeness of surgery categorized as R0 vs. R1 vs. R2 resection was a significant predictor of OS in a multivariable model. However, their model used a stepwise approach to variable selection without reporting a p-value or HR. Hence, their finding could not be further interrogated. On the other hand, Ejaz et al. [24] found R2 resection to be an independent predictor of poorer OS after accounting for a range of demographic, tumor-related, and operative factors (HR, 2.92; 95% CI, 1.65–5.17; p < 0.001).
In addition to OS assessment, some studies also reported data for other survival- and recurrence-related outcomes by completeness of resection. Elias et al. [12] found that patients undergoing a curative surgery had significantly longer DFS than those undergoing a debulking surgery (p = 0.003). However, this was not observed by Glazer et al. (p = 0.8) [10], with Graff-Baker et al. [22] reporting no significant differences in PFS (p = 0.38) or DSS (p = 0.93) between curative and debulking groups. Due to small numbers of studies and heterogeneity of reporting, formal meta-analysis of these secondary outcomes was not possible.

NETLM debulking strategies

Five studies (654 patients) compared outcomes by the degree of hepatic debulking (≥ 90% and ≥ 70%) in the setting of NETLM [13-16,22]. Of these, both Maxwell et al. [13] and Woltering et al. [15] reported outcomes in the small bowel and pancreatic NETLMs separately, giving seven cohorts for analysis (Table 3). However, the majority of these studies did not report sufficient data for HRs or the associated 95% CI to be estimated. As such, formal meta-analysis was not possible for this section of the review. Hence, these studies were instead analyzed using a qualitative approach.
Four studies [13-16] compared OS between debulking strategies. For the threshold of 90% debulking, only Woltering et al. [15] reported a significant difference in OS, with median survival time in the pancreatic NETLM cohort showing a modest reduction from 6.7 to 6.3 years in the 90%–98% debulking group vs. the < 90% debulking group (p = 0.015). Three studies [13,15,16] additionally compared OS after ≥ 70% and < 70% hepatic debulking. Of these, Scott et al. [16] and the pancreatic NETLM cohort of Maxwell et al. [13] both reported significantly shorter OS after < 70% vs. ≥ 70% debulking, with Scott et al. [16] additionally performing a multivariable analysis and finding < 70% debulking to be independently associated with poorer OS. No significant effect was observed in the other two cohorts [13,15]. In addition to assessing debulking using thresholds, Scott et al. [16] also analyzed the degree of debulking as a continuous variable, which was significant (p < 0.01) in a Cox regression model, implying that OS became progressively longer when the proportion of debulking increased.
In addition to the analysis of OS, four studies also assessed the outcome of PFS [13,14,16,22]. Of these, two studies [13,16] reported significantly longer PFS with greater degrees of hepatic debulking, as quantified by both 70% and 90% thresholds. The two other studies [14,22] specifically considered liver-specific PFS. They did not find it to differ significantly between ≥ 90% and < 90% debulking. Scott et al. [16] additionally analyzed the degree of debulking as a continuous variable and found it to be significantly associated with PFS (p < 0.01), with such association persisting on multivariable analysis (p = 0.01).

DISCUSSION

The optimal management of NETs in the setting of NETLM remains unclear partly due to the heterogeneity of disease behavior and heterogenous reporting of outcomes [27]. Complete surgical resection is the best curative option for NETLM, with reported five- and ten-year OS rates of up to 74% and 51%, respectively, and a median survival three times that of patients with untreated NETLMs. However, curative resection is only possible in 10% to 20% patients. In addition, it is difficult to achieve a curative resection in extensive disease. As such, where curative resection is not feasible, debulking surgery offers an alternative treatment approach as it may reduce the risk of liver failure due to progression of liver disease and provide relief of hormonal symptoms in patients with functional tumors. As such, the present systematic review and meta-analysis compared outcomes between various liver resection strategies for NETLM.
In the first stage of the current analysis, the aim was to assess differences in OS between curative and debulking resections. Pooling of studies identified by the systematic review found that curative surgery (R0/R1) was associated with significantly longer OS than debulking surgery in NETLM, with a pooled HR of 3.49 and consistent effect sizes across studies. The next stage of the analysis aimed to identify effects of different debulking thresholds in those undergoing incomplete resections. Optimal thresholds of debulking suggested in the literature have evolved over time. In 1990, McEntee et al. [28] set the debulking threshold at 90% based on his early experience of 37 patients. Other authors [9,11,20] endorsed this threshold. It became an acceptable oncologic threshold for increasing patient survival. However, more recently, lower thresholds have been proposed, with Chambers et al. [29] reporting a five-year OS of 74% in a cohort with a hepatic debulking threshold of 70%. As such, thresholds of 70% and 90% were used in the current review.
Due to inconsistencies of the extent of debulking used with poor statistical reporting (i.e., absence of HRs and 95% CI) of the identified studies, it was not possible to perform reliable quantitative meta-analysis of these thresholds. Qualitative review of included studies revealed that the majority of them found no significant difference in OS between patients with < 90% debulking and those with ≥ 90% debulking. However, studies comparing < 70% vs. ≥ 70% debulking tended to show that resections below 70% was associated with significantly shorter OS. Analysis of PFS found that the effect of the degree of hepatic debulking was more pronounced for this outcome, with significant differences in PFS consistently being observed for both 90% and 70% thresholds. Scott et al. [16] additionally analyzed the degree of debulking as continuum rather than grouping based on thresholds and found a significant and progressive improvement in both OS and PFS with greater percentage of debulking.
To summarize these findings, the interpretation is that OS becomes progressively shorter as the degree of hepatic debulking decreases. While this would imply that OS will be shorter below the 90% debulking threshold, the magnitude of this difference is insufficient to be clinically (or statistically) relevant. On the other hand, a marked reduction in OS becomes more observable when debulking is below the 70% threshold. With respect to PFS, significant differences are visible even at the 90% debulking threshold, implying that this is insufficient to reduce the risk of recurrence to be in line with that of a curative surgery.
When curative resection of NETLM is not feasible, non-surgical treatment options are an alternative to debulking surgery. Whilst this was not part of the current review, studies have assessed outcomes after trans-arterial therapy, reporting five-year OS of 40% compared to 70% for hepatic resection [26]. The OS was also significantly longer in those who underwent cytoreduction therapy in this study (median, 24 months vs. 43 months). In another propensity score matched study [30], the mean OS was 38 months for the trans-arterial therapy group and 84 months for the surgical group. Yttrium microspheres have been reported to be more promising in long-term disease control of NETLM. A multi-institutional study [31] with 168 patients showed stable disease in 23% and complete response in 3% of patients, with a median OS of 70 months. However, these results have not been reproduced in other studies [32,33].
Another alternative to resection of NETLM is liver transplantation, although this is subject to some debate. Based on European NET guidelines [34] with careful selection of those with young age, stable disease, low Ki67 index, reduced hepatic load, and the absence of extrahepatic disease, studies of liver transplant in NETLM have reported an acceptable five-year OS of over 50% for midgut tumors and up to 50% for pancreatic NETLMs [35,36]. However, the strict selection criteria, the lack of wide acceptance to NETLM as an indication for liver transplant programs, and the limited donor pool remain limiting factors for offering transplantation to this group of patients.
In addition to survival, quality of life is another important outcome to consider when assessing surgical interventions. However, data on quality of life in patients undergoing resection of NETLM are currently sparse. Spolverato et al. [2] reported no difference in the improvement of overall quality of life between surgical and non-surgical groups of patients having an initial treatment for NETLM, although the proportion of patients who reported being dissatisfied with their treatment was significantly lower in the surgical group than in the non-surgical group (5.4% vs. 9.4%; p = 0.001). Patients with a very poor quality of life at the time of the diagnosis were more likely to experience an improvement in quality of life after treatment.
There are several limitations of this review, the majority of which are related to the consistency and quality of reporting of studies identified by the systematic review. The primary limitation was the fact that no study reported HRs with associated 95% CIs for comparisons of interest. As a result, these statistics had to be estimated from Kaplan-Meier curves, which was subject to a margin of error. It might have introduced bias. Another limitation was the fact that studies rarely reported multivariable or adjusted analyses to account for any baseline differences between treatment groups. Many other factors are known to influence survival, including the age of the patient, lymph node metastasis, symptomatic disease, presence of extrahepatic disease, and the site and presence of the primary tumor. The third limitation was the relatively small number of studies identified, particularly for the analysis of debulking thresholds, and small numbers of patients in some of the included studies. Finally, there was some inconsistency of grouping used by studies. For example, some classified curative surgery as a combination of R0 and R1 resections, whilst others reported these as separate groups or reported only R0 resections. This might have resulted in incompatibility of some studies included for comparisons of curative and debulking surgeries as well as comparisons by debulking thresholds. However, when the risk of bias was assessed using ROBIS tool [37], the overall risk was estimated to be low. It is unlikely that randomized trials will be performed to compare outcomes among various treatment modalities. Therefore, future prospective studies on this subject should aim to capture all the above-mentioned patients and tumor-related prognostic factors to allow a uniform and standardized reporting of results. Quality of life and patient-reported outcomes also need to be included in future studies as they have a significant role in selecting long-term treatment options for these patients.
In conclusion, curative intent surgery (R0-R1) is associated with a significantly longer OS than debulking surgery of NETLM. The extent of debulking also appears to influence both OS and PFS, with outcomes being superior with above 70% debulking and a tendency of improved outcomes with above a 90% threshold.

SUPPLEMENTARY DATA

Supplementary data related to this article can be found at https://doi.org/10.14701/ahbps.21-101.

ACKNOWLEDGEMENTS

Dr Rebecca Glover, for her initial help with data collection.

Notes

FUNDING

None.

CONFLICT OF INTEREST

No potential conflict of interest relevant to this article was reported.

AUTHOR CONTRIBUTIONS

Conceptualization: BVMD. Data curation: RK, IK, JH. Methodology: JH, BVMD. Visualization: JH, BVMD. Writing - original draft: RK, IK, JH, SR, SP, BVMD. Writing - review & editing: JH, SR, TS, SP, BVMD.

REFERENCES

1. Modlin IM, Champaneria MC, Chan AK, Kidd M. 2007; A three-decade analysis of 3,911 small intestinal neuroendocrine tumors: the rapid pace of no progress. Am J Gastroenterol. 102:1464–1473. DOI: 10.1111/j.1572-0241.2007.01185.x. PMID: 17391319.
crossref
2. Spolverato G, Bagante F, Wagner D, Buettner S, Gupta R, Kim Y, et al. 2015; Quality of life after treatment of neuroendocrine liver metastasis. J Surg Res. 198:155–164. DOI: 10.1016/j.jss.2015.05.048. PMID: 26095419.
crossref
3. Rindi G, Klöppel G, Couvelard A, Komminoth P, Körner M, Lopes JM, et al. 2007; TNM staging of midgut and hindgut (neuro) endocrine tumors: a consensus proposal including a grading system. Virchows Arch. 451:757–762. DOI: 10.1007/s00428-007-0452-1. PMID: 17674042.
crossref
4. Boudreaux JP, Klimstra DS, Hassan MM, Woltering EA, Jensen RT, Goldsmith SJ, et al. 2010; The NANETS consensus guideline for the diagnosis and management of neuroendocrine tumors: well-differentiated neuroendocrine tumors of the jejunum, ileum, appendix, and cecum. Pancreas. 39:753–766. DOI: 10.1097/MPA.0b013e3181ebb2a5. PMID: 20664473.
crossref
5. Thompson GB, van Heerden JA, Grant CS, Carney JA, Ilstrup DM. 1988; Islet cell carcinomas of the pancreas: a twenty-year experience. Surgery. 104:1011–1017. PMID: 2904180.
6. Chen H, Hardacre JM, Uzar A, Cameron JL, Choti MA. 1998; Isolated liver metastases from neuroendocrine tumors: does resection prolong survival? J Am Coll Surg. 187:88–92. discussion 92–93. DOI: 10.1016/S1072-7515(98)00099-4. PMID: 9660030.
crossref
7. Farley HA, Pommier RF. 2016; Treatment of neuroendocrine liver metastases. Surg Oncol Clin N Am. 25:217–225. DOI: 10.1016/j.soc.2015.08.010. PMID: 26610783.
crossref
8. Metz DC, Jensen RT. 2008; Gastrointestinal neuroendocrine tumors: pancreatic endocrine tumors. Gastroenterology. 135:1469–1492. DOI: 10.1053/j.gastro.2008.05.047. PMID: 18703061. PMCID: PMC2612755.
crossref
9. Sarmiento JM, Heywood G, Rubin J, Ilstrup DM, Nagorney DM, Que FG. 2003; Surgical treatment of neuroendocrine metastases to the liver: a plea for resection to increase survival. J Am Coll Surg. 197:29–37. DOI: 10.1016/S1072-7515(03)00230-8. PMID: 12831921.
10. Glazer ES, Tseng JF, Al-Refaie W, Solorzano CC, Liu P, Willborn KA, et al. 2010; Long-term survival after surgical management of neuroendocrine hepatic metastases. HPB (Oxford). 12:427–433. DOI: 10.1111/j.1477-2574.2010.00198.x. PMID: 20662794. PMCID: PMC3028584.
crossref
11. Mayo SC, de Jong MC, Pulitano C, Clary BM, Reddy SK, Gamblin TC, et al. 2010; Surgical management of hepatic neuroendocrine tumor metastasis: results from an international multi-institutional analysis. Ann Surg Oncol. 17:3129–3136. DOI: 10.1245/s10434-010-1154-5. PMID: 20585879.
crossref
12. Elias D, Lasser P, Ducreux M, Duvillard P, Ouellet JF, Dromain C, et al. 2003; Liver resection (and associated extrahepatic resections) for metastatic well-differentiated endocrine tumors: a 15-year single center prospective study. Surgery. 133:375–382. DOI: 10.1067/msy.2003.114. PMID: 12717354.
crossref
13. Maxwell JE, Sherman SK, O'Dorisio TM, Bellizzi AM, Howe JR. 2016; Liver-directed surgery of neuroendocrine metastases: what is the optimal strategy? Surgery. 159:320–333. DOI: 10.1016/j.surg.2015.05.040. PMID: 26454679. PMCID: PMC4688152.
crossref
14. Morgan RE, Pommier SJ, Pommier RF. 2018; Expanded criteria for debulking of liver metastasis also apply to pancreatic neuroendocrine tumors. Surgery. 163:218–225. DOI: 10.1016/j.surg.2017.05.030. PMID: 29103583.
crossref
15. Woltering EA, Voros BA, Beyer DT, Wang YZ, Thiagarajan R, Ryan P, et al. 2017; Aggressive surgical approach to the management of neuroendocrine tumors: a report of 1,000 surgical cytoreductions by a single institution. J Am Coll Surg. 224:434–447. DOI: 10.1016/j.jamcollsurg.2016.12.032. PMID: 28088602.
crossref
16. Scott AT, Breheny PJ, Keck KJ, Bellizzi AM, Dillon JS, O'Dorisio TM, et al. 2019; Effective cytoreduction can be achieved in patients with numerous neuroendocrine tumor liver metastases (NETLMs). Surgery. 165:166–175. DOI: 10.1016/j.surg.2018.04.070. PMID: 30343949. PMCID: PMC6637412.
crossref
17. Sterne JAC, Savović J, Page MJ, Elbers RG, Blencowe NS, Boutron I, et al. 2019; RoB 2: a revised tool for assessing risk of bias in randomised trials. BMJ. 366:l4898. DOI: 10.1136/bmj.l4898. PMID: 31462531.
crossref
18. Tierney JF, Stewart LA, Ghersi D, Burdett S, Sydes MR. 2007; Practical methods for incorporating summary time-to-event data into meta-analysis. Trials. 8:16. DOI: 10.1186/1745-6215-8-16. PMID: 17555582. PMCID: PMC1920534.
crossref
19. The Nordic Cochrane Centre, The Cochrane Collaboration. 2014. Review manager (RevMan). Version 5.2.3. The Nordic Cochrane Centre, The Cochrane Collaboration;Copenhagen:
20. Que FG, Nagorney DM, Batts KP, Linz LJ, Kvols LK. 1995; Hepatic resection for metastatic neuroendocrine carcinomas. Am J Surg. 169:36–42. discussion 42–43. DOI: 10.1016/S0002-9610(99)80107-X. PMID: 7817996.
crossref
21. Wängberg B, Westberg G, Tylén U, Tisell L, Jansson S, Nilsson O, et al. 1996; Survival of patients with disseminated midgut carcinoid tumors after aggressive tumor reduction. World J Surg. 20:892–899. discussion 899DOI: 10.1007/s002689900136. PMID: 8678968.
crossref
22. Graff-Baker AN, Sauer DA, Pommier SJ, Pommier RF. 2014; Expanded criteria for carcinoid liver debulking: maintaining survival and increasing the number of eligible patients. Surgery. 156:1369–1376. discussion 1376–1377. DOI: 10.1016/j.surg.2014.08.009. PMID: 25456912.
crossref
23. Chamberlain RS, Canes D, Brown KT, Saltz L, Jarnagin W, Fong Y, et al. 2000; Hepatic neuroendocrine metastases: does intervention alter outcomes? J Am Coll Surg. 190:432–445. DOI: 10.1016/S1072-7515(00)00222-2. PMID: 10757381.
24. Ejaz A, Reames BN, Maithel S, Poultsides GA, Bauer TW, Fields RC, et al. 2018; Cytoreductive debulking surgery among patients with neuroendocrine liver metastasis: a multi-institutional analysis. HPB (Oxford). 20:277–284. DOI: 10.1016/j.hpb.2017.08.039. PMID: 28964630.
crossref
25. Nave H, Mössinger E, Feist H, Lang H, Raab H. 2001; Surgery as primary treatment in patients with liver metastases from carcinoid tumors: a retrospective, unicentric study over 13 years. Surgery. 129:170–175. DOI: 10.1067/msy.2001.110426. PMID: 11174710.
crossref
26. Osborne DA, Zervos EE, Strosberg J, Boe BA, Malafa M, Rosemurgy AS, et al. 2006; Improved outcome with cytoreduction versus embolization for symptomatic hepatic metastases of carcinoid and neuroendocrine tumors. Ann Surg Oncol. 13:572–581. DOI: 10.1245/ASO.2006.03.071. PMID: 16511671.
crossref
27. Ellis L, Shale MJ, Coleman MP. 2010; Carcinoid tumors of the gastrointestinal tract: trends in incidence in England since 1971. Am J Gastroenterol. 105:2563–2569. DOI: 10.1038/ajg.2010.341. PMID: 20823835.
crossref
28. McEntee GP, Nagorney DM, Kvols LK, Moertel CG, Grant CS. 1990; Cytoreductive hepatic surgery for neuroendocrine tumors. Surgery. 108:1091–1096. PMID: 1701060.
29. Chambers AJ, Pasieka JL, Dixon E, Rorstad O. 2008; The palliative benefit of aggressive surgical intervention for both hepatic and mesenteric metastases from neuroendocrine tumors. Surgery. 144:645–651. discussion 651–653. DOI: 10.1016/j.surg.2008.06.008. PMID: 18847650.
crossref
30. Mayo SC, de Jong MC, Bloomston M, Pulitano C, Clary BM, Reddy SK, et al. 2011; Surgery versus intra-arterial therapy for neuroendocrine liver metastasis: a multicenter international analysis. Ann Surg Oncol. 18:3657–3665. DOI: 10.1245/s10434-011-1832-y. PMID: 21681380.
crossref
31. Kennedy AS, Dezarn WA, McNeillie P, Coldwell D, Nutting C, Carter D, et al. 2008; Radioembolization for unresectable neuroendocrine hepatic metastases using resin 90Y-microspheres: early results in 148 patients. Am J Clin Oncol. 31:271–279. DOI: 10.1097/COC.0b013e31815e4557. PMID: 18525307.
crossref
32. Lacin S, Oz I, Ozkan E, Kucuk O, Bilgic S. 2011; Intra-arterial treatment with 90yttrium microspheres in treatment-refractory and unresectable liver metastases of neuroendocrine tumors and the use of 111in-octreotide scintigraphy in the evaluation of treatment response. Cancer Biother Radiopharm. 26:631–637. DOI: 10.1089/cbr.2011.0957. PMID: 21950557.
crossref
33. Ezziddin S, Meyer C, Kahancova S, Haslerud T, Willinek W, Wilhelm K, et al. 2012; 90Y Radioembolization after radiation exposure from peptide receptor radionuclide therapy. J Nucl Med. 53:1663–1669. DOI: 10.2967/jnumed.112.107482. PMID: 22988059.
crossref
34. Niederle B, Pape UF, Costa F, Gross D, Kelestimur F, Knigge U, et al. 2016; ENETS consensus guidelines update for neuroendocrine neoplasms of the jejunum and ileum. Neuroendocrinology. 103:125–138. DOI: 10.1159/000443170. PMID: 26758972.
crossref
35. Máthé Z, Tagkalos E, Paul A, Molmenti EP, Kóbori L, Fouzas I, et al. 2011; Liver transplantation for hepatic metastases of neuroendocrine pancreatic tumors: a survival-based analysis. Transplantation. 91:575–582. DOI: 10.1097/TP.0b013e3182081312. PMID: 21200365.
crossref
36. Mazzaferro V, Sposito C, Coppa J, Miceli R, Bhoori S, Bongini M, et al. 2016; The long-term benefit of liver transplantation for hepatic metastases from neuroendocrine tumors. Am J Transplant. 16:2892–2902. DOI: 10.1111/ajt.13831. PMID: 27134017.
crossref
37. Whiting P, Savović J, Higgins JP, Caldwell DM, Reeves BC, Shea B, et al. 2016; ROBIS: a new tool to assess risk of bias in systematic reviews was developed. J Clin Epidemiol. 69:225–234. DOI: 10.1016/j.jclinepi.2015.06.005. PMID: 26092286. PMCID: PMC4687950.
crossref

Fig. 1
PRISMA flowsheet showing selection of studies.
ahbps-26-1-31-f1.tif
Fig. 2
Forest plot of overall survival by cytoreductive strategy. Elias et al. [12], Nave et al. [25], and Wängberg et al. [21] treated R0 rather than R0-R1 as the reference category, whilst Woltering et al. [15] compared 70%–89% and < 90% debulking for small bowel and pancreatic neuroendocrine tumors, respectively. The lower confidence interval reported by Elias et al. [12] was truncated to improve scaling. a)Studies indicated by squares defined groups using liver-specific rather than overall R-status—excluding these studies returned a similar pooled hazard ratio of 3.28 (95% confidence interval, 2.26–4.77; p < 0.001; I2 = 0%).
ahbps-26-1-31-f2.tif
Fig. 3
Funnel plot of overall survival by cytoreductive strategy. Studies included in the plot and pooled hazard ratio used to generate the funnel are the same as for Fig. 2. SE, standard error; ln, natural logarithm.
ahbps-26-1-31-f3.tif
Table 1
Included studies
Author (year) Study period Total (n) Follow-up time (mon) R-status % debulking


Curative (R0-R1) Debulking (R2) ≥ 90% 90%–99% ≥ 70% 70%–79% < 70%
Graff-Baker et al. (2014) [22] 2007–2011 52 38 19 (37%) 33 (63%) - 22 (42%) - 11 (21%) -
Maxwell et al. (2016) [13] 1999–2015 P: 28
SB: 80
49 NR NR P: 10 (28%)
SB: 32 (32%)
- P: 18 (50%)
SB: 51 (51%)
- P: 8 (22%)
SB: 17 (17%)
Woltering et al. (2017) [15] 2003–2016 P: 83c)
SB: 487c)
Mean: 79 99%–100%: P: 36 (43%) SB: 207 (43%) < 99%: P: 47 (57%) SB: 280 (57%) P: 15 (18%)d)
SB: 113 (23%)d)
P: 32 (39%)d)
SB: 48 (10%)d)
P: NRd)
SB: 119 (24%)d)
Morgan et al. (2018) [14] 2006–2016 44/42a) 33 24 (55%) 20 (45%) - 12 (27%) - 8 (18%) -
Chamberlain et al. (2000) [23] 1992–1998 34b) 27 15 (44%) 19 (56%) - - - - -
Ejaz et al. (2018) [24] 1990–2014 612 51 433 (71%) 179 (29%) - - - - -
Elias et al. (2003) [12] 1985–2000 47 62 37 (79%) 10 (21%) - - - - -
Glazer et al. (2010) [10] 1978–2009 140b) 50 R0: 117 (84%) R1/2: 22 (16%) - - - - -
Scott et al. (2019) [16] 1999–2017 188/184a) 29 NR NR 54 (31%)e) - - 82 (48%)e) 36 (21%)e)
Nave et al. (2001) [25] 1983–1996 31 42 10 (32%) 21 (68%) - - - - -
Osborne et al. (2006) [26] 2000–2004 61b) NR 38 (62%) 23 (38%) - - - - -
Que et al. (1995) [20] 1984–1992 74 26 28 (38%) 46 (62%) - - - - -
Wängberg et al. (1996) [21] NR 64 NR 14 (22%) 50 (78%) - - - - -

Follow-up times are reported as medians, unless stated otherwise.

NR, not reported; P, pancreatic neuroendocrine tumor; SB, small bowel neuroendocrine tumor.

a)Some patients underwent multiple resections, hence numbers are reported as “no. of resections/patients”. b)The number of patients treated with resection. c)The number of patients for which the volume of tumor resected was recorded. d)Woltering et al. [15] grouped patients as 90%–98% and < 90% for P, and as 90%–98%, 70%–89% and < 70% for SB. e) Scott et al. [16] grouped the patients as > 90%, 70%–90%, and < 70% debulking.

Table 2
Overall survival (OS) in curative vs. debulking surgery
Author Overall Five-year OS (median) Univariable analysis of R2 vs. R0-R1


Extent of debulking (R2) Curative (R0-R1) Debulking (R2) HR (95% CI) p-value
Chamberlain et al. [23] N/A 85% 63% - 0.18
Ejaz et al. [24] ≥ 80% (liver-specific) 85.2% (not reached) 60.7% (7.3 yr) 3.63 (2.35–5.62)a) < 0.001*
Elias et al. [12] ≥ 97% R0: 74%
R1: 70%
47% vs. R0: 2.6 (0.2–28.7)a)
vs. R1: 2.5 (0.5–12.5)a)
0.44b)
Glazer et al. [10] ≥ 90% R0: N/A
R1: N/A
N/A - 0.4
Morgan et al. [14] ≥ 90%
≥ 70%
R0: N/A 90-99%: N/A
70-99%: N/A
- 0.64 0.45
Nave et al. [25] N/A (liver-specific) R0: 86% 26% vs. R0: 3.90 (1.76–8.64)a) 0.001*
Osborne et al. [26] ≥ 90% (Mean: 4.2 yr) (Mean: 2.7 yr) 3.10 (0.91–10.52)a) < 0.01*
Que et al. [20] N/A N/A N/A 2.73 (0.84–8.93)a) NS
Wängberg et al. [21] N/A R0: 100% 63% vs. R0: 3.74 (1.28–10.96)a) N/A
Woltering et al. [15] (small bowel) 90%–98%
70%–89%
95% 90%–98%: 87%
70%–89%: 89%
vs. 90%–98%: 2.26 (1.29–3.96)a)
vs. 70%–89%: 3.27 (2.02–5.29)a)
N/A
Woltering et al. [15] (pancreas) 90%–98%
< 90%
84% 90%–98%: 68%
< 90%: 56%
vs. 90%–98%: 3.00 (0.57–15.76)a)
vs. < 90%: 4.06 (1.11–14.93)a)
N/A
Graff-Baker et al. [22]c) 90%–99%, 70%–89% N/Ac) N/Ac) - 0.93c)

The extent of debulking is based on the overall R-status, except for the stated studies, which used the liver-specific R-status. Survival estimates are reported as rates at five years and/or medians, and are for the combined R0-R1 group and the R2 group, unless stated otherwise. HRs are for debulking (R2) vs. curative (R0-R1), unless stated otherwise.

HR, hazard ratio; CI, confidence interval; N/A, data not reported; NS, non-significant, but p-value was not given.

*Statistically significant at p < 0.05.

a)HRs were not reported, hence were estimated from Kaplan–Meier curves. b)p-value is a comparison of R0 vs. R1 vs. R2. c)Study reported disease-specific survival, rather than overall survival.

Table 3
Survival by degree of hepatic debulking
Author Debulking Five-year OS (median) Five-year PFS (median)


Group A vs. B Group A Group B p-value Group A Group B p-value
≥ 90% vs. < 90% debulking
Maxwell et al. [13] (small bowel) ≥ 90% vs. < 90% Not reached 9.1 yr 0.46 3.8 yr 1.6 yr 0.005*
Maxwell et al. [13] (pancreas) ≥ 90% vs. < 90% Not reached 6.1 yr 0.14 4.4 yr 1.3 yr 0.05*
Woltering et al. [15] (small bowel) 90%–98% vs. 70%–89% 87% (22.9 yr) 89% (12.3 yr) NS - - -
Woltering et al. [15] (pancreas) 90%–98% vs. < 90% 68% (6.7 yr) 56% (6.3 yr) 0.015* - - -
Morgan et al. [14] ≥ 90% vs. 70%–89% NR NR 0.29 NRa) NRa) 0.75a)
Graff-Baker et al. [22] 90%–99% vs. 70%–89% - - - NRa) NRa) 0.74a,b)
Scott et al. [16] > 90% vs. 70%–90% Not reached 11.1 yr 0.61 4.7 yr 1.7 yr < 0.01*
≥ 70% vs. < 70% debulking
Maxwell et al. [13] (small bowel) ≥ 70% vs. < 70% Not reached 9.1 yr 0.18 3.2 yr 1.7 yr 0.005*
Maxwell et al. [13] (pancreas) ≥ 70% vs. < 70% Not reached 1.7 yr 0.001* 3.0 yr 0.5 yr < 0.001*
Woltering et al. [15] (small bowel) 70%–89% vs. < 70% 89% (12.3 yr) 64% (7.4 yr) NR - - -
Scott et al. [16] ≥ 70% vs. < 70% 11.2 yr 3.1 yr < 0.001* 1.7 yrc) 0.9 yr < 0.001*

Survival estimates are reported as rates at five years and/or medians, and are for the stated debulking groups.

OS, overall survival; PFS, progression-free survival; NR, data not reported; NS, non-significant, but p-value was not given.

*Statistically significant at p < 0.05.

a)Liver-Specific PFS. b)p-value represents a comparison between three groups: 100% vs. 90%–99% vs. 70%–89%. c)PFS data were reported for the 70%–90% debulking group.

TOOLS
Similar articles