Introduction
Materials and methods
1. Subjects and ethical statement
2. Definition and methods
3. Statistical analysis
Results
1. Baseline characteristics of patients with HLH
Table 1.
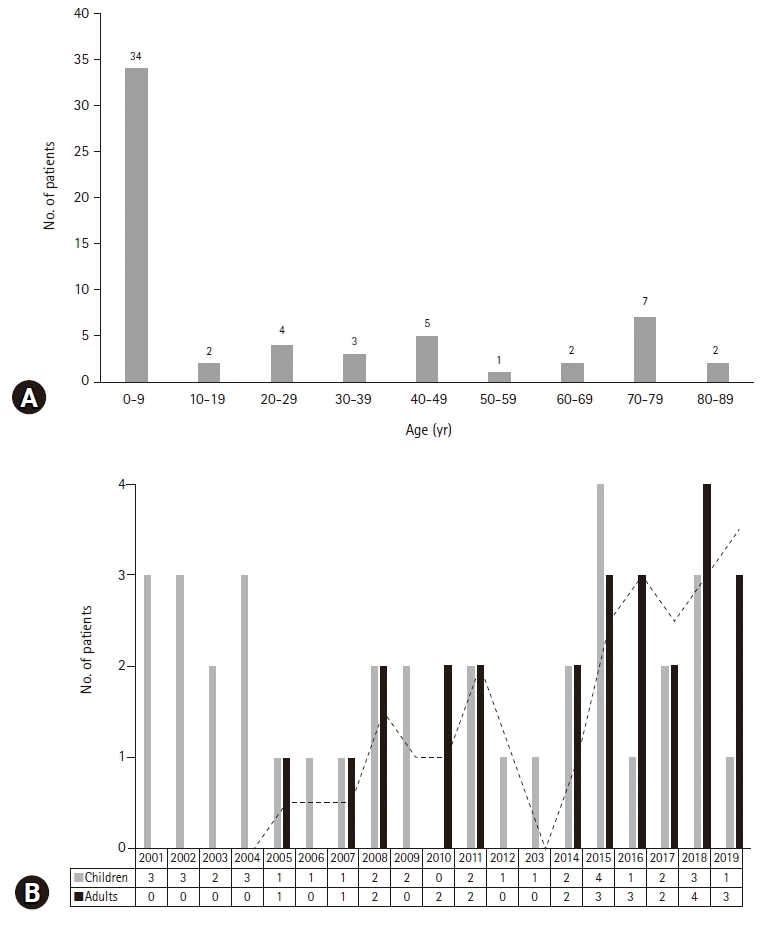
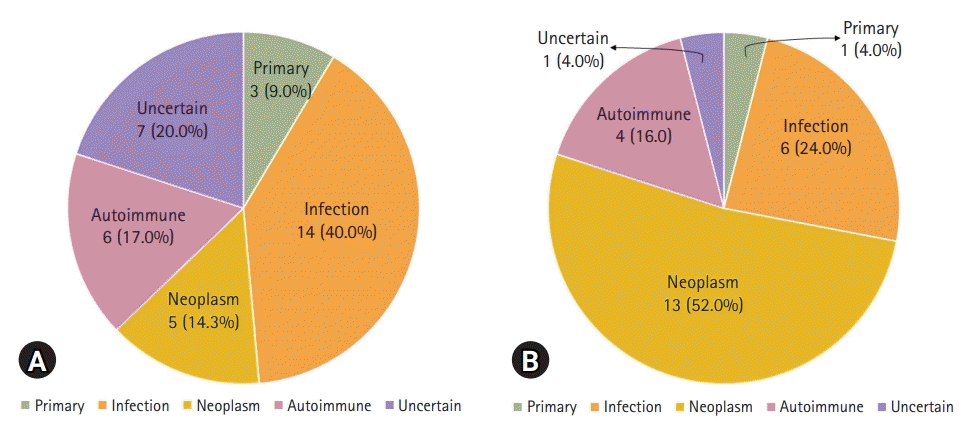
2. Comparison of the causes of HLH according to the age
3. Comparison of the variables between pediatric and adult patients with HLH
Table 2.
| Variable | Child (n=35) | Adult (n=25) | p-value |
|---|---|---|---|
| Sex (male:female) | 21:14 | 14:11 | 0.481 |
| EBV | 7/34 (20.6) | 4/20 (20.0) | >0.050 |
| Fever | 35 (100) | 25 (100) | - |
| Splenomegaly | 24 (68.6) | 24 (96.0) | 0.010 |
| Hepatomegaly | 28 (80.0) | 10 (40.0) | 0.003 |
| Neurologic symptom or sign | 4 (11.4) | 4 (16.0) | 0.708 |
| Rash | 13 (37.1) | 5 (20.0) | 0.253 |
| Hemoglobin (g/L) | 90 (51–121) | 89 (64–157) | 0.685 |
| Neutrophil count (×109/L) | 0.97 (0.06–14.1) | 1.00 (0.18–10.2) | 0.589 |
| Platelet count (×109/L) | 67 (25–384) | 52 (15–158) | 0.184 |
| Triglyceride (mg/dL) | 219 (47–742) | 244 (128–274)a) | 0.988 |
| Fibrinogen (g/L) | 1.32 (0.70–4.22)b) | 2.18 (0.45–6.18) | 0.051 |
| Ferritin (μg/L) | 3,225 (185–204,887) | 2,450 (764–19,640)c) | 0.765 |
| sCD25 (U/mL) | 4,745 (825–27,060)d) | 2,817e) | 0.714 |
| Hemophagocytosis | 32 (91.4) | 24 (96.0) | 0.634 |
| AST (U/L) | 450 (22–5,137) | 221 (11–2,237) | 0.063 |
| ALT (U/L) | 232 (14–1,230) | 120 (8–2,019) | 0.024 |
| LDH (U/L) | 1,565 (266–5,861)f) | 1,660 (262–6,369)c) | 0.666 |
| Total bilirubin (mg/dL) | 1.2 (0.1–11.8) | 1.1 (0.3–8.2) | 0.584 |
| Direct bilirubin (mg/dL) | 0.6 (0.0–8.8) | 1.3 (0.2–6.2)g) | 0.617 |
| PT (sec) | 12.9 (11.7–31.6)b) | 13.7 (11.0–19.4) | 0.758 |
| INR | 1.19 (1.00–2.85)b) | 1.18 (0.93–1.85) | 0.515 |
| aPTT (sec) | 40.1 (25.5–200.0)b) | 39.3 (21.6–68.8) | 0.921 |
| HLH-2004/94 treatment | 28 (80.0) | 0 | <0.001 |
Values are presented as number only, number (%), or median (range).
HLH, hemophagocytic lymphohistiocytosis; EBV, Epstein–Barr virus; sCD25, soluble CD25; AST, aspartate transaminase; ALT, alanine transaminase; LDH, lactate dehydrogenase; PT, prothrombin time; INR, international normalized ratio; aPTT, activated partial thromboplastin time.
4. Comparison of the variables between survival and death groups of patients with HLH
Table 3.
| Variable | Survival group (n=37) | Death group (n=23) | p-value |
|---|---|---|---|
| Sex (male:female) | 20:17 | 15:8 | 0.432 |
| Age (yr) | 5.3 (0.1–76.5) | 39.3 (0.1–89) | 0.007 |
| Primary HLH | 1 (2.7) | 3 (13.0) | 0.153 |
| Infection-associated HLH | 17 (45.9) | 3 (13.0) | 0.011 |
| Neoplasm-associated HLH | 5 (13.5) | 13 (56.5) | 0.001 |
| Autoimmune-associated HLH | 9 (24.3) | 1 (4.3) | 0.073 |
| Uncertain cause HLH | 5 (13.5) | 3 (13.0) | >0.050 |
| EBV | 6/32 (18.8) | 5/22 (22.7) | 0.743 |
| Fever | 37 (100) | 23 (100) | - |
| Splenomegaly | 27 (73.0) | 21 (91.3) | 0.107 |
| Hepatomegaly | 25 (67.6) | 13 (56.5) | 0.421 |
| Neurologic symptom or sign | 4 (10.8) | 4 (17.4) | 0.468 |
| Rash | 13 (35.1) | 5 (21.7) | 0.387 |
| Hemoglobin (g/L) | 99 (51–157) | 86 (64–116) | 0.006 |
| Neutrophil count (×109/L) | 0.9 (0.13–14.1) | 1 (0.06–10.2) | 0.638 |
| Platelet count (×109/L) | 67 (25–384) | 51 (15–117) | 0.030 |
| Triglyceride (mg/dL) | 228 (47–742) | 206 (48–347) | 0.335 |
| Fibrinogen (g/L) | 1.48 (0.70–5.00)a) | 1.40 (0.45–6.18) | 0.893 |
| Ferritin (μg/L) | 3,200 (528–204,887) | 2,935 (185–57,186) | 0.850 |
| sCD25 (U/mL) | 4,285 (825–10,013)b) | 17,647 (1,139–27,060)c) | 0.142 |
| Hemophagocytosis | 33 (89.2) | 23 (100) | 0.288 |
| AST (U/L) | 307 (11–5,137) | 285 (22–4,829) | 0.238 |
| ALT (U/L) | 178 (8–2,019) | 120 (14–1,043) | 0.110 |
| LDH (U/L) | 1,749 (262–5,861)d) | 1,164 (437–15,062)e) | 0.110 |
| Total bilirubin (mg/dL) | 1.0 (0.3–11.8) | 1.2 (0.1–8.2) | 0.171 |
| Direct bilirubin (mg/dL) | 0.6 (0.1–8.8) | 1.4 (0–6.2)f) | 0.710 |
| PT (sec) | 12.9 (11.0–22.3)a) | 13.8 (12.9–16.5) | 0.229 |
| INR | 1.17 (0.99–2.07)a) | 1.27 (0.93–2.85) | 0.368 |
| aPTT (sec) | 40.1 (26.0–79.6)a) | 38.6 (21.6–200.0) | 0.681 |
| HLH-2004/94 treatment | 21 (56.8) | 7 (30.4) | 0.064 |
Values are presented as number only, number (%), or median (range).
HLH, hemophagocytic lymphohistiocytosis; EBV, Epstein–Barr virus; sCD25, soluble CD25; AST, aspartate transaminase; ALT, alanine transaminase; LDH, lactate dehydrogenase; PT, prothrombin time; INR, international normalized ratio; aPTT, activated partial thromboplastin time.
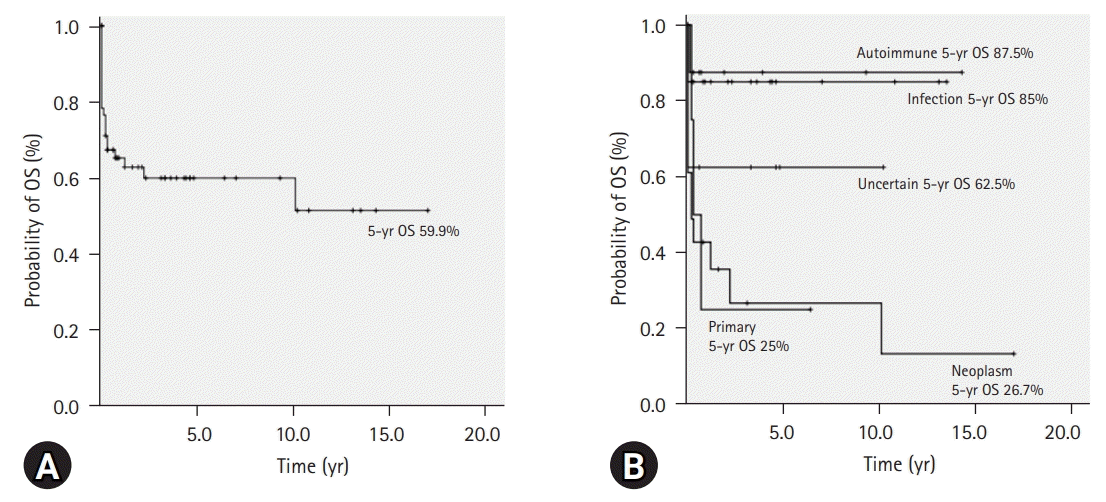
5. Survival of HLH patients
 | Fig. 3.(A) In all patients with hemophagocytic lymphohistiocytosis (HLH) (N=60), the 5-year overall survival (OS) rate is 59.9% (95% CI, 46.6–73.2). (B) The 5-year OS according to the classification of HLH. |


 PDF
PDF Citation
 Print
Print


 XML Download