Abstract
Background
Methods
Results
References
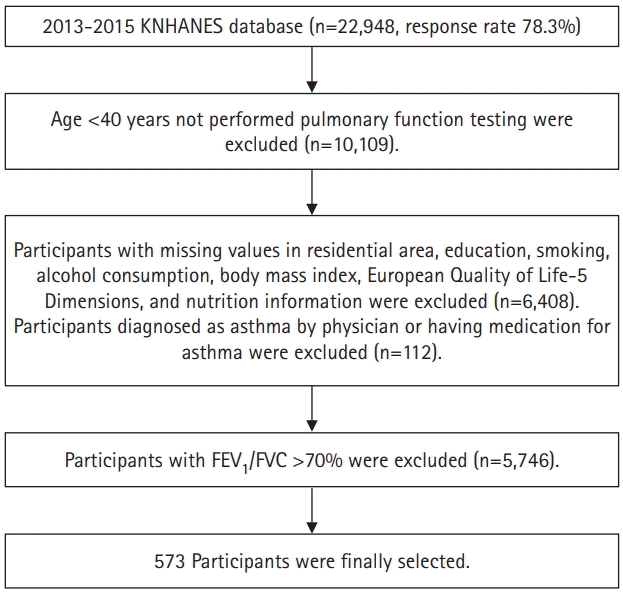
Fig. 1.

Table 1.
| Characteristic | Total |
|---|---|
| Age (yr) | 57.7±0.5 |
| Man (%) | 63.6±2.2 |
| Residential area (%) | |
| Urban | 78.3±2.4 |
| Rural | 21.7±2.4 |
| Education | |
| Middle school or less | 40.8±2.3 |
| High school | 37.7±2.2 |
| College or more | 21.6±1.9 |
| Smoking status | |
| Current | 31.1±2.3 |
| Former | 30.7±2.3 |
| Never | 38.1±2.3 |
| Heavy alcohol consumption (/wk)a) | |
| <1 | 64.8±2.2 |
| ≥1 | 35.2±2.2 |
| Body mass index (kg/m2, %) | |
| <18.5 | 2.2±0.7 |
| 18.5−22.9 | 39.5±2.4 |
| 23−24.9 | 27.0±2.2 |
| ≥25.0 | 31.2±2.2 |
| Spirometric value | |
| FEV1 (L) | 2.3±0.0 |
| FEV1%, predicted | 75.5±0.7 |
| FVC (L) | 3.7±0.0 |
| FVC%, predicted | 92.1±0.7 |
| FEV1/FVC% | 62.9±0.4 |
| PEF (L) | 6.0±0.1 |
Table 2.
Intake amount of total, N3, and N6 PUFA was log-transformed, because of left-skewed distribution. Model 1 was adjusted for age and sex; model 2 was additionally adjusted for body mass index, smoking status, and alcohol consumption; and model 3 was additionally adjusted for residence, education, and total calorie intake.
PUFA, polyunsaturated fatty acid; FEV1, forced expiratory volume in 1 second; FVC, forced vital capacity; PEF, peak expiratory flow; SE, standard error; N3, omega-3; N6, omega-6.
Table 3.
Comparison of estimated PUFA intake and p-value for trend was measured using multivariable linear regression analysis considering G1, G2, and G3 as continuous variables. Model 1 was adjusted for age and sex; model 2 was additionally adjusted for body mass index, smoking status, and alcohol consumption; and model 3 was additionally adjusted for residence, education, total calorie intake, and predicted FEV1%.
PUFA, polyunsaturated fatty acid; COPD, chronic obstructive pulmonary disease; G1, no problem; G2, some problems; G3, severe problems; N3, omega-3; N6, omega-6; FEV1, forced expiratory volume in 1 second.
Estimated prevalence of subjects and amount of PUFA intake according to degree of health-related problems are presented as a) percentage±standard error and b) estimated amount of intake±standard error, respectively.
Table 4.
Multivariable linear regression analyses were performed after log-transforming the value of total, N3, and N6 PUFA because of its left-skewed distribution. HRQoL was measured using European Quality of Life-5 Dimensions. Model 1 was adjusted for age and sex; model 2 was additionally adjusted for body mass index, smoking status, and alcohol consumption; and model 3 was additionally adjusted for residence, education, total calorie intake, and predicted FEV1%.
PUFA, polyunsaturated fatty acid; HRQoL, health-related quality of life; COPD, chronic obstructive pulmonary disease; N3, omega-3; N6, omega-6; SE, standard error; FEV1, forced expiratory volume in 1 second.
Table 5.
Multivariable linear regression analyses were performed after log-transforming the value of total, N3, and N6 PUFA because of its left-skewed distribution. HRQoL was measured using European Quality of Life-5 Dimensions. Model 1 was adjusted for age and sex; model 2 was additionally adjusted for body mass index, smoking status, and alcohol consumption; and model 3 was additionally adjusted for residence, education, total calorie intake, and predicted FEV1%.
PUFA, polyunsaturated fatty acid; HRQoL, health-related quality of life; COPD, chronic obstructive pulmonary disease; N3, omega-3; N6, omega-6; SE, standard error; FEV1, forced expiratory volume in 1 second.


 PDF
PDF Citation
 Print
Print


 XML Download