Abstract
Background
Body fats, especially both of abdominal fat pad mass and skeletal muscle fat content, are inversely related to insulin action. Therefore, methods for decreasing visceral fat mass and muscle triglyceride content may be helpful for the prevention of insulin resistance.
Methods
Thalidomide, used for its anti-angiogenic and anti-inflammatory properties, was administered to rats for 4 weeks. A 10% solution of thalidomide in dimethyl sulfoxide was injected daily into the peritoneal cavity as much as 100 mg/kg of body weight.
Results
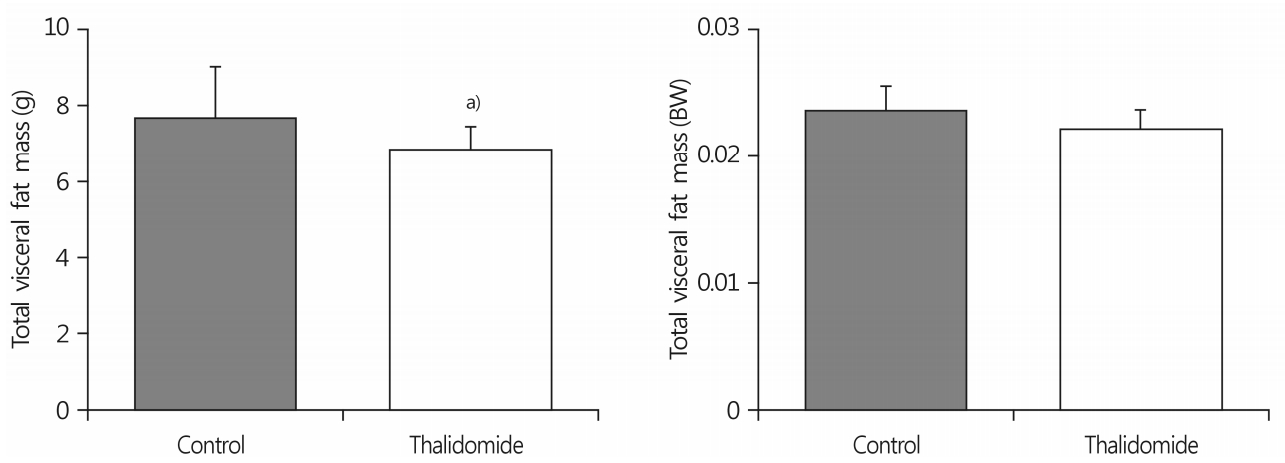
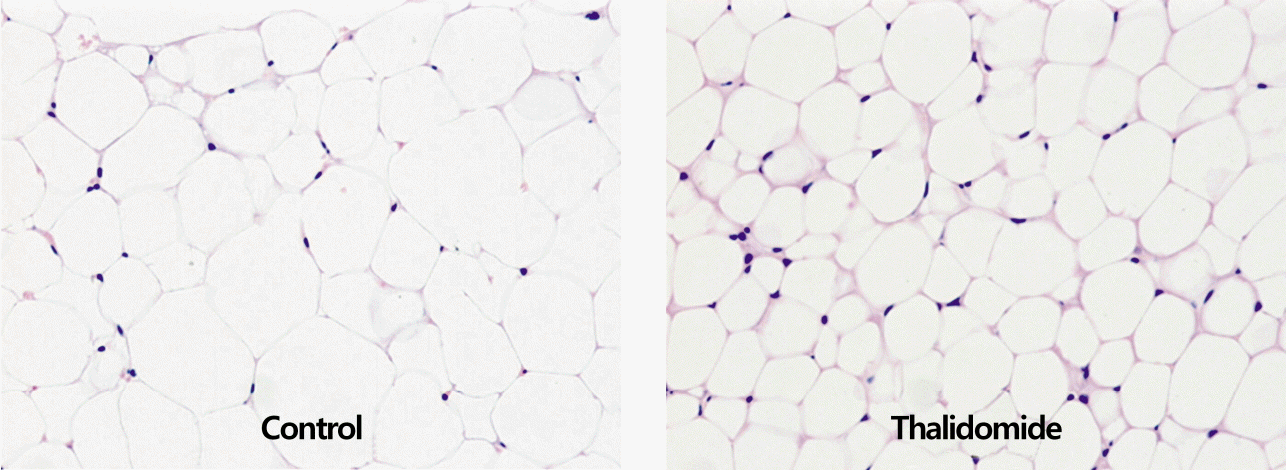
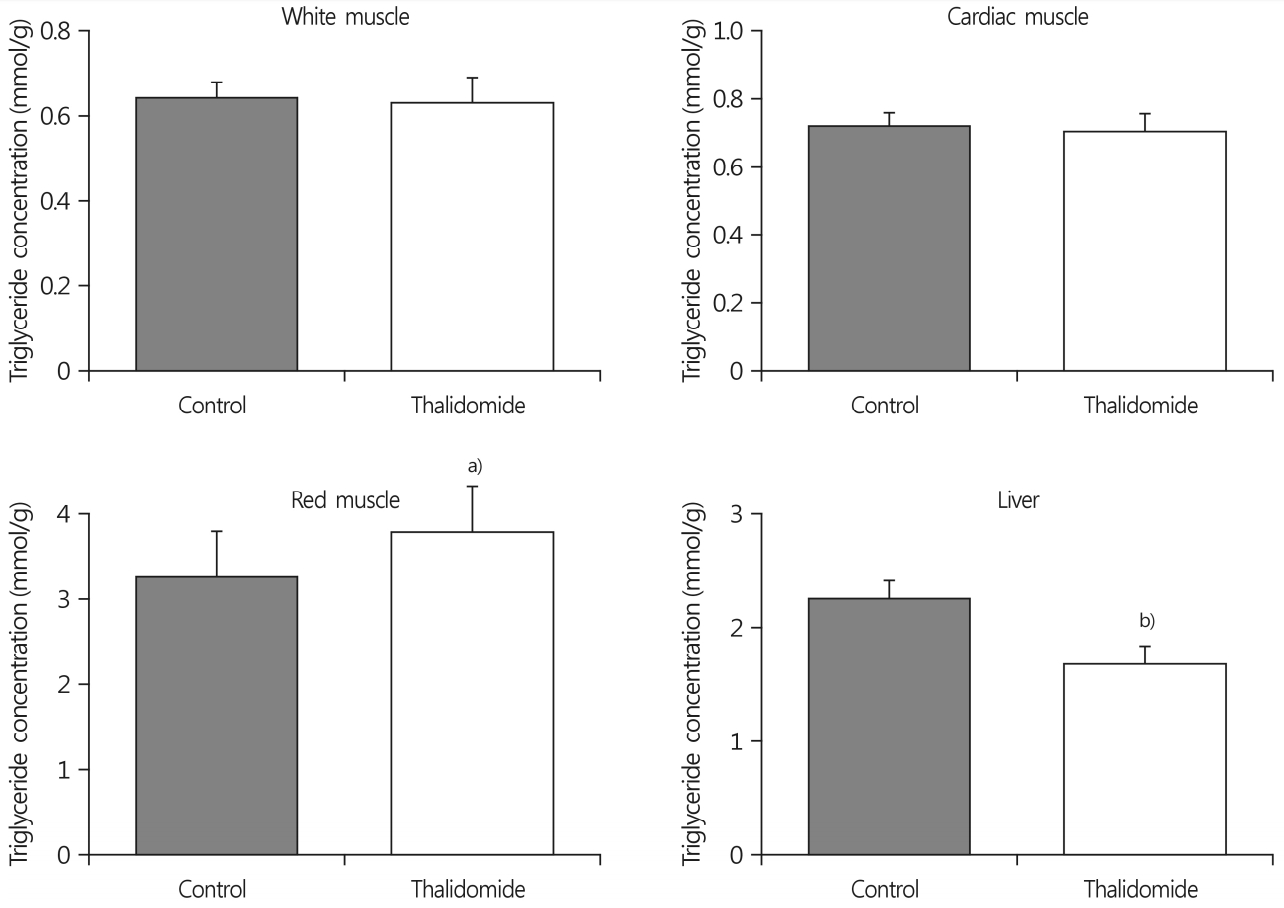
The total visceral fat pad mass in the thalidomide-treated group was 11% lower than in the control group. The size of adipocytes of the epididymal fat pad mass in the thalidomide-treated group was smaller than in the control group. The intraperitoneal thalidomide treatment increased triglyceride concentrations by 16% in the red muscle, but not in the white muscle.
Go to : 
Obesity, a medical condition wherein excess body fat has accumulated, can now be considered a global epidemic. Body fats, especially both of abdominal fat pad mass and the fat content of the skeletal muscle, are inversely related to insulin action, and directly related to the insulin resistance of peripheral tissues [1-4]. Therefore, the development of methods to decrease the fat content of the abdomen and the skeletal muscle will be helpful for the prevention of insulin resistance. Thalidomide is an immunomodulatory agent and was used to treat morning sickness during pregnancy in the 1950s and the early 1960s. However, it was found to cause severe birth defects, such as phocomelia. Despite this history, thalidomide has proven effective for the treatment of some diseases. At present, many decades later, thalidomide has been used for the treatment of multiple myeloma and erythema nodosum leprosum. Thalidomide has been reported to inhibit angiogenesis [5,6], suggesting that it may exert beneficial effects on the inhibition of visceral adipose tissue growth caused by anti-angiogenetic activity.
To the best of our knowledge, the effect of thalidomide on visceral fat and the triglyceride concentration in skeletal muscle, which are inversely related to insulin action, has not been examined. The objective of this study was to investigate if thalidomide altered the visceral fat pad mass and the triglyceride concentration in the skeletal muscle by inducing a decrease in angiogenesis in the visceral fat mass.
Go to : 
The experiments were designed to evaluate the effects of thalidomide on the visceral fat pad mass and the concentration of triglyceride in the skeletal muscle of rats. Rats were divided into control and thalidomide-treated groups.
Four-week-old male Sprague-Dawley rats (weight: 130-6 g) were purchased from the Koatech Experimental Animal Center (Pyeongtaek, Korea) and administered a rodent diet (Teklad Rodent Diet no. 2018S, Envigo, WI, USA) for 4 weeks. The animals were maintained in an environment of 22±2℃, 55±5% humidity, and a 12 h/12 h light-dark cycle. All applicable institutional and governmental regulations concerning the ethical use of animals were certified before and during this research and approved by the Institutional Animal Care and Use Committee of Yeungnam University (YUMC-AEC 2017-004).
Thalidomide, used as an anti-angiogenic agent, was administered to rats for 4 weeks. A 10% solution of thalidomide in dimethyl sulfoxide (DMSO) solution was injected daily into the peritoneal cavity of rats (n=6) as much as 100mg/kg of body weight. The control rats (n=6) were administered 10% DMSO solution without thalidomide.
The rats were anesthetized by the intraperitoneal injection of urethane (50mg/kg body weight) and blood samples were collected from the abdominal aorta after overnight fasting following administration of the study diet for 4 weeks. The epididymal, mesenteric, and retroperitoneal fats, liver, heart, and skeletal muscles were removed and weighed. The white muscle was separated from the gastrocnemius muscle.
Plasma glucose concentrations were determined by the glucose oxidase method using a kit from Sigma Chemical (USA). The plasma free fatty acid and triglyceride concentrations were measured by using a kit obtained from Waco Chemicals (Richmond, VA, USA). The muscle triglyceride concentration was determined through the extraction of the total lipids from clamp-frozen muscle samples with chloroform-methanol (2:1 vol/vol), as described by Folch et al. [7], separation of the chloroform and methanol-water phases, removal of the phospholipids, and further processing of the sample by using Frayn and Maycock’s modification [8] of the Denton and Randle method [9]. Triglycerides were then quantified spectrophotometrically as glycerol using an enzymatic assay kit (Waco Chemicals, Richmond, VA, USA).
All values were expressed as the mean±SE. The significance of differences between groups was evaluated using a Student’s t-test.
Go to : 
The body weight of all rats gradually increased with rats in the control group gaining 189±5.9 g and rats in the thalidomide-treated group gaining 177±8.5 g. The mass of food ingested by rats in the control group was higher than that in the thalidomide-treated group (44.8±1.3 g/day in the control group vs. 41.7±0.9 g/day in the thalidomide-treated group; p<0.05) (Table 1).
The plasma glucose concentrations were not different in either group (4.02±1.64mmol/L for the control group vs. 4.04±1.81mmol/L for the thalidomide-treated group). The plasma free fatty acid concentration in each group was not different (0.40±0.06 μmol/L for the control group vs. 0.42±0.11 μmol/L for the thalidomide-treated group). The plasma triglyceride concentration in the thalidomide-treated group was lower than that in the control group (0.53±0.14 μmol/L for the control group vs. 0.41±0.13 μmol/L for the thalidomide-treated group; p<0.05) (Table 2).
The total abdominal fat pad mass in the thalidomide-treated group was 11% lower than in the control group (7.6±1.4 g for the control group vs. 6.8±0.6 g for the thalidomidetreated group; p<0.05). However, there was no significant difference in the ratio of total abdominal fat pad mass to body weight in each group (Fig. 1). Thalidomide treatment decreased the size of adipocytes of the epididymal fat pad mass relative to the size in the control group (Fig. 2).
The triglyceride concentrations in white and red skeletal muscles were measured. The intraperitoneal thalidomide treatment increased triglyceride concentrations by 16% in the red muscle relative to the control group (3.24±0.52mmol/g wet weight for the control group vs. 3.75±0.53mmol/g wet weight for the thalidomide-treated group; p<0.05), but not in the white and cardiac muscle. In contrast, thalidomide treatment decreased the triglyceride concentration in the liver (2.25±0.13mmol/g wet weight for the control group vs. 1.67±0.15mmol/g wet weight for the thalidomide-treated group; p<0.01) (Fig. 3).
Go to : 
This study assessed whether thalidomide altered the visceral fat pad mass and the triglyceride concentration in the skeletal muscle. We measured body weight and food consumption, and analyzed plasma chemicals, visceral fat mass, and the triglyceride concentration in peripheral tissues. Our results showed that thalidomide did not significantly alter body weight despite leading to a decrease in food consumption. Some previous studies have reported that thalidomide did not alter the body weight and food consumption of dogs [10] and prevent body weight loss in human immunodeficiency virus and cancer patients [11]. Thalidomide did not affect the concentration of plasma glucose or free fatty acids, but decreased plasma triglyceride concentration. The result that thalidomide decreased plasma triglyceride concentration was unexpected, as plasma triglyceride concentration is influenced by diet and hepatic activity. Therefore, the decreased plasma triglyceride concentration may result, in part, from decreased food intake rather than decreased hepatic production in this study. We focused on the effects of thalidomide on the visceral fat pad mass and the triglyceride concentration in skeletal muscles because these factors are related to insulin resistance. Our hypothesis was that thalidomide, as an anti-anigiogenic agent, inhibited angiogenesis in the visceral adipose tissue, which subsequently impeded adipose tissue growth. The results showed that thalidomide decreased the visceral fat pad mass and reduced the size of adipocytes. This suggested that thalidomide may not alter preadipocyte differentiation and adipose tissue hyperplasia, as judged from the decreased visceral fat pad mass and the smaller size of the adipocytes. Adipose tissue growth involves an increase in adipocyte size and the formation of new adipocytes from precursor cells. Adipose tissue exerts angiogenic activity, and adipose tissue mass can actually be regulated through the vasculature [12]. Various factors affect adipose tissue vasculature in both of positive or negative ways. The inhibition of angiogenesis by vascular endothelial growth factor receptor-2 (VEGFR-2) blocking antibody not only reduced angiogenesis and tissue growth, but also inhibited preadipocyte differentiation [13]. This report suggested that thalidomide may reduce adipose tissue growth with reduced angiogenesis and inhibited preadipocyte differentiation, similar to a VEGFR-2 blocking antibody. In a recent report [14], thalidomide administration to high-fat diet-fed mice reduced visceral fat pad mass and adipocyte size. These results appear to agree with ours, although the dose of thalidomide and the treatment duration were different. The mechanism of the reduction of the visceral fat pad mass and of the adipocyte size in thalidomide-treated high-fat diet-fed mice may result from the immunosuppressive action of thalidomide [14]. The accumulation of intramyocellular lipid triglycerides is an important aspect of the insulin resistance of skeletal muscle in obesity and type 2 diabetes mellitus [15]. Skeletal muscle cells contain a considerable amount of triglycerides. The amount of stored triglycerides depends on the muscle fiber type and may be influenced by visceral adiposity [16,17]. In our results, thalidomide increased triglyceride concentration in the red muscle, but not in the white and cardiac muscles. In contrast, thalidomide decreased triglyceride concentration in the liver. The triglyceride concentration in red muscle is approximately five times higher than that in white and cardiac muscles. Red muscle fibers are smaller than white muscle fibers, and rich in mitochondria, myoglobin, and blood supply, whereas white muscles have a low concentration of mitochondria, myoglobin, and blood supply [18]. These results implied that red muscle may be a more important reservoir and route for metabolism of lipids than white muscle because of its high oxidative capacity. In conclusion, our results suggested that intraperitoneal thalidomide treatment inhibited visceral fat accumulation and, subsequently, that free fatty acids in the blood preferentially accumulated in the red skeletal muscle.
Go to : 
ACKNOWLEDGMENTS
This work was carried out with the support of the “Cooperative Research Program for Agriculture Science & Technology Development (Project No. PJ01241101)” of the Rural Development Administration, Republic of Korea.
Go to : 
REFERENCES
1. Kim JY, Nolte LA, Hansen PA, Han DH, Ferguson K, Thompson PA, et al. High-fat diet-induced muscle insulin resistance: relationship to visceral fat mass. Am J Physiol Regul Integr Comp Physiol. 2000; 279:R2057–65.

2. Kim JY, Nolte LA, Hansen PA, Han DH, Kawanaka K, Holloszy JO. Insulin resistance of muscle glucose transport in male and female rats fed a high-sucrose diet. Am J Physiol. 1999; 276:R665–72.
3. Jacob S, Machann J, Rett K, Brechtel K, Volk A, Renn W, et al. Association of increased intramyocellular lipid content with insulin resistance in lean nondiabetic offspring of type 2 diabetic subjects. Diabetes. 1999; 48:1113–9.

4. Krssak M, Falk Petersen K, Dresner A, DiPietro L, Vogel SM, Rothman DL, et al. Intramyocellular lipid concentrations are correlated with insulin sensitivity in humans: a 1H NMR spectroscopy study. Diabetologia. 1999; 42:113–6.

5. D'Amato RJ, Loughnan MS, Flynn E, Folkman J. Thalidomide is an inhibitor of angiogenesis. Proc Natl Acad Sci U S A. 1994; 91:4082–5.
6. Yabu T, Tomimoto H, Taguchi Y, Yamaoka S, Igarashi Y, Okazaki T. Thalidomide-induced antiangiogenic action is mediated by ceramide through depletion of VEGF receptors, and is antagonized by sphingosine-1-phosphate. Blood. 2005; 106:125–34.

7. Folch J, Lees M, Sloane-Stanley GH. A simple method for the isolation and purification of total lipides from animal tissues. J Biol Chem. 1957; 226:497–509.

8. Frayn KN, Maycock PF. Skeletal muscle triacylglycerol in the rat: methods for sampling and measurement, and studies of biological variability. J Lipid Res. 1980; 21:139–44.

9. Denton RM, Randle PJ. Concentrations of glycerides and phospholipids in rat heart and gastrocnemius muscles. Effects of alloxan-diabetes and perfusion. Biochem J. 1967; 104:416–22.

10. Teo SK, Evans MG, Brockman MJ, Ehrhart J, Morgan JM, Stirling DI, et al. Safety profile of thalidomide after 53 weeks of oral administration in beagle dogs. Toxicol Sci. 2001; 59:160–8.

11. Haslett P, Hempstead M, Seidman C, Diakun J, Vasquez D, Freedman VH, et al. The metabolic and immunologic effects of short-term thalidomide treatment of patients infected with the human immunodeficiency virus. AIDS Res Hum Retroviruses. 1997; 13:1047–54.

12. Rupnick MA, Panigrahy D, Zhang CY, Dallabrida SM, Lowell BB, Langer R, et al. Adipose tissue mass can be regulated through the vasculature. Proc Natl Acad Sci U S A. 2002; 99:10730–5.

13. Fukumura D, Ushiyama A, Duda DG, Xu L, Tam J, Krishna V, et al. Paracrine regulation of angiogenesis and adipocyte differentiation during in vivo adipogenesis. Circ Res. 2003; 93:e88–97.

14. Nakamitsu PZ, Compri CM, de Fraia Pinto L, Gotardo ÉM, de Oliveira CC, Ribeiro ML, et al. Thalidomide controls adipose tissue inflammation associated with high-fat diet-induced obesity in mice. Endocr Metab Immune Disord Drug Targets. 2015; 15:151–8.
15. Kelley DE, Goodpaster BH, Storlien L. Muscle triglyceride and insulin resistance. Annu Rev Nutr. 2002; 22:325–46.
16. Hua N, Takahashi H, Yee GM, Kitajima Y, Katagiri S, Kojima M, et al. Influence of muscle fiber type composition on early fat accumulation under high-fat diet challenge. PLoS One. 2017; 12:e0182430.

17. Korach-André M, Gao J, Gounarides JS, Deacon R, Islam A, Laurent D, et al. Relationship between visceral adiposity and intramyocellular lipid content in two rat models of insulin resistance. Am J Physiol Endocrinol Metab. 2005; 288:E106–16.

18. Hall JE. Guyton and Hall textbook of medical physiology. 13th ed. Philadelphia: Elsevier;2016. p. 84.
Go to : 


 PDF
PDF Citation
 Print
Print


 XML Download