

 PDF
PDF Citation
 Print
Print


INTRODUCTION
Preterm birth rates have increased significantly in recent decades worldwide. Similarly, the rate of preterm birth in Korea has also increased from 5.9% in 2011 to 8.0% in 2019.1 Advances in medical practice for neonatal care, such as antenatal steroid administration and surfactant replacement therapy, have led to a significant improvement in the survival rate of premature babies.2 According to the Korean Neonatal Network data, the survival rate of very low birth weight infants in Korea when they were discharged from the neonatal intensive care unit (NICU) was 86.5% in 2019.3 Paradoxically, the improvement in the survival rate of preterm infants raises concerns about increased morbidities in childhood. Surviving preterm infants are at increased risk for poor growth, chronic lung disease, cerebral palsy, and visual and hearing impairment.456 Moderate to late preterm children (32–36 weeks’ gestation), even if they have no major morbidities, present higher rates of cognitive and behavioral difficulties than their peers born at term.78 These disabilities lead to increased long-term medical utilization and costs, which can impose a burden on social, health, and education services of the community and families of preterm infants.910 It is reported that unpaid leave from work, increased debt, and financial worry that occurs while caring for children born preterm worsen the quality of life of the family.11 To improve prevention and treatment interventions, analyzing the socioeconomic impacts of preterm births is required. Despite the importance of identifying the long-term socioeconomic consequences of this condition, there are few related studies in Korea.
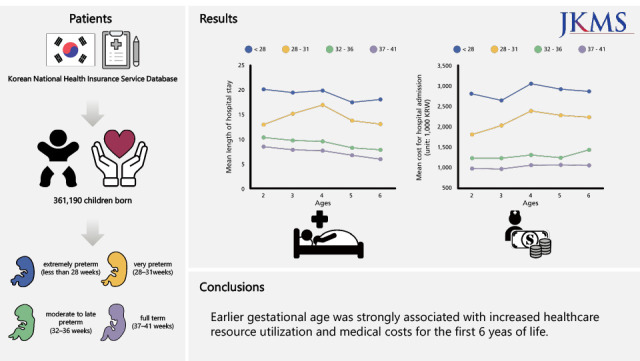
To address this lack of information, we used the population-based data of the National Health Insurance Service (NHIS) in Korea to analyze the healthcare resource utilization and medical costs of children born preterm during their first 6 years of life.
METHODS
This study was approved by the Institutional Review Board of the National Health Insurance Service Ilsan Hospital (approval no. NHIMC-2021-05-009).
Data sources
This study used data from the National Health Information Database (2011–2017) provided by the NHIS. The NHIS is a single insurer covering the entire Korean population requiring the enrollment of all Korean residents.12 Approximately 97.1% of the total population is covered by the health insurance system, and 2.9% of the population is covered by medical aid that had been implemented for the low-income group and persons of national merit.13 Because NHIS pays treatment costs to healthcare providers mainly based on the fee-for-service system, the NHIS database includes information on diagnosis, operation and procedures code, date of visit, type of visit, medical cost, and sociodemographic data, such as sex, age, residential area, level of income, and insurance type.1214 The link between children and their mother was identified through the medical insurance card number issued for the family. The diagnostic codes in the claim's date are encoded according to the 6th Korean Standard Classification of Disease (KCD-6), which is a modified version for the Korean situation of the International Classification of Disease, 10th Revision (ICD-10). We also used the data of the NHIS-Infants and Children’s Health Screening (2011–2017), which is a checkup program of growth and development conducted by pediatricians seven times until the age of 6 years.
Study population
A birth cohort of all children born during 2011 (January 1–December 31) and covered by the health insurance system were eligible. Only children who survived after the neonatal period for the first 6 years following discharge from the NICU or nursery and linked with the mother’s information were included. Children with missing data on mothers’ information, income level, birth weight, or date of birth were excluded. We excluded post-term infants (more than 42 weeks, KCD P08.2) and infants with unclear gestational age (KCD P03.39). Children with congenital malformations, deformations, or chromosomal abnormalities were excluded (KCD Q00-Q99). We divided the children into four groups according to their gestational age using the KCD-6 codes: extremely preterm (less than 28 weeks, KCD P07.20-29), very preterm (28–31 weeks, KCD P07.30), moderate to late preterm (32–36 weeks, KCD P07.31), and full term (37–41 weeks).
Study variables
We collected information on sex, plurality (singleton or multiple births), income level, and residential area from the eligibility database of children and their mothers. Since there is no standard criteria for the classification of income level, income level was divided into three groups: low income (medical aid, and 1st to 4th deciles), middle income (5th to 6th deciles), and high income (7th to 10th deciles). The residential area was divided into three groups: Seoul, metropolitan cities, and other areas. The birth weight was obtained from parent-reported questionnaires from the NHIS-Infants and Children’s Health Screening (2011–2017). Mortality, outpatient visits, hospital admissions, admission to intensive care units (ICUs), and medical costs up to 6 years were also collected from the children’s claims database. Medical costs were measured as the sum of the payments made by the insurer and patients. Maternal age at birth, delivery methods, and complications related to pregnancy such as preeclampsia, gestational diabetes mellitus, preterm labor, and fetal distress were collected from the mother’s claims database.
We compared the mean cumulative number of outpatient visits, the mean cumulative length of hospital days, the rate of hospital or ICU admission more than once, and the mean cumulative cost of outpatient visits or hospital admission for 6 years after discharged from NICU by gestational age groups. We analyzed the year-by-year change by dividing each variable into 1-year units based on the date of birth. The mean number and cost of outpatient visits were averaged over all children included in this study. The mean length of hospital stay and cost of hospital admission were averaged over children who had a history of at least one hospital admission during the 6 years after discharge from NICU. The mean length of hospital stay and cost of hospital admission at each age was divided by the number of children hospitalized more than once at each age.
Statistical analyses
Statistical analyses were performed using SAS 9.4 version (SAS Institute, Cary, NC, USA). Statistical significance was set at P < 0.05. The association between gestational age and various medical outcomes was analyzed using multiple linear regression, Poisson regression, and multiple logistic regression.
RESULTS
Of the 467,185 children born in 2011 registered in the database of the NHIS, we excluded 105,995 children due to missing birth weight (21.7%) or gestational age (1.4%); gestational age of more than 41 weeks (0.3%); children who died before the age of 6 years (0.2%); children with congenital malformations, deformations, or chromosomal abnormalities (0.1%); and inaccurate mother’s information (54.2%) or family income information (18.7%). The 6-year survival rate after birth was lowest in the extremely preterm group (84.1%) and proportionally increased with gestational age (96.5% in very preterm, 99.3% in moderate to late preterm, and 99.5% in full-term). After exclusion, we analyzed a total of 361,190 children and their mothers, including 442 children born before 28 weeks (extremely preterm), 1,373 born between 28–31 weeks (very preterm), 8,191 born between 32–36 weeks (moderate to late preterm), and 351,184 born between 37–41 weeks of gestation (full term).
Table 1 presents the maternal and infant characteristics according to gestational age. Preterm children were more likely to be born to mothers with a complicated pregnancy, multiple births, cesarean section, or born small for gestational age. The income level and residential area showed similar distributions across the gestational age group.
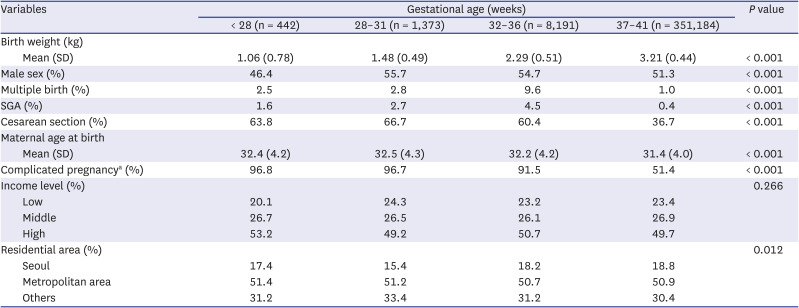
Table 1
Birth data and demographic characteristics of the infants born in 2011
SD = standard deviation, SGA = small for gestation age.
aComplicated pregnancy included preeclampsia, gestational diabetes, disorders of amniotic fluid, placental disorder, preterm labor, fetal stress, and maternal infection.
![]()
Resource utilization following NICU discharge to 6 years of age
Earlier gestational age was significantly associated with an increasing mean cumulative number of outpatient visits for 6 years after discharge from the NICU (Table 2). After adjustment for delivery mode, sex, small for gestational age, multiple births, maternal age at birth, complicated pregnancy, economic status, and residential area, these associations remained significant (P < 0.001). After 2 years of age, the mean number of outpatient visits decreased each year; however, the gap between the gestational age groups remained over 6 years (Fig. 1A, P < 0.001). The mean number of outpatient visits during the first year was less than that during the second year, which was presumably because the period of NICU admission was included in the first year. The mean cumulative length of hospital stay during admission over 6 years significantly increased with decreasing gestational age (Table 2, Fig. 1B, P < 0.001). An inverse relationship was observed between the rates of hospital admission more than once and gestational age over 6 years (Table 3). After adjustment for covariates, children who were born at an earlier gestational age showed higher relative risks compared to children born full term (Relative risk: extremely preterm, 1.26; very preterm, 1.25; moderate to late preterm, 1.08; and full term, 1.00; P < 0.001). The most common diagnosis for hospitalization was respiratory infections, such as bronchitis (KCD J20), bronchiolitis (KCD J21), and tonsillitis (KCD J03). The rates of hospital admission, when analyzed by each year for 6 years, consistently decreased with age across all gestational age groups (Fig. 1C, P < 0.001). However, a tendency for higher rates of hospitalization at an earlier gestational age was maintained for 6 years. Children born extremely preterm were 20.0 times more likely to be admitted to the ICU for more than once over 6 years than children born full term (Table 3), and the admission rates were highest until 2 years of age (Fig. 1D, P < 0.001). The rate of ICU admission was maintained significantly higher as gestational age decreased after adjustment for covariates (odds ratio: extremely preterm, 18.03; very preterm, 5.98; moderate to late preterm, 2.24; and full term, 1.00).
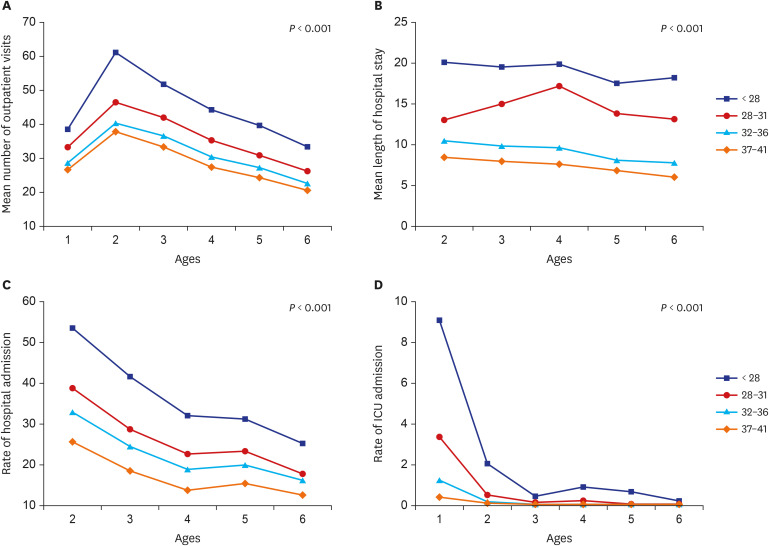
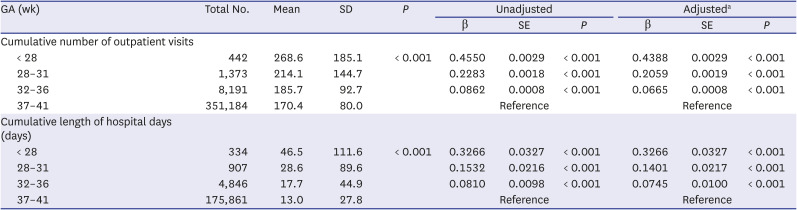
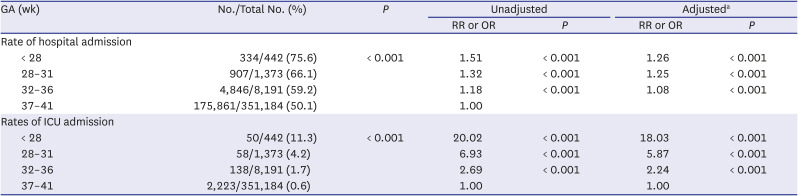
Fig. 1
Healthcare resource utilization by age (A) mean number of outpatient visits, (B) mean length of hospital stays, (C) rate of hospital admission, (D) rate of ICU admission.
ICU = intensive care unit.
![]()
Table 2
Healthcare resource utilization by gestational age over the first 6 years
GA = gestational age, SD = standard deviation, SE = standard error.
aAdjusted for delivery mode, sex, small for gestational age, multiple birth, maternal age at birth, complicated pregnancy, income level, and residential area.
![]()
Table 3
Risks for healthcare resource utilization over the first 6 years
GA = gestational age, RR = relative risk, OR = odds ratio.
aAdjusted for delivery mode, sex, small for gestational age, multiple birth, maternal age at birth, complicated pregnancy, income level, and residential area.
![]()
Medical Costs following NICU discharge to 6 years of age
The mean cumulative costs per child up to 6 years following NICU discharge are reported in Table 4. Both mean cumulative outpatient and hospital admission costs significantly increased with decreasing gestational age (P < 0.001). In the extremely preterm age group, there was greater variation in the distribution of outpatient visit costs during the second year of life and tended to decrease gradually until 6 years of age (Fig. 2A, P < 0.001). The mean cost for hospital admission at each age increased significantly with decreasing gestational age over the first 6 years of life (Fig. 2B, P < 0.001). The table and figures of the outpatient and hospital admission costs converted to US dollars from Korean Won (KRW) via mean exchange rate of 0.00088 are shown in Supplementary Table 1 and Supplementary Fig. 1. Although the mean medical costs per child were highest in children born extremely preterm, total outpatient visit medical costs for preterm children based on population size was estimated to be 4,188,920,689 KRW for extremely preterm births, 6,756,377,645 KRW for very preterm births, and 24,777,728,967 KRW for moderate to late preterm births. The total hospital admission cost based on preterm population size was estimated to be 2,313,079,291 KRW for extremely preterm, 3,746,304,037 KRW for very preterm, and 11,641,998,416 KRW for moderate to late preterm children. Moderate to late preterm children accounted for 68.2% of the total medical cost in preterm infants for the first 6 years of life amounting to 53,424,409,045 KRW. Moderate to late preterm children contribute substantially to the economic burden due to the relatively larger population size.
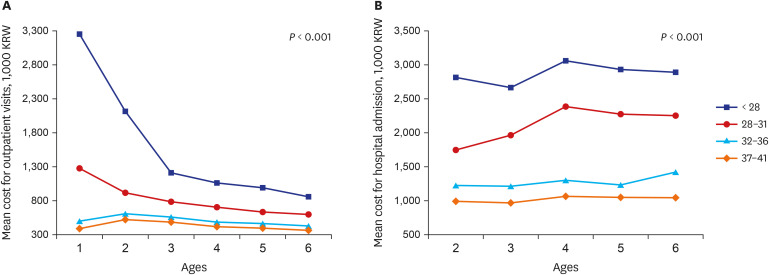
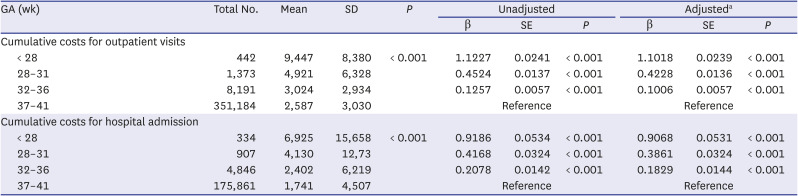
Fig. 2
Medical costs by age (A) mean cost for outpatient visit (unit: 1,000 KRW), (B) mean cost for hospital admission (unit: 1,000 KRW).
KRW = Korean won.
![]()
Table 4
Cumulative medical cost per child by gestational age over the first 6 years (unit: 1,000 KRW)
KRW = Korean won, GA = gestational age, SD = standard deviation, SE = standard error.
aAdjusted for delivery mode, sex, small for gestational age, multiple birth, maternal age at birth, complicated pregnancy, income level, and residential area.
![]()
DISCUSSION
This is the first nationwide population-based study in Korea to investigate the long-term healthcare resource utilization and economic outcomes of preterm infants. We showed an inverse relationship between healthcare resource utilization and medical costs to gestational age for the first 6 years of life. The total cumulative medical costs were highest for moderate to late preterm children, amounting to 68.2% for moderate to late preterm children for the first 6 years of life.
A previous study reported that the outpatient and inpatient medical costs for 4.5 years after NICU discharge per infant born preterm were 4,690,000 KRW and 28,580,000 KRW, respectively.15 However, there was a limitation in that the difference in medical costs by gestational age was not identified, and they did not perform a comparative analysis against children born full-term. In addition, these results may not reflect the total national costs, as they were obtained using the medical receipts submitted by parents to the public health centers. In our study, we analyzed healthcare resource utilization and costs by classifying them into four gestational age groups, including full-term children as control. Our findings revealed that healthcare resource utilization and medical costs were inversely related to gestational age for the first 6 years of life. These trends between the gestational age group remained after adjustment for delivery mode, sex, small for gestational age, multiple births, maternal age at birth, complicated pregnancy, economic status, and residential area.
We showed that earlier gestational age continued to increase the risk of outpatient visits, rate of hospital admissions including ICU admissions, and length of hospital stay for the first 6 years of life. A previous longitudinal study of preterm infants in the United Kingdom reported the ratio of having at least three hospital admissions at 9 months and 5 years.16 In both periods, they reported that the lower the gestational age, the higher was the rate of hospitalization, which is similar to the results of our study (Fig. 1C). Another population-based study also reported that the odds of hospitalization remained significantly increased with preterm birth at each year of age up to 6 years.17 Consistent with our study’s results, the most common diagnosis on admission was respiratory disorders. Bronchopulmonary dysplasia, which increases respiratory syncytial virus-related hospitalization by 2–7-fold, is a morbidity that occurs more frequently with lower gestational age because of lung immaturity and exposure to supplemental oxygen and mechanical ventilation.181920 As the survival rate of preterm infants increases, the proportion of children with neurodevelopmental and respiratory morbidity may increase further, which may increase the use of healthcare resource utilization in childhood. Strategies for prematurity care are needed to improve the outcomes of preterm infants.
The increase in healthcare resource utilization leads to an increased economic burden on the society and families of children born preterm. Although several studies have estimated the economic consequences of preterm birth, the method of grouping the included preterm infants’ gestational age, the age of follow-up, and the categories included in the costs are different for each study, so it is difficult to make an accurate comparison between studies.17212223 Stephens et al.17 reported that mean cumulative hospital costs displayed an increasing pattern with decreasing gestational age within the first 6 years of life, which is consistent with our results. Another study conducted in Canada reported that the total cost per infant over the first 10 years of life was estimated to be $67,467 for preterm infants born before 28 weeks, $54,554 for preterm infants born between 28−32 weeks, and $10,010 for preterm born between 33−36 weeks’ gestation.21 However, these total costs included initial hospital (NICU admission) costs, which constitute a significant portion. They used a decision model based on the analysis of a Canadian administrative data source to estimate the costs for preterm infants. In our study, medical costs actually spent in hospitals were analyzed based on insurance claims, and the full-term group was included for comparison. Unlike the rate of hospital admission, we found that the mean cumulative length of hospital days and cost for hospital admission per child did not decrease with age. It is assumed that children who need hospitalization even after growing up consistently require similar number of admission days and cost because of the severity of the disease.
Although the mean cumulative medical costs per child were highest for children born extremely preterm, when assessed based on population size, total cumulative medical costs were highest for moderate to late preterm children. The outcomes of children born moderate to late preterm were predicted to be similar to those of children born full term because the survival rate is higher and the short-term outcomes are favorable compared to children born extremely preterm. Therefore, most previously published studies analyzed outcomes of preterm birth focusing on extremely preterm infants.224 However, recently reported studies showed that children born moderate to late preterm are at risk of adverse outcomes compared to children born full term and morbidity impact extends to later periods in life, resulting in neurodevelopmental problems, learning difficulties, and social and behavioral problems.17252627 In our study, the number of outpatient visits, the rate of hospital admission including ICU, and the length of hospital stay are increased in children born moderate to late preterm compared to children born full term, consistently for the first 6 years of life. Moderate to late preterm births accounted for up to 81.8% of all preterm births in our analysis, which is consistent with the 87.6% reported by the Korean Statistical Information Service (KOSIS) in 2011.1 Due to the large population size of moderate to late preterm births, it can impose a substantial burden at the national level. These findings suggest that health promotion and regular monitoring of children born to moderate to late preterm infants are important.
The strength of this study is that it is the first, large, population-based cohort study using insurance claim data to analyze the long-term healthcare utilization and medical costs of preterm birth in Korea. Our data of 467,185 children in the NHIS database are reliable to represent actual KOSIS data of 471,265 births in 2011.1 In this study, we analyzed actual claims data that are demanded by hospitals instead of using constructed models to predict the medical utilization patterns of preterm infants. We investigated a wide range of gestations, including full-term comparisons, throughout early childhood. We studied the clear effects of gestational age on medical outcomes by adjusting for socioeconomic and maternal factors.
Our study has several limitations. We included only data on the medical costs covered by the NHIS to analyze the economic outcome of preterm birth in this study. Because a significant part of rehabilitation therapies such as speech and language therapy and cognitive behavioral therapy are not included in insurance benefits in Korea, there may be discrepancies between the results of this study and the actual medical costs paid by patients. Indirect costs, including education costs and loss of parents’ income to care for preterm children, should also be considered as an extended socio-economic burden. Our data are based on diagnostic codes and may differ from the actual results; there may be missing data if doctors did not enter or make claims. Since we classified the gestational age based on the diagnostic codes entered, missing claims were mostly predicted in the moderate to late preterm group. The number of outpatient visits was counted based on the payment history; therefore, the actual outpatient clinic visit numbers may have been different. Of the total study population, 22.7% of patients were excluded, of which 94.5% were excluded due to missing or inaccurate information about the mother, family, or birth weight. For future population-based research using data from the NHIS, it is necessary to supplement these missing or inaccurate data. There is a growing concern that surviving adults born preterm are affected by various chronic diseases compared with adults born full-term.928 Further large cohort studies with follow-up into adulthood are needed to ascertain long-term economic outcomes and provide information for budgeting of healthcare services up to adulthood.
In conclusion, earlier gestational age was strongly associated with increased healthcare resource utilization and medical costs up to early childhood. Although the number of births is decreasing, the rate of preterm births is rising, and the negative outcomes of preterm births impose a burden on society. Because the vulnerable moderate to late preterm infants account for the majority of preterm births, their medical costs and long-term adverse outcomes need to be recognized for health implications. Our findings on the potential long-term socioeconomic impact on public health are expected to aid the formation of future healthcare policies for preterm children.
 XML Download