

 PDF
PDF Citation
 Print
Print


INTRODUCTION
Short stature is one of the most common causes of referral to a pediatric endocrinologist. Growth hormone deficiency (GHD) is a rare cause of short stature.1 It is important to diagnose and treat GHD because earlier treatment with recombinant human growth hormone is highly effective for increasing the final adult height (Ht) or genetic target Ht.23 The Ht response can vary between individualized strategies for growth hormone (GH) replacement according to the initial chronological age, Ht, and severity of GHD.4 And several studies have shown that the growth response after 1 year of GH treatment is the most important predictor of a treatment’s success.356
GHD is classified as idiopathic and organic GHD. Organic GHD can be caused by congenital abnormalities of the hypothalamic–pituitary axis, such as pituitary agenesis or hypoplasia with/without genetic defects or can be acquired because of pituitary trauma, tumor, surgery, or intracranial irradiation.78 The peak GH levels to the GH-stimulation test and growth outcomes after GH treatment can differ between idiopathic and organic GHD. Milner et al.9 and Herber et al.10 demonstrated that patients with organic GHD show less response to GH treatment than those with idiopathic GHD and are more likely to be combined with other pituitary hormone deficiencies. They suggested that different protocols should be used for idiopathic and organic GHD to ensure successful responses to GH treatment in children and adolescents.
However, despite over 30 years of GH treatment to Korean children with short stature, the best predictors of a successful growth response remain unclear, and there are few data on whether the outcomes of GH treatment differ in Korean children with GHD according to causes of GHD and additional pituitary hormone deficiencies. The aim of this study was to identify differences in clinical outcomes and their predictors of the growth response during 3 years of GH treatment in children and adolescents with GHD, focusing on both idiopathic and organic GHD or both isolated GHD (IGHD) and multiple pituitary hormone deficiency (MPHD).
METHODS
Patients
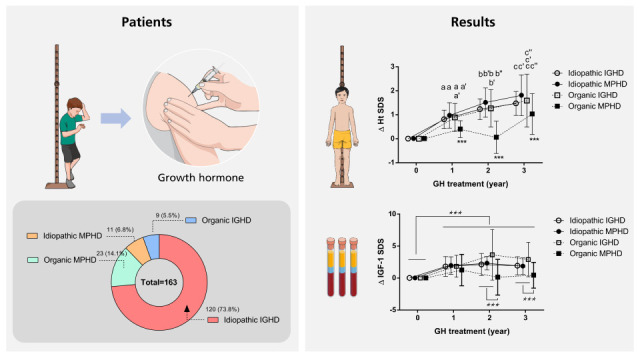
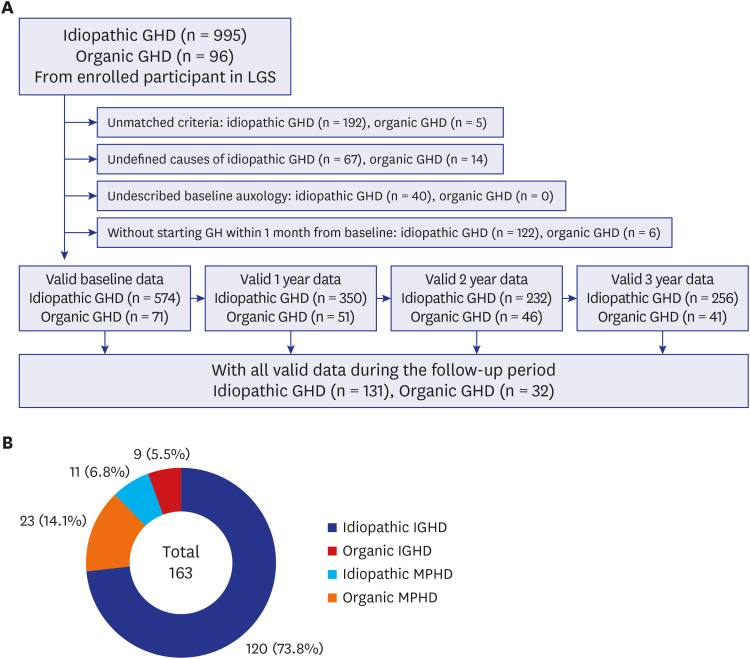
Clinical data for 1,091 participants aged 2–18 years who had been diagnosed with GHD and treated with GH between 2011 and 2018 contained in the LG Growth Study (LGS) were reviewed. The LGS is a multicenter, noninterventional, observational cohort study of Korean children and adolescents with GHD11 and was registered at ClinicalTrials.gov (identifier: NCT01604395). Excluded from the analyses were 446 patients who had unmatched GHD criteria, inappropriate auxological or biochemical data at the baseline, or did not start GH treatment within 1 month after GH diagnosis, and 482 patients who had missing data during the follow-up period. Finally, 163 patients with GHD (131 with idiopathic GHD and 32 with organic GHD; 100 boys and 63 girls) whose data for the 3 years of GH treatment were complete and valid were enrolled in the study (Fig. 1).
Fig. 1
Summary of participants. (A) Participants were selected as those with complete and valid data during the follow-up period from all participants enrolled in the LGS. (B) Participants were divided into four subgroups; idiopathic IGHD, idiopathic MPHD, organic IGHD, and organic MPHD.
LGS = LG Growth Study, GHD = growth hormone deficiency, IGHD = isolated growth hormone deficiency, MPHD = multiple pituitary hormone deficiency.
Definition of GHD
GHD was defined as a serum peak GH concentration < 10 ng/mL1213 on a combined GH-stimulation test with at least two different stimuli.1415 Idiopathic GHD was defined as short stature (less than third percentile) at the baseline, delayed bone age (BA), and no known causes such as those related to genetics, medications, previous chronic illness, low birth weight (Wt) for gestational age, trauma, or specific pathological findings in brain images. Organic GHD was defined as the presence of any congenital pituitary disorder, brain infection, head trauma, brain tumor, intracranial irradiation history, or other abnormal brain image findings. IGHD indicated the presence of GHD only without any additional pituitary hormone deficiencies. MPHD was defined as deficiency in ≥ 1 more pituitary hormone in addition to GHD, including thyroid stimulating hormone deficiency (TSHD), adrenocorticotropic hormone deficiency (ACTHD), hypogonadotropic hypogonadism (LH/FSHD), or central diabetes insipidus (CDI) based on the medication records contained in the LGS data.
Data collection
Baseline data were collected from the LGS register for chronologic age, sex, Ht, Wt, BA, pubertal status, parental Ht, GH response to the GH-stimulation test, insulin like growth factor-1 (IGF-1), insulin like growth factor-binding protein-3 (IGFBP-3), dosage of GH treatment, concomitant medications, and medical illness. Annual changes in the clinical variables (designated as Δ here) were obtained every 12 ± 1 months during the 3 years of GH therapy. The standard deviation score (SDS) values for Ht, Wt, body mass index (BMI), and mid-parental height (MPH) were calculated using the 2017 growth reference for Korean children and adolescents.16 BA and predicted adult height (PAH) was determined using the Greulich and Pyle atlas and Bayley–Pinneau method, respectively.17 All laboratory analyses were carried out according to local standard procedures of each enrolled institution, not central laboratory. Serum levels of IGF-1 and IGFBP-3 were converted to SDSs based on normative data for Korean population.18
Statistical analysis
All variables were presented as mean ± standard deviation (SD) for continuous variables. The changes in GH dose and GV were calculated by analysis of covariance with age, sex, and the presence of puberty onset. Significant differences between two groups according to other pituitary hormone deficiencies were identified using the χ2 test and analysis variance. The independent t-test or Wilcoxon rank-sum test was used to compare the auxological and biochemical data between the idiopathic and organic GHD groups. Tukey’s multiple-comparison test was used to compare the mean ± SD between the four subgroups: idiopathic IGHD, idiopathic MPHD, organic IGHD, and organic MPHD. Multivariate linear regression with variance inflation factor was used to identify the baseline parameters associated with the changes in the 3-year growth response (ΔHt SDS and ΔGV). To avoid bias of duplication, variance inflation factors over 10 were excluded. The different lowercase on each bar indicate significant differences between subgroups. P values < 0.05 were considered to be significant. All statistical analyses were performed using SAS software (version 9.4; SAS Institute, Cary, NC, USA).
RESULTS
Baseline auxological and biochemical characteristics
Among total 131 idiopathic GHD patients and 32 organic GHD patients, male patients were 63.4% (83/131 patients) in idiopathic GHD group and 53.1% (17/32 patients) in organic GHD group, respectively. Auxological and biochemical characteristics did not differ between boys and girls in the idiopathic and organic GHD groups, except for the higher MPH SDS in boys with idiopathic GHD and the lower MPH SDS and higher initial GH dose in boys with organic GHD. 58 patients (85.3%) among 68 patients having documents about assessing their pubertal status were prepubertal status. The mean age at diagnosis in patients with organic GHD was significantly older (9.72 ± 3.58 years) than that in patients with idiopathic GHD (7.50 ± 2.91 years) (P = 0.001). The baseline values for BA, Ht SDS, Wt SDS, MPH SDS, PAH SDS, and IGF-1 SDS were significantly higher in the organic GHD group than in the idiopathic GHD group. The peak GH concentration on the GH-stimulation test, initial GH dose, and mean GH dose during 3 years were higher in the idiopathic GHD group than in the organic GHD group (Table 1).
Table 1
Auxological and biochemical characteristics in participants
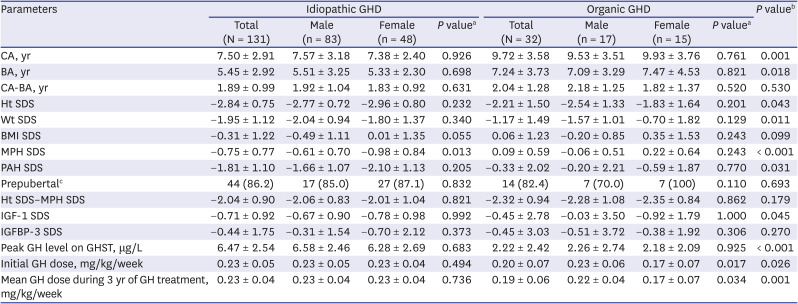
Values are presented as number (%) or mean ± standard deviation.
GHD = growth hormone deficiency, CA = chronological age, BA = bone age, Ht = height, SDS = standard deviation score, Wt = weight, BMI = body mass index, MPH = mid-parental height, PAH = predicted adult height, IGF-1 = insulin like growth factor-1, IGFBP-3 = insulin like growth factor-binding protein-3, GH = growth hormone, GHST = growth hormone stimulation test.
P values are calculated with independent t-test or Wilcoxon rank sum test: amale vs. female; bIGHD vs. OGHD.
cThis variable was analyzed from only available participants: IGHD (n = 51) and OGHD (n = 17).
Clinical characteristics and growth outcomes in children and adolescents with idiopathic and organic GHD according to additional pituitary hormone deficits
In 163 GHD patients, 20.9% of patients (34/163 patients) were diagnosed with MPHD (Fig. 1B). The prevalence of MPHD was higher in the organic GHD group than in the idiopathic GHD group (71.9% vs. 8.4%, respectively, P < 0.001). In the MPHD patients, the organic GHD group had significantly more additional pituitary hormone deficiencies than idiopathic GHD group (P = 0.045). The TSH deficiency (19.6%, 32/163 patients) was most prevalent in MPHD patients. However, the distribution of specific concomitant pituitary hormone deficiencies did not differ significantly between the idiopathic and organic GHD groups (Table 2). The number of additional pituitary hormone deficiencies was not associated with any baseline growth parameters in both the idiopathic and organic GHD groups (data not shown).
Table 2
Differences in pituitary hormone deficiency between the idiopathic and organic GHD groups
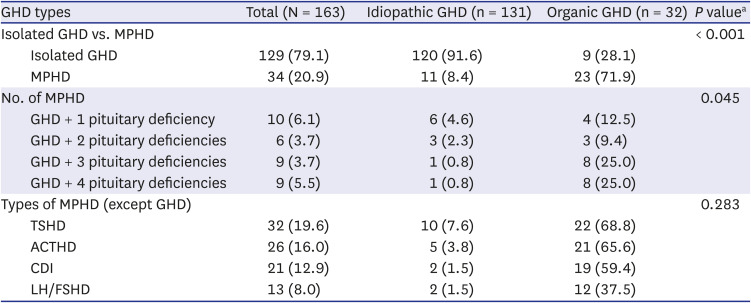
All values are presented as measured number (percentage).
GHD = growth hormone deficiency, MPHD = multiple pituitary hormone deficiency, TSHD = thyroid stimulating hormone deficiency, ACTHD = adrenocorticotropic hormone deficiency, CDI = central diabetes insipidus, LH/FSHD = hypogonadotropic hypogonadism.
aP values are calculated with χ2 test.
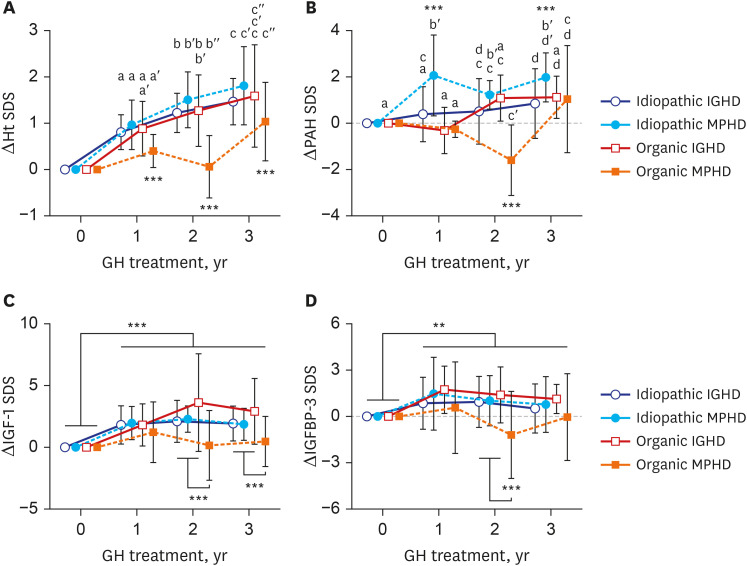
The ΔHt SDS and ΔPAH SDS increased significantly after GH treatment in all subgroups (P < 0.001) except that the ΔHt SDS and ΔPAH SDS after 2 years of GH treatment were not higher than the baseline values in patients with organic MPHD. Of all four subgroups, patients with idiopathic MPHD showed the largest increase for the ΔHt SDS and ΔPAH SDS during GH treatment, and those with organic MPHD had the smallest mean increase after GH treatment (Fig. 2A and B) (P < 0.001). These similar responses in ΔIGF-1 SDS and ΔIGFBP-3 SDS were also showed during GH treatment (Fig. 2C and D).
Fig. 2
Growth responses according to idiopathic vs. organic GHD and isolated vs. MPHD in children and adolescents with GHD during the 3 years of GH treatment. (A) ΔHt SDS, (B) ΔPAH SDS, (C) ΔIGF-1 SDS, and (D) ΔIGFBP-3 SDS. The values are presented as mean ± 95% confident interval. The different lowercase letters on the bars indicate significant differences between subgroups.
Ht = height, SDS = standard deviation score, PAH = predicted adult height, IGF-1 = insulin like growth factor-1, IGFBP-3 = insulin like growth factor-binding protein-3, IGHD = isolated growth hormone deficiency, MPHD = multiple pituitary hormone deficiency.
**P < 0.01; ***P < 0.001.
Changes in clinical and laboratory measures of growth during the 3-year GH treatment
Comparison of growth velocity and GH dosage between idiopathic and organic GHD patients
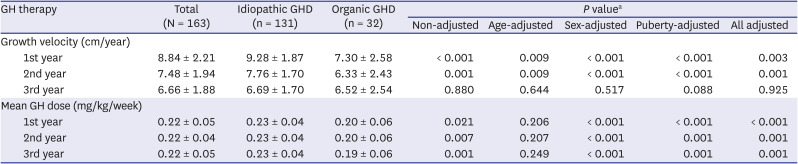
The GV was higher in the idiopathic GHD group than in the organic GHD group. The respective GV rates (cm/year) during the 3-year-treatment for idiopathic GHD vs. organic GHD group were 9.28 vs. 7.30 in the first year (P = 0.003), 7.76 vs. 6.33 in the second year (P = 0.001), and 6.69 vs. 6.52 in the third year (P = 0.925). These changes in GV remained significant after adjustment for age, sex, and pubertal status during the first and second years, and the total treatment period. The mean GH doses during 1st year, 2nd year, and 3rd year in idiopathic GHD group were significantly greater than those in organic GHD group after adjustment for age, sex, and pubertal status (Table 3).
Table 3
Changes in growth velocity and mean GH dosage after GH treatment in the idiopathic and organic GHD groups
Comparison of growth and biochemical outcomes between idiopathic and organic GHD patients
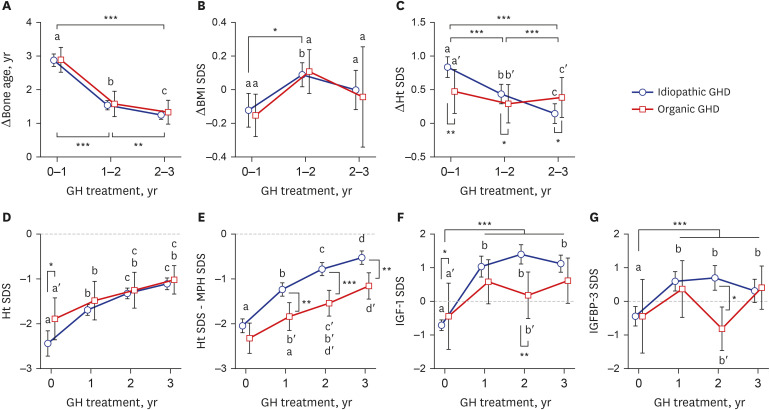
The BA was significantly accelerated after GH treatment. The ΔBA was the highest after the first year of GH treatment: 2.88 years in the idiopathic group (P < 0.001) and 2.90 years in the organic GHD group (P = 0.001). The ΔBA then decreased to about 1.2 years during the third year of treatment. The ΔBA was 4.01 years during the 3 years of GH treatment and did not differ significantly between groups. The BMI-SDS did not change significantly during follow-up period in either group. In both groups, the ΔHt SDS was the highest after 1 year of GH treatment and decreased gradually thereafter. The mean ΔHt SDS was larger in the idiopathic GHD group than that in organic GHD group during the first year (0.84 vs. 0.48, P = 0.001) and second year (0.44 vs. 0.29, P = 0.013), but not during the third year (0.25 vs. 0.39, P = 0.046). The Ht SDS in idiopathic GHD group at baseline was lower than in organic GHD group, but increased more after GH treatment. As a result, the Ht SDSs were not different between two groups during GH treatment. However, after adjusting for the patients’ genetic growth potential, we evaluated the Ht SDS–MPH SDS. The Ht SDS–MPH SDS was always significantly higher in the idiopathic GHD group than in the organic GHD group during the 3 years of GH treatment. The IGF-1 SDS (1.04 ± 1.79 in idiopathic GHD; 0.59 ± 1.83 in organic GHD) and IGFBP-3 SDS (0.59 ± 1.70 in idiopathic GHD; 0.36 ± 2.36 in organic GHD) increased after 1 year of GH treatment and remained at a high level during the 3 years. These values did not differ significantly between the idiopathic and organic GHD groups in the first and third years, but differed significantly during the second year of treatment (Fig. 3).
Fig. 3
Growth responses to the 3-year GH treatment in children and adolescents with idiopathic or organic GHD. (A) ΔBone age, (B) ΔBMI SDS, (C) ΔHt SDS, (D) Ht SDS, (E) Ht SDS minus MPH SDS, (F) IGF-1 SDS, and (G) IGFBP-3 SDS. All values are presented as mean ± 95% confident interval. The different lowercase letters indicate significant differences between groups.
GH = growth hormone, GHD = growth hormone deficiency, BMI = body mass index, SDS = standard deviation score; Ht = height, MPH = mid-parental height, IGF-1 = insulin like growth factor-1, IGFBP-3 = insulin like growth factor-binding protein-3.
*P < 0.05; **P < 0.01; ***P < 0.001.
Factors contributing to the growth response after the 3-year GH treatment
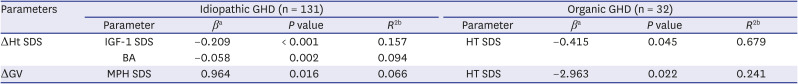
We evaluated the baseline factors contributing to the ΔHt SDS and ΔGV after 3 years of GH treatment (Table 4 and Supplementary Tables 1 and 2). In the multivariate linear regression analysis, the initial BA (β = −0.058, R2 = 0.094, P = 0.002) and IGF-1 SDS (β = −0.209, R2 = 0.157, P < 0.001) remained significantly associated with ΔHt SDS in patients with idiopathic GHD. The Ht SDS (β = −0.415, R2 = 0.679, P = 0.045) correlated significantly with ΔHt SDS in patients with organic GHD. The initial MPH SDS (β = 0.964, R2 = 0.066, P = 0.016) in patients with idiopathic GHD and Ht SDS (β = −2.963, R2 = 0.241, P = 0.022) in patients with organic GHD were associated with 3-year-ΔGV, respectively.
Table 4
The baseline parameters predicting ΔHt SDS and ΔGV after 3 years of GH treatment in patients with idiopathic or organic GHD
DISCUSSION
Our study showed that 3-year GH treatment improved GV and Ht SDS in all 4 subgroups.
GHD can present as IGHD or MPHD. Severe GHD is associated with lower peak stimulated GH levels,19 which are strong predictors of permanent GHD in adulthood. The peak stimulated GH has been reported to differ significantly between subgroups: organic GHD > idiopathic GHD; MPHD > IGHD.719 Moreover, organic GHD at diagnosis was five times more likely than idiopathic GHD to co-occur with MPHD and to progress from IGHD to MPHD.19 In our study, the peak stimulated GH concentrations were 6.5 μg/L and 2.2 μg/L, and the prevalence rates of MPHD were 8.4% and 71.9% in idiopathic and organic GHD groups, respectively. In addition, organic MPHD patients showed the tendency of more additional pituitary hormone deficiencies than idiopathic MPHD patients. However, the relative frequencies of the types of pituitary deficiencies did not differ between these two groups: TSHD > ACTHD > CDI > LH/FSHD. In a previous study, LH/FSHD is the second most frequent additional deficiency in patients with MPHD, but its prevalence should be repeated in late prepuberty because diagnosing LH/FSHD is difficult in young children.20 In fact, our frequency of LH/FSHD might be underestimated because 86% of enrolled patients were in prepubertal.
We evaluated whether the number of additional pituitary hormone deficiencies in GHD patients is associated with the growth response to GH. In the KIGS study, the growth response to GH treatment did not differ between the MPHD and IGHD groups.21 Maghnie et al.22 also reported that adult Ht was similar in patients with IGHD and MPHD. However, Reiter et al.23 and Huang et al.24 found a slightly better outcome for near-adult Ht in people with idiopathic MPHD than in those with idiopathic IGHD. Blethen et al.25 also observed that children with severe idiopathic GHD had the best response to GH treatment. In our subgroup analysis, the 3-year growth outcomes revealed the largest ΔHt SDS in idiopathic MPHD subgroup compared with the idiopathic IGHD or organic GHD subgroup, and that the smallest ΔHt SDS was in the organic MPHD subgroup. These outcomes may have been related to the ΔIGF-1 and ΔIGFBP-3 during GH treatment. In particular, because the most common cause of organic GHD is a brain tumor,2627 most physicians are concerned about secondary malignancy or tumor recurrence because of GH overuse. Therefore, the LGS data showed the use of lower doses of GH in patients with organic GHD, especially in those with severe GHD or organic MPHD.
In this study, the growth outcomes, ΔHt SDS and GV (cm/year), were highest in the first year (0.84 and 8.84) and then decreased with time (0.44 and 7.48 in the second year, and 0.25 and 6.66 in the third year). These results correlated highly with the ΔIGF-1 levels during GH treatment. These trends are similar to those reported earlier.2328 In Australian children with IGHD, the ΔHt SDS was about three times higher in the first year (0.92) than in the second (0.32) and third (0.30) years.29 Cutfield and Lundgren30 reported a median ΔHt SDS of 0.7–0.9 cm/year depending on the ΔIGF-1 in the first year of GH treatment in patients with idiopathic or organic GHD. In another study, the GV (cm/year) in patients with organic GHD was 8.6 in the first year, 7.2 in the second year, and 5.9 in the third year of GH treatment, and was lower than those with idiopathic GHD after adjustment for age and BA.31 Our findings are consistent with those of these earlier studies.
In our study, ΔHt SDS in the first year was lower in patients with organic GHD than in those with idiopathic GHD and as reported in other international studies. However, the ΔHt SDS values in the second and third years decreased less in the organic GHD group than in the idiopathic GHD group, which resulted in the same Ht SDS values after the 3-year GH treatment in both groups. It is uncertain whether the final adult Ht will differ between the idiopathic and organic GHD two groups. One study found that the final adult Ht was similar in children with idiopathic and organic GHD.32 Another study reported that children with idiopathic GHD grew more than those with organic GHD.23 Although the ΔHt SDS during the first 3 years of GH treatment did not differ between the idiopathic and organic GHD groups in our study, the parental-adjusted Ht, Ht SDS–MPH SDS, was significantly higher in the idiopathic GHD group than in the organic GHD group. This suggests that the growth outcomes to GH treatment in idiopathic GHD patients may be better than in organic GHD patients.
Hughes et al.29 suggested that younger age at the initiation of GH affects the GV in the first year of GH treatment. Reiter et al.23 observed that the MPH SDS and the first-year GV correlated strongly positively with ΔHt. In a study using KIGS data for children with MPHD, Darendeliler et al.21 found that higher birth Wt, taller parents, and taller Ht before GH treatment were significant predictors of a good response to GH. In a Korean study, Choi et al.27 reported that a larger baseline Ht SDS–MPH SDS in the idiopathic GHD group and younger baseline BA and larger baseline Ht SDS–MPH SDS in the organic GHD group correlated positively with increased final adult Ht. Moreover, the lower IGF-1 SDS at baseline was associated with the higher increment during treatment in short non-GHD group.33 In our study, younger BA, lower IGF-1 SDS, and higher MPH SDS in the idiopathic GHD patients and greater Ht SDS in the organic GHD patients at the beginning of GH treatment were significant predictors of the growth response to the 3-year-GH treatment. Our results suggest that the familial genetic status and the severity of GHD at diagnosis may be more important to determine the long-term growth responses, and which were similar to above studies.212327
Our study has some limitations. We could not evaluate the underlying disorders in the patients with organic GHD and could not adjust for the possible presence of untreated GHD patients or normal healthy children because the LGS contains only observational data for GHD patients. Moreover, our biochemical data such as IGF-1, IGFBP-3, and GH levels may have exhibited interlaboratory variability. The wide variations of IGF-1 SDS and IGFBP-3 SDS on 2-year-GH treatment were showed in organic GHD patients, which might be resulted from small sample sized subgroups with missing data. However, A strength of our study is that it is the first multicenter study of the responses to 3-year GH treatment in Korean children and adolescents with GHD and the first to compare between patients with idiopathic and organic GHD and between those with IGHD and MPHD.
In conclusion, GH treatment of children with GHD was effective for achieving linear growth, particular in those with idiopathic MPHD and during the first year of treatment. The growth response to GH was lower in patients with organic MPHD. Despite similar IGF-1 levels, the ΔPAH was higher in the idiopathic GHD group than in the organic GHD group. More close monitoring along with appropriate dosage of GH and current changes, not specific parameters at baseline, might be more important in children and adolescents with GHD for long-term treatment.
 XML Download