

 PDF
PDF Citation
 Print
Print


INTRODUCTION
Polycythemia vera (PV) is a chronic myeloproliferative neoplasm (MPN) characterized by increased production of red blood cells independent of the mechanism that normally regulates erythropoiesis. This disorder has a number of clinical characteristics in common with the other MPNs essential thrombocythemia (ET) and primary myelofibrosis (PMF), including an origin in hematopoietic stem cells, constitutive activation of hematopoiesis with overproduction of morphologically normal blood cells, extramedullary hematopoiesis, and transformation to bone marrow (BM) failure with myelofibrosis or acute leukemia.1
Splenomegaly is a clinical manifestation of MPNs and is most prominent in PMF.23 Palpable splenomegaly has been reported in 20–30% of patients with ET456 and has an even higher incidence in patients with PV at diagnosis.78 Palpable splenomegaly was previously one of the diagnostic criteria for PV.9 However, it is now just one of the additional criteria for a diagnosis of post-PV myelofibrosis,10 which indicates that splenomegaly is a sign of the advanced phase of this disorder. Non-palpable, imaging-based volumetric splenomegaly has also been studied in terms of diagnosis or prognostic significance in patients with MPN.11121314 The results, however, are lacking consistency and even difficult to interpret, most likely due to the arbitrary definition of the splenomegaly. This obstacle is inevitable because of the considerable variation in spleen size among individuals according to sex, age, and anthropometric parameters.15161718 This variation complicates the definition of volumetric splenomegaly. At present, palpable splenomegaly is not common in patients with PV,192021 probably because of early detection facilitated by the wide application of health examination, a lowering of the diagnostic thresholds for hemoglobin and hematocrit levels,22 and the widely used driver gene mutation tests. Radiological volumetric analysis of spleen size is now readily available. However, non-palpable splenomegaly in patients with PV has seldom been addressed.
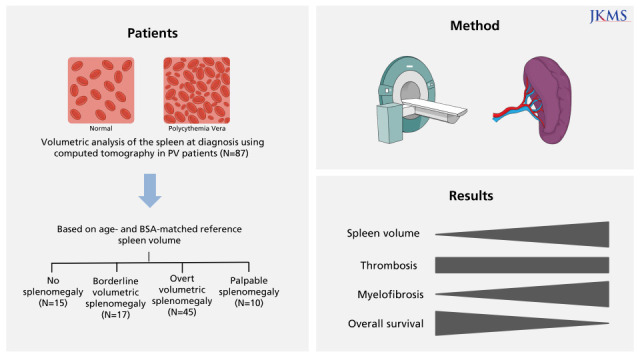
In this retrospective study, we evaluated non-palpable, volumetric splenomegaly defined based on age- and body surface area (BSA)–matched criteria at the time of diagnosis in patients with PV defined according to the 2016 World Health Organization (WHO) diagnostic criteria.22
METHODS
Patients
The medical records of patients with PV who underwent abdominal computed tomography (CT) at diagnosis and who had palpable splenomegaly at diagnosis between January 1991 and December 2020 at Chungnam National University Hospital were reviewed. Diagnoses of patients with MPN made prior to 2017 were revised according to the 2016 WHO diagnostic criteria. All laboratory data and BM specimens generated at the time of the initial diagnosis were reviewed and reexamined through the collaboration of a hematologist and a hematologic pathologist. Of the 133 patients who had previously been diagnosed with ET, 10 (7.5%) were re-diagnosed with PV based on hemoglobin and/or hematocrit levels and BM findings. Phlebotomy and hydroxyurea were prescribed according to standard treatment guidelines. Low-dose aspirin (100 mg daily) was prescribed to prevent thrombosis, except in patients who were at high risk of bleeding.
Driver gene mutation analysis
JAK2V617F was detected by polymerase chain reaction (PCR) and Sanger sequencing (before 2010) and allele-specific real-time quantitative PCR (after 2010). The JAK2 mutation in exon 12 was tested by PCR and Sanger sequencing.
CT
CT was performed with various scanners and techniques, but most images were obtained from the following multi-detector CT scanners: SOMATOM Sensation 16, SOMATOM Sensation 64, SOMATOM Definition Edge, and SOMATOM Definition Flash (all from Siemens Medical Solutions, Forchheim, Germany). The scanning parameters were as follows: section thickness, 3.0–5.0 mm; field of view, 304–360 mm; tube current-time product, 144–486 mAs; peak voltage, 100–120 kVp. After the acquisition of unenhanced scans, contrast-enhanced scans were performed. In total, 1.2–1.5 mL nonionic contrast material (iopromide [370 mg iodine/mL], Ultravist 370; Bayer Healthcare, Berlin, Germany) per kilogram of body weight was usually injected into the patient’s antecubital vein at a rate of 3–4 mL/s with a power injector. A bolus-tracking technique was used to optimize the timing of the arterial phase scan. Late portal phase images were obtained 70–80 seconds after contrast injection. A 20 mL flush of normal saline solution was administered immediately after contrast injection. Most axial CT images were reconstructed with a section thickness of 3 mm.
Volumetric analysis
Measurement of spleen volume was performed independently in a blind manner by two radiologists, through a consensus approach, using axial portal venous phase images. The Philips Multi-Modality Tumor Tracking application in IntelliSpace Portal version 10 (Philips Health Systems, Andover, MA, USA) was used to perform three-dimensional semi-automated quantitative assessment of spleen volume. The Philips Multi-Modality Tumor Tracking application allows researchers to define a lesion by identifying a region of interest (ROI) using either a manual or semi-automatic segmentation tool. The radiologists initiated volume segmentation manually by clicking on the spleen, then performing smart ROI threshold segmentation. They checked each section to determine whether any areas of the spleen were incorrectly excluded or included, and the incorrectly measured parts were semi-automatically edited using the software’s editing tool. Finally, spleen volume was calculated automatically.
Definition of splenomegaly
Reference spleen volumes based on age and BSA were adopted from a previous study (Supplementary Table 1).17 The study described normal spleen volumes of Japanese adults according to sex, age, and anthropometric parameters. The spleen volume of each patient was adjusted for the patient’s age and BSA, and then the degree of splenomegaly was classified as follows: no splenomegaly, spleen volume less than the mean plus 2 SD of the reference volume based on both age and BSA; overt volumetric splenomegaly, spleen volume greater than the mean plus 3 SD of the reference volume based on both age and BSA; borderline volumetric splenomegaly, a spleen volume between no splenomegaly and overt splenomegaly; or palpable splenomegaly, spleen palpable below the left costal margin (Supplementary Table 2).
Definitions of thrombotic and hemorrhagic events
Thrombotic events indicate cerebrovascular (ischemic stroke, transient ischemic attack, and venous sinus thrombosis), coronary (acute coronary syndrome and stable angina), splanchnic, and peripheral thromboembolism. A hemorrhagic event was defined as any acute bleeding that required a transfusion of red blood cells or hospitalization. The thrombotic or hemorrhagic events in this study included all events that occurred before, at the time of, and after diagnosis.
Statistical analysis
Descriptive data are presented as means ± standard deviations, medians (ranges), or percentages. The categorical variables were analyzed with the chi-square test, Fisher’s exact test, or the Kruskal–Wallis test as appropriate and the continuous variables were analyzed with Student’s t-test. Pearson correlation analyses were used to define the correlations between spleen volume and various parameters. The cumulative incidence of thrombosis and myelofibrotic transformation was obtained with the Fine and Gray model, with death serving as a competing risk, and analyzed with the Gray equality test. Risk factors for myelofibrotic transformation were analyzed using the Fine and Gray regression model, with death serving as a competing risk. Overall survival (OS) was defined as the time from PV diagnosis to death due to any cause. Survival was estimated with the Kaplan–Meier method and analyzed with the log-rank test. Risk factors for OS were analyzed using the Cox regression model. Statistical analyses were performed with SPSS (ver. 24.0; IBM, Armonk, NY, USA) or SAS Studio (SAS Institute, Cary, NC, USA). In all analyses, P < 0.05 was taken to indicate statistical significance.
RESULTS
Patient characteristics
During the study period, 125 patients were newly diagnosed with PV. Palpable splenomegaly was noted in 10 (8.0%) patients, and it tended to be less common in recent years (Fig. 1). Of the 125 PV patients, 84 (67.2%) underwent abdominal CT at diagnosis. Of the 41 patients who did not undergo abdominal CT, 3 had palpable splenomegaly. Thus, a total of 87 patients were enrolled in the study (Supplementary Fig. 1) The majority (94.2%) of the 87 patients were diagnosed with PV after 2000. The study population had a male:female ratio of 1.5:1, had a median age of 64 years (range, 18–86 years), and was followed for a median of 4.5 years (range, 0.2–20.5 years). JAK2V617F and JAK2 exon 12 mutation were detected in 74 (92.5%) of 80 patients examined and 3 (3.8%) of 65 patients examined, respectively. Cytoreductive therapy and phlebotomy were prescribed for 73 (83.9%) and 83 (95.4%) patients, respectively. Most patients were placed on low-dose aspirin. Thrombotic and hemorrhagic vascular events occurred in 29 (33.3%) and 12 (13.8%) patients, respectively, before, at the time of, or after the diagnosis of PV (Table 1).
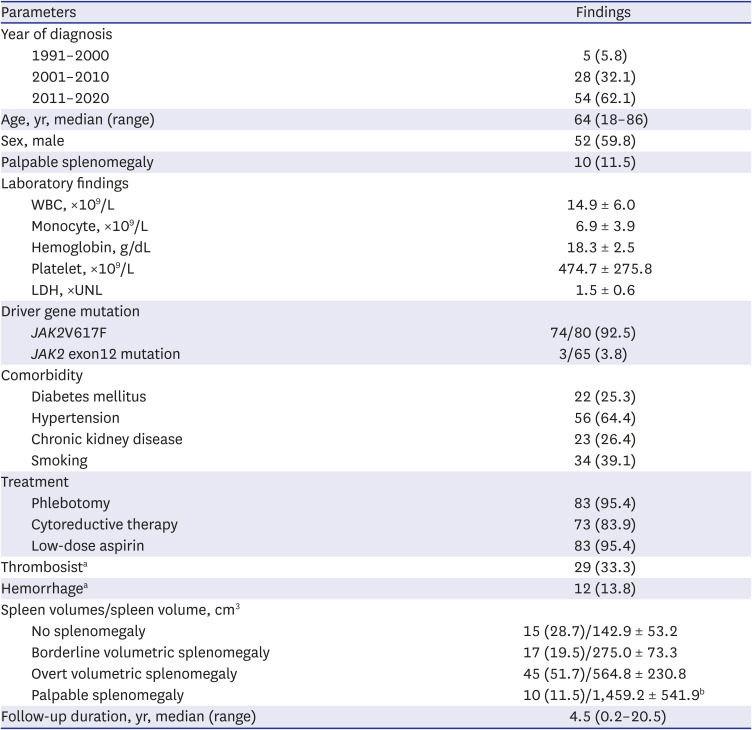

Table 1
Patient characteristics and spleen volumes (N = 87)
Values are presented as number (%) or mean ± standard deviation.
WBC = white blood cell, LDH = lactate dehydrogenase, UNL = upper normal limit.
aOverall events detected before, at the time of, and after diagnosis; bData are from the 7 patients who underwent abdomen computed tomography.
![]()
Spleen volume
Of the 87 PV patients, 15 (17.2%) had no splenomegaly at diagnosis. Borderline volumetric, overt volumetric, and palpable splenomegaly were found in 17 (19.5%), 45 (51.7%), and 10 (11.5%) patients, respectively (Table 1). Spleen volume was significantly positively correlated with lactate dehydrogenase (LDH) level (r = 0.227, P = 0.042) and tended to be positively related to white blood cell (WBC) count (r = 0.209, P = 0.055) and monocyte count (r = 0.210, P = 0.059) at diagnosis. Spleen volume was not correlated with hemoglobin level, platelet count, or JAK2V617F burden at diagnosis (Supplementary Fig. 2).
Comparison of patients with PV according to splenomegaly status
Clinical features were compared according to the degree of splenomegaly (i.e., no, borderline volumetric, overt volumetric, and palpable splenomegaly). There were no differences in age or sex distribution according to the degree of splenomegaly. WBC count (P = 0.002), LDH level (P = 0.005), vitamin B12 level (P = 0.035), and positivity (P = 0.002) and burden (P = 0.047) of JAK2V617F tended to increase with the degree of splenomegaly. There were no differences in monocyte count, hemoglobin level, platelet count, or serum erythropoietin level or in the incidence of thrombotic or hemorrhagic vascular events according to the degree of splenomegaly. However, myelofibrotic transformation was more common in patients with advanced splenomegaly (P = 0.004) (Table 2). In Fine and Gray analyses, there were no differences in the cumulative incidence of thrombotic vascular events among patients with no, borderline volumetric, overt volumetric, or palpable splenomegaly (overall 10-year incidence: 20.1%, 35.3%, 39.7%, and 74.3%, respectively, P = 0.310; 10-year incidence after diagnosis: 7.7%, 0%, 22.3%, and 50.7%, respectively, P = 0.414) (Supplementary Fig. 3). Although thrombotic events tended to be more frequent in patients with palpable splenomegaly than in the other groups, in particular later in the clinical course, the difference did not reach statistical significance (P = 0.336) (data not shown). By contrast, splenomegaly tended to adversely affect myelofibrotic transformation (10-year cumulative incidence: 0%, 0%, 7.1%, and 30.3%, respectively, P = 0.062). Moreover, the cumulative incidence of myelofibrotic transformation was significantly higher in patients with overt volumetric or palpable splenomegaly than those with no or borderline volumetric splenomegaly (10-year incidence: 0% vs. 10.3%, respectively; 15-year incidence: 0% vs. 26.3%, respectively, P = 0.020) (Fig. 2). Survival differed among patients with no, borderline volumetric, overt volumetric, and palpable splenomegaly (15-year OS: 100%, 78.6%, 71.7%, and 51.9%, respectively, P = 0.021) (Fig. 3A). Whereas survival was significantly worse in patients with volumetric splenomegaly than in patients with no splenomegaly, it was significantly better than in patients with palpable splenomegaly (15-year OS: 76.2%, 100%, and 51.9%, respectively, P = 0.010 (Fig. 3B).
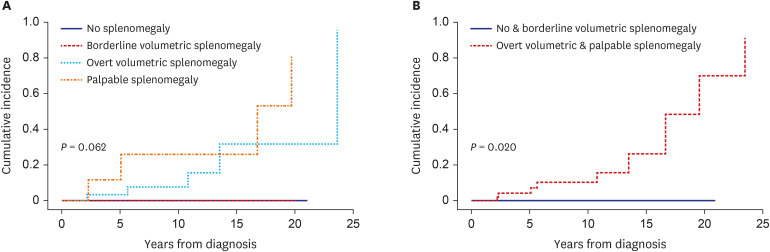
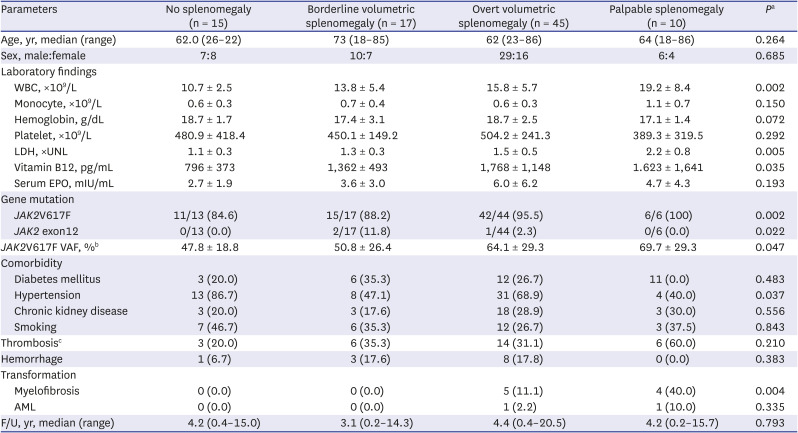
Fig. 2
Cumulative incidence of myelofibrotic transformation according to the degree of splenomegaly in patients with polycythemia vera.
![]()

Table 2
Clinical features of polycythemia vera patients according to the degree of splenomegaly (N = 87)
Values are presented as number (%) or mean ± standard deviation.
WBC = white blood cell, LDH = lactate dehydrogenase, UNL = upper normal limit, EPO = erythropoietin, VAF = variant allele frequency, AML = acute myeloid leukemia.
aχ2 or Kurskal-Wallis test; bA total of 61 patients were examined; cOverall events detected before, at the time of, and after diagnosis.
![]()
Risk factors for myelofibrotic transformation and OS
Fine and Gray regression analysis was performed to determine risk factors for myelofibrotic transformation. Degree of splenomegaly (i.e., no splenomegaly, volumetric splenomegaly, and palpable splenomegaly) (hazard ratio [HR], 7.75; 95% confidence interval [CI], 1.87–32.10; P = 0.005) and abnormal karyotype (HR, 261.48; 95% CI, 7.57–9,036.32; P = 0.002) at diagnosis were independent risk factors (Table 3). Degree of splenomegaly (HR, 6.70; 95% CI, 1.89–23.72; P = 0.003) and abnormal karyotype (HR, 40.39; 95% CI, 3.41–493.33; P = 0.004) at diagnosis also were independent risk factors for OS (Table 4).
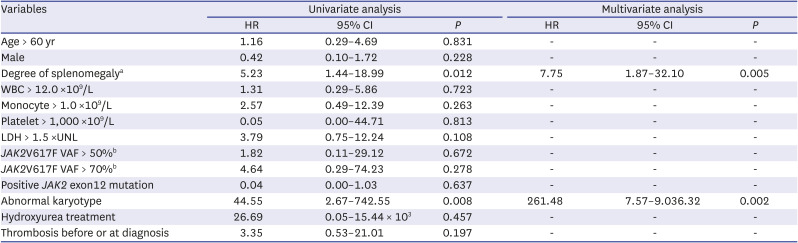
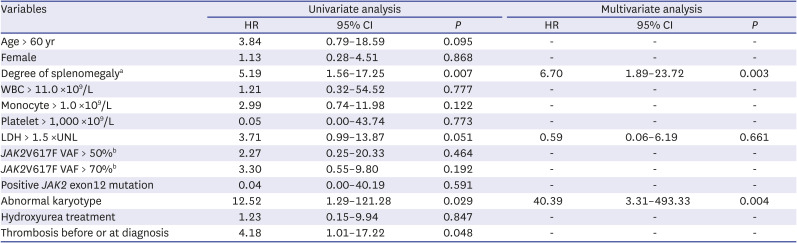
Table 3
Fine and gray regression analysis seeking risk factors for developing secondary myelofibrosis (N = 87)
HR = hazard ratio, CI = confidence interval, WBC = white blood cell, LDH = lactate dehydrogenase, UNL = upper normal limit, VAF = variant allele frequency.
aNo splenomegaly, volumetric splenomegaly, and palpable splenomegaly; bA total of 61 patients were examined.
![]()
Table 4
Cox regression analysis seeking risk factors for survival (N = 87)
HR = hazard ratio, CI = confidence interval, WBC = white blood cell, LDH = lactate dehydrogenase, UNL = upper normal limit, VAF = variant allele frequency.
aNo splenomegaly, volumetric splenomegaly, and palpable splenomegaly; bA total of 61 patients were examined.
![]()
DISCUSSION
In the present study, we defined non-palpable, volumetric splenomegaly based on age- and BSA-matched reference spleen volumes described previously.17 We divided non-palpable splenomegaly into borderline volumetric splenomegaly and overt volumetric splenomegaly in patients with PV at the time of diagnosis based on the assumption of a normal distribution of spleen volume according to age and body size. This classification was assumed to avoid the over- or underestimation of radiological splenomegaly likely in previous analyses that used universal criteria. This has been examined in our previous study of patients with ET and prefibrotic/early PMF (pre-PMF).23 In that study, half of patients with ET had the normal spleen, whereas all patients with pre-PMF had borderline volumetric splenomegaly or a large spleen.
Palpable splenomegaly is a risk factor for thrombosis,24 myelofibrotic transformation,2526 and mortality2627 in patients with PV. Of the 125 PV patients in the present study cohort, only 10 (8.0%) had palpable splenomegaly, a much lower prevalence than those in previous reports. Moreover, the prevalence has decreased in recent years, whereas the incidence of PV has increased. On the other hand, only 15 (17.2%) of the 87 PV patients enrolled in the present study had a normal spleen. Thus, the majority of patients (82.8%) had borderline volumetric splenomegaly or larger spleen at diagnosis of PV. Pearson correlation analyses revealed that the spleen volume was positively correlated with WBC count and LDH level, both of which also tended to increase with the degree of splenomegaly. These findings are consistent with previous studies that indicate that WBC count and LDH level are higher in MPN patients with palpable splenomegaly.2829
In the present study, the JAK2V617F allele burden increased with the degree of splenomegaly. The JAK2V617F allele burden was correlated with measurements of stimulated erythropoiesis (higher hematocrit level, lower mean cell volume, serum ferritin, and erythropoietin levels), myelopoiesis (higher WBC count, neutrophil count, and serum LDH), and larger spleen size.3031 In addition, the mutant allele burden is significantly related to the risk of developing myelofibrosis.27323334 Taken together, splenomegaly indicates a more advanced phase of the disease compared to the normal spleen.
Splenic extramedullary hematopoiesis is a major component of splenomegaly in patients with MPN,3536 and myelofibrosis is a major factor leading to an enlarged spleen.337 In this context, it is understandable that the spleen volume is larger in patients with advanced PV. Accordingly, the suggestion that not only palpable splenomegaly but also volumetric splenomegaly may have similar implications is reasonable. In the present study, volumetric splenomegaly was not associated with thrombotic risk in patients with PV. Similar findings have been reported in patients with ET and pre-PMF.23 However, the cumulative incidence of myelofibrotic transformation was significantly higher in patients with overt volumetric or palpable splenomegaly than those with no or borderline volumetric splenomegaly. Furthermore, OS worsened as the degree of splenomegaly increased. Taken together, the degree of splenomegaly, including volumetric splenomegaly, reflects the progression of the disease, most likely toward myelofibrotic transformation.
The presence of leukocytosis, palpable splenomegaly at diagnosis or during follow-up, BM reticulin fibrosis, resistance/intolerance to hydroxyurea, in terms of the development of cytopenia and failure to reduce massive splenomegaly, and a long disease duration are associated with a greater risk for myelofibrotic transformation.38 In an international study of 1,545 patients with WHO-defined PV, the survival of the entire study cohort was adversely affected by older age, leukocytosis, venous thrombosis, and abnormal karyotype.39 In the present study, degree of splenomegaly and abnormal karyotype at the time of PV diagnosis were independent risk factors for both myelofibrotic transformation and OS. These results suggest that well-defined volumetric splenomegaly should be included as a prognostic indicator of PV. The present study is retrospective in nature and enrolled relatively limited number of patients. In addition, a subpopulation of the patients was followed-up for a relatively short period. Therefore, the results of this study need to be verified in a study on a larger number of patients.
In conclusion, the degree of splenomegaly, including volumetric splenomegaly based on age- and BSA-matched reference spleen volumes reflects disease progression in PV patients. Therefore, volumetric splenomegaly should be evaluated at the time of PV diagnosis and taken into consideration when predicting the prognosis of this disorder.
 XML Download