

 PDF
PDF Citation
 Print
Print


INTRODUCTION
The coronavirus disease 2019 (COVID-19) pandemic is predicted to have an adverse impact on various aspects of public health, including obesity. Several studies suggest that individuals with obesity are at a higher risk of COVID-19 infection, face higher mortality and severity when infected, and may be more susceptible to developing various health conditions associated with COVID-19.12345 In addition, COVID-19 is known to aggravate lifestyle behaviors associated with obesity, including physical activity, sleep quality, and dietary habits, due to social distancing policies.67
In particular, children and adolescents with overweight or obesity may face a higher risk of developing health risks during the pandemic as COVID-19 related stay-at-home orders and restricted school attendance are known to affect obesity in children.68 Recent studies on COVID-19 and pediatric obesity have reported that lifestyle behaviors such as participation in sports activities and physical activity decreased whereas screen time had increased during the pandemic.910111213 Several other studies reported weight increase among children and adolescents during lockdown.141516
Even though there are some reports of changes in lifestyle behaviors and weight increase during the COVID-19 pandemic, the evidence of cardiometabolic changes according to weight gain during the lockdown in children and adolescents with overweight or obesity is limited as many studies have used self-report questionnaires as a primary instrument. Additionally, only a few studies have focused on the association of lifestyle factors with changes in obesity status during the COVID-19 pandemic.
In order to restrain the effect of a global pandemic on pediatric obesity, there is a need to identify the lifestyle behaviors that are most associated with weight gain during circumstances such as a national lockdown. Therefore, the purpose of this study was to investigate the relationship between lifestyle factors with weight gain during the COVID-19 pandemic in children and adolescents with obesity.
Go to : 
METHODS
Study design and participants
This study is a partial analysis of a community-based obesity intervention study, which was a 6-month trial designed to test the feasibility and efficacy of an online-based multidisciplinary intervention for children and adolescents with obesity. Participants from Gyeonggi-do Province were recruited through official letters and mobile notification sent from schools. Baseline examinations were conducted from August 2019 to January 2020, before the COVID-19 public policy enforcing social distancing and stay-at-home orders was announced in Korea in February 2020. The study was temporarily suspended due to these policies and resumed in June 2020, and re-examination was performed until November 2020. As the schedule of enrollment in the study differed for each participant, the interval between the pre- and post-lockdown examinations was included in later analyses as a possible covariate. Among the 136 children and adolescents recruited for the intervention study with baseline data, 97 children and adolescents (mean age, 11.09 years) were re-examined and were included in the present study.
Anthropometric measurements
After a minimum of 10 hours of fasting, the body weights of barefoot participants were measured to the nearest 0.1 kg using bioelectrical impedance analysis (InBody 720 Body Composition Analyzer, BioSpace Co., Ltd., Seoul, Korea)17 wearing lightweight clothing. Height was measured to the nearest 0.1 cm using a stadiometer (DS-103, DongSahn Jenix, Seoul, Korea). Body mass index (BMI) was calculated as weight (kg) divided by height (m2) and converted into z-scores (zBMI) based on the 2017 Korean National Growth Charts.18
Obesity status was defined based on data from the 2017 Korean Centers for Disease Control and Prevention.19 Overweight, moderate obesity, and severe obesity were defined as BMI between the ≥ 85th and < 95th percentiles, ≥ 95th and < 120% of the 95th percentile, and ≥ 120% of the 95th percentile for age and sex, respectively.
Waist circumference was measured at the middle of the last rib and the iliac crest to the nearest 0.1 cm. Whole-body dual-energy X-ray absorptiometry was conducted using the Lunar Prodigy Advance with pediatric software (version 14.0; GE Healthcare, Madison, WI, USA) to assess body composition. Fat mass index and fat-free mass index (fat mass [kg] and fat-free mass [kg], respectively, divided by height squared [m2]) were calculated. The differences in zBMI were calculated by subtracting the pre-lockdown zBMI from the post-lockdown zBMI.
Blood pressure and blood samples
The participants rested for 5–10 minutes before blood pressure (BP) was measured twice in the right arm using a digital automatic BP monitor (HEM-907, Omron, Kyoto, Japan) in the morning.20 Blood samples were obtained in the morning after at least 10 hours of overnight fast to determine triglyceride, low-density lipoprotein cholesterol, high-density lipoprotein cholesterol (HDL-C), fasting plasma glucose and insulin, aspartate aminotransferase (AST), alanine aminotransferase (ALT), gamma-glutamyl transferase (GGT), 25(OH) vitamin D, leptin, and adiponectin levels. The homeostasis model assessment for insulin resistance (HOMA-IR) was calculated as (fasting plasma glucose level [mg/dL] × fasting plasma insulin level [μU/mL])/405 to determine the level of insulin sensitivity.
Physical fitness
Cardiorespiratory fitness was measured with the YMCA 3-minutes step box test.21 Participants stepped up and down a 30 cm step box for 3 consecutive minutes at a speed of 24 steps/min, and heart rate was measured after one minute. Post 1-minute heart rate was used as an index of cardiorespiratory fitness to measure post-exercise heart rate recovery. Upper body muscular strength was measured with a one-repetition maximum chest press test, and lower body muscular strength with a leg extension test. Upper body muscular strength index (MSI) and lower MSI were computed as the upper and lower body muscular strength (kg) divided by weight (kg), respectively.
Dietary assessment
Dietary intake data was collected using a 3-day food record (2 weekdays and 1 weekend), and a clinical dietitian confirmed these records. The average calorie intake was calculated using a nutrition analysis program (CAN Pro, version 5.0; The Korean Nutrition Society, Seoul, Korea).
Questionnaire
Questionnaires were used to collect data on physical activity (Global Physical Activity Questionnaire),2223 sleeping duration, and screen time (e.g., television, computer, and mobile devices). Dietary quality was measured using the Diet Quality Index (DQI)24 with four subscales: variety, adequacy, moderation, and overall balance. Each subscale is evaluated and scored up to 20, 40, 30, and 10 points, respectively, adding up to a total of 100 points. A higher score indicates a high-quality diet, and a lower score indicates a low diet quality which denotes an eating pattern that is less congruent with dietary recommendations. Demographic variables such as monthly household income, parent and child medical history, parental working hours, and parental education were collected using a questionnaire. Parental weight and height data were obtained with a questionnaire as well.
Statistical analysis
Continuous variables are presented as mean ± standard deviation or median (interquartile range). The Shapiro-Wilk test was used to evaluate data normality. The pre- and post-lockdown measurements were compared using the paired t-test or Wilcoxon signed-rank test, depending on whether the quantitative data were consistent with normal distribution. The McNemar-Bowker test was used to compare pre- and post-lockdown changes in categorical variables with more than 2 categories. Spearman’s rank correlation analysis was performed to evaluate the association among changes in zBMI scores with changes in anthropometric measurements, cardiometabolic markers, and lifestyle variables. In addition to age, sex, monthly income, maternal working hours, and re-examination duration as covariates, lifestyle factors that were statistically significant according to the correlation analyses were included in the linear regression models to identify the predictors associated with zBMI changes. All statistical tests were 2-sided, and statistical significance was determined at P < 0.05. All statistical analyses were performed using SPSS (SPSS 25.0; IBM Corporation, Armonk, New York, USA).
Ethics statement
The study protocol was reviewed and approved by the Institutional Review Board of Hallym University Sacred Heart Hospital (approval No. HALLYM 2019-04-027-005), and all participants and their primary caretakers provided informed consent when they were enrolled.
Go to :
RESULTS
A total of 97 children and adolescents (median age 11.09) with overweight or obesity were included in the final analyses, and their baseline characteristics are described in Table 1. The median value of the interval between examinations was 294 days (interquartile range 203.0 to 332.5 days).
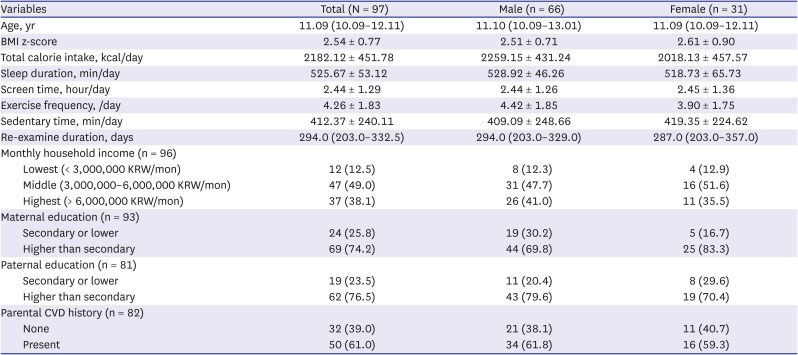
Table 1
Baseline characteristics of participants
Re–examine duration refers to the interval between pre– and post–examination.
Data are presented as mean ± standard deviation or median (interquartile range) or number (%).
BMI = body mass index, KRW = Korean Republic Won, CVD = cardiovascular disease.
![]()
The comparison of pre- and post-lockdown examinations are detailed in Table 2. Anthropometric measurements including height (P < 0.001), body weight (P < 0.001), BMI (P < 0.001), and zBMI (P = 0.014), increased significantly. Body composition measurements, including fat mass index (P = 0.002) and fat-free mass index (P < 0.001) significantly increased post-lockdown. The percentage of participants with severe obesity increased from 23.7% to 33.0% post-lockdown. Cardiometabolic risk markers, including systolic BP (P = 0.009) and diastolic BP (P = 0.030), were significantly increased. In addition, an increase in triglycerides (P = 0.013) and HOMA-IR (P = 0.003), and a decrease in HDL-C (P < 0.001) and vitamin D (P < 0.001) were observed. Changes in physical fitness, including a deterioration in cardiorespiratory fitness (P < 0.001) and upper MSI (P = 0.011) were noticed at post-lockdown. Several lifestyle variables were changed post-lockdown. Total calorie intake (P < 0.001), dietary quality according to DQI-I (P < 0.001), and exercise frequency (P < 0.001) decreased whereas screen time (P < 0.001) increased at post-lockdown compared to pre-lockdown.
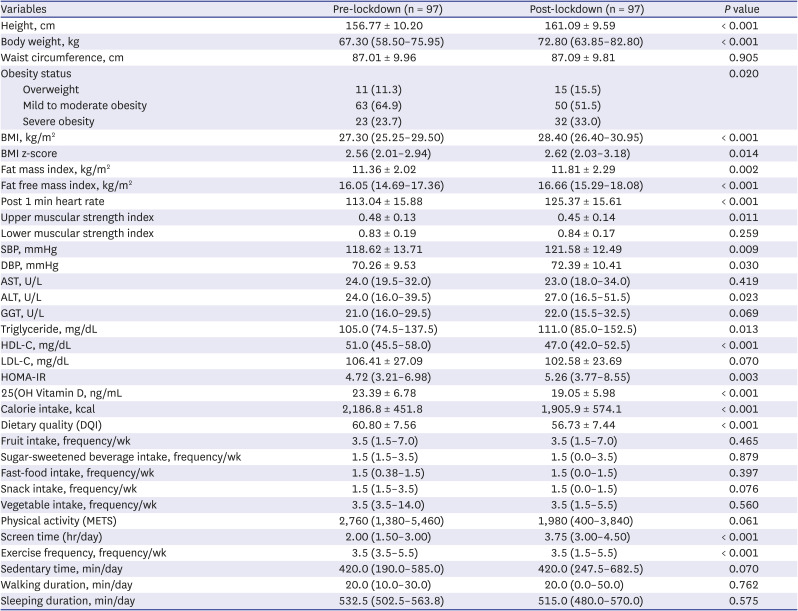
Table 2
Physical examination and laboratory test results according to assessment periods
Data are presented as mean ± standard deviation or median (interquartile range) or number (%).
P values of paired t-test (normative variables) or Wilcoxon signed rank test (non–normative variables) or McNemar–Bowker test (categorical variable).
BMI = body mass index, SBP = systolic blood pressure, DBP = diastolic blood pressure, AST = aspartate amino–transferase, ALT = alanine aminotransferase, GGT = gamma–glutamyl transferase, HDL–C = high–density lipoprotein cholesterol, LDL–C = low–density lipoprotein cholesterol, HOMA–IR = homeostatic model assessment for insulin resistance, DQI = Dietary Quality Index, METS = metabolic equivalent of tasks.
![]()
Correlations among zBMI changes with cardiometabolic changes are described in Table 3. Physical changes including changes in waist circumference (r = 0.705), BMI (r = 0.963), fat mass (r = 0.887), fat-free mass (r = 0.495), fat mass index (r = 0.877), fat-free mass index (r = 0.619), and body fat percentage (r = 0.612) were strongly correlated with zBMI change. However, baseline zBMI (r = 0.043), fat mass (r = −0.067), and fat-free mass (r = −0.035) were non-significantly related. Changes in cardiometabolic markers including AST (r = 0.492), ALT (r = 0.571), GGT (r = 0.537), triglycerides (r = 0.398), HDL cholesterol (r = −0.245), triglyceride/HDL ratio (r = 0.412), HOMA-IR (r = 0.398), leptin (r = 0.578), adiponectin (r = −0.326), and leptin/adiponectin ratio (r = 0.551) were moderately associated with changes in zBMI, as well. In addition, changes in zBMI scores were associated with changes in lower muscular strength index (r = −0.212), but not cardiorespiratory fitness (r = −0.141).
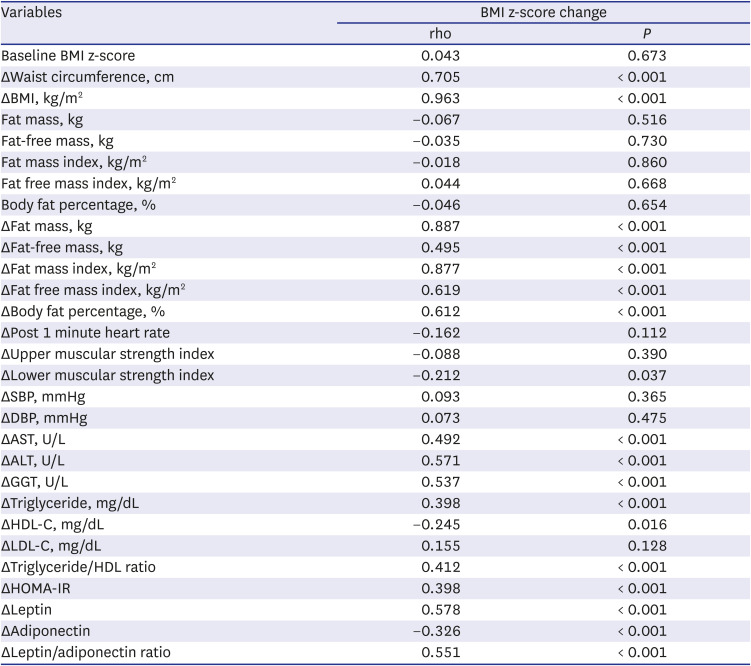
Table 3
Spearman’s rank correlation coefficients for changes in BMI z-score related to changes in physical examination and laboratory test results
Spearman’s rank correlation coefficients presented for the physical changes related to BMI z-score change. BMI z-score change values calculated as postintervention-preintervention values.
BMI = body mass index, SBP = systolic blood pressure, DBP = diastolic blood pressure, AST = aspartate amino-transferase, ALT = alanine aminotransferase, GGT = gamma-glutamyl transferase, HDL-C = high-density lipoprotein cholesterol, LDL-C = low-density lipoprotein cholesterol.
![]()
Correlation between lifestyle factors and changes in zBMI are described in Table 4. Changes in fast-food intake (r = 0.294) and sedentary time (r = 0.310) were positively correlated with changes in zBMI. Meanwhile, changes in caloric intake or snack intake were non-significantly correlated with weight gain.
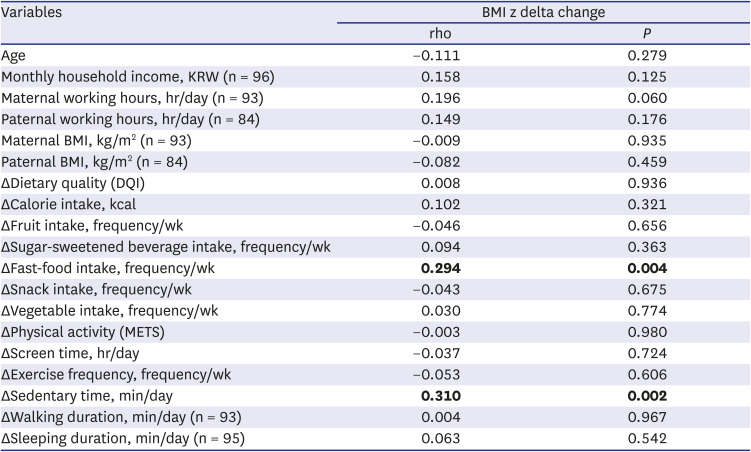
Table 4
Spearman’s correlation coefficients for lifestyle factors related to changes in BMI z–score
Spearman’s rank correlation coefficients presented for the factors related to BMI z–score change. Change values calculated as postintervention–preintervention values.
BMI = body mass index, KRW = Korean Republic Won, DQI = Dietary Quality Index, METS = metabolic equivalent of tasks.
![]()
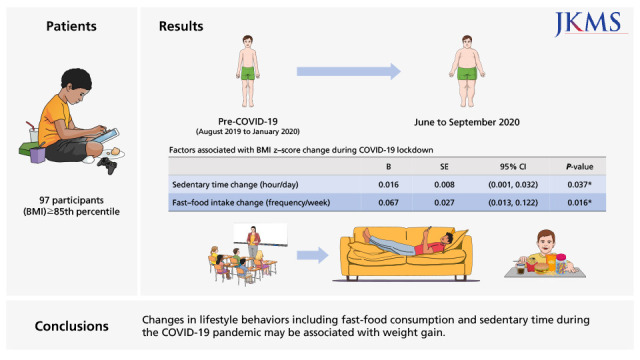
According to multivariate regression analysis adjusted for age, sex, re-examination duration, monthly income, and maternal working hours as covariates, changes in sedentary time (β = 0.016; 95% confidence interval [CI], 0.001–0.032) and fast-food intake (β = 0.067; 95% CI, 0.013–0.122) were significantly associated with zBMI increase during the COVID-19 pandemic (Table 5).
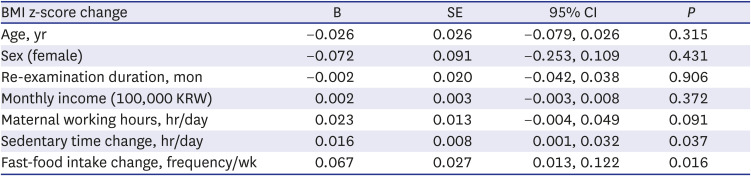
Table 5
Predictors associated with BMI z-score change according to regression analysis
Linear regression analysis with change values computed as postintervention–preintervention values.
BMI = body mass index, KRW = Korean Republic Won.
![]()
Go to :
DISCUSSION
This study found that zBMI significantly increased in children and adolescents with overweight or obesity during the COVID-19 lockdown. Changes in several cardiometabolic risk markers were associated with zBMI changes during the pandemic. Increase in sedentary time and fast-food consumption were lifestyle changes associated with zBMI increase during the COVID-19 pandemic in children and adolescents.
During the COVID-19 pandemic, a significant weight gain was noticed in research participants, which was not correlated with the degree of obesity prior to the outbreak. Although there are some reports of more weight gain in adults with a higher BMI,25 researchers have yet to find the relationship between weight gain during lockdown and the severity of obesity in children. Increase in weight during the pandemic was associated with deterioration in cardiometabolic markers, including AST, ALT, GGT, triglycerides, HDL cholesterol, leptin, adiponectin, and leptin/adiponectin ratio, which is consistent with previous findings indicating a relationship between weight gain and cardiometabolic markers.262728 The findings suggest that weight gain during the pandemic is associated with deterioration in cardiometabolic markers even in children and adolescents, and that significant actions at the policy level are needed to prevent weight gain in children with obesity during the pandemic period.
In this study, we found that weight increase was associated with an increase in fast-food consumption and sedentary time during lockdown. To the best of our knowledge, no studies have reported which lifestyle behaviors are associated with weight gain during the COVID-19 pandemic in children and evidence on this is lacking. Fast-food consumption is known to be associated with weight gain in children and adolescents, as fast-food contains high levels of fat, sugar, and sodium.29 However, overall fast-food consumption did not increase during the lockdown in our sample, as in countries that have found a decrease in fast-food intake during the pandemic.3031 This may be explained by people avoiding eating in public places due to the pandemic, such as in fast-food restaurants. In fact, there are reports that some people have taken the opportunity to eat less fast-food and more fresh food during the lockdown, whereas others reported consuming more fast-food since the beginning of COVID-19, especially in households that receive food assistance.31 In our study, increased fast-food consumption during the pandemic was significantly associated with weight gain, suggesting that children and adolescents who do not have the opportunity to consume more healthy food during the pandemic may be more vulnerable to gaining weight due to the lockdown.
In addition, we found that an increase in sedentary time was associated with changes in body weight in children and adolescents during the COVID-19 pandemic according to a multivariate analysis, which adds to previous studies that have compared pre- and post-lockdown reports of sedentary time in children.913 This may be a direct effect of reduced outdoor activities due to stay-at-home orders and restricted participation in school activities, as in a recent study that has reported the number of days of school closure due to COVID-19 was associated with weight gain in children.16 Preventing the increase in sedentary time and fast-food consumption may be important in preventing weight gain during the COVID-19 pandemic.
Some lifestyle variables have significantly changed during the lockdown but were not associated with weight gain during the pandemic according to the multivariate analysis. Whereas screen time had increased, and sum of the ranks of exercise frequency had decreased at post-lockdown, both were not associated with weight gain. Several other studies have similarly reported an increase in physical inactivity during the COVID-19 pandemic,121432 but our study adds to the literature in that these lifestyle behaviors may not be directly associated with weight gain during the lockdown. Likewise, although overall dietary quality had deteriorated during the pandemic, as in studies that have reported an increase in unhealthy dietary habits such as eating more snacks and beverage and less fruit and vegetables,111433 it was not associated with weight gain during the lockdown in our sample.
There are several limitations to this study. First, the duration between the 2 examinations was different for each participant because participants were enrolled in the study at different times. We included it as a covariate in the multivariate analyses in order to adjust for the individual differences in re-examination duration. Second, as participants were recruited from an obesity intervention program, there may be limitations in applying the results to a general population that includes children without obesity. However, these findings may have important implications for children and adolescents with obesity, as they are more vulnerable to the changes caused by the COVID-19 pandemic.534
The strength of this study is that we investigated lifestyle factors associated with weight gain during the lockdown, which suggests that more focus should be made on managing such lifestyle behaviors during the pandemic for effective health management in children and adolescents with obesity. Second, we used anthropometric measurements to determine physical change in children during the pandemic. Whereas many studies have used self-report questionnaires as a primary instrument to measure weight gain due to limitations in collecting in-person data during the lockdown,111530 actual physical measurements as applied in this study can be a more accurate source of data to better determine the degree of weight change in children and adolescents during the pandemic.
In conclusion, during the COVID-19 lockdown, increase in body weight was observed in children and adolescents with overweight or obesity. Changes in several cardiometabolic markers, including liver function, blood lipid, and leptin were associated. Lifestyle behaviors associated with weight gain, including increased physical inactivity as well as unhealthy dietary habits, have been reported resulting from strict social distancing and stay-at-home orders,101335 leading to weight gain during the lockdown. These factors should be considered when developing policies regarding public health in children and adolescents during the COVID-19 pandemic.
Go to :
 XML Download