Introduction
Materials and Methods
Table 1
Results
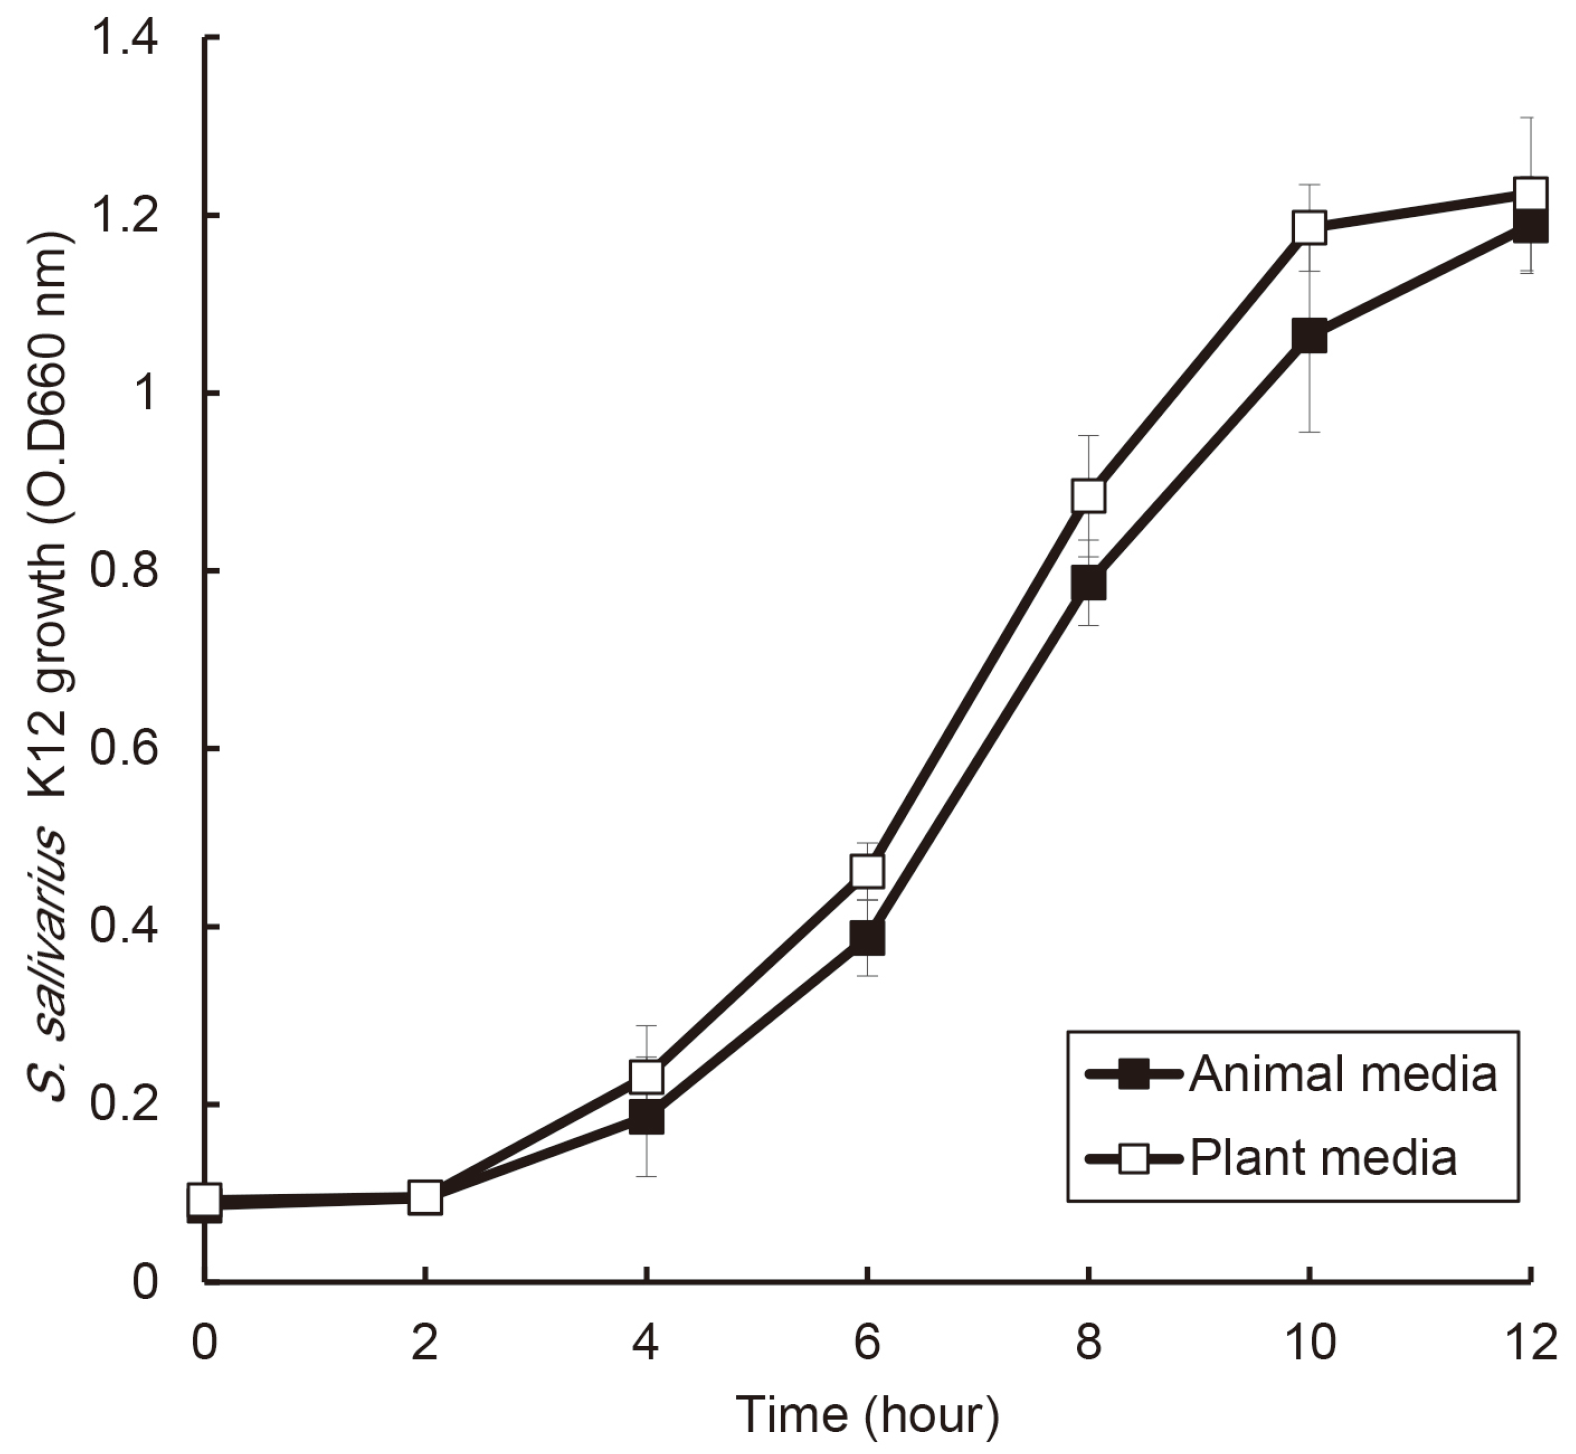
 | Fig. 1Comparison of effects of animal and plant protein on the growth of S. salivarius K12. S. salivarius K12 was cultured with medium containing animal and plant protein, and the growth of this bacterium was measured every 2 hours by optical density using a spectrophotometer. The experiments were carried out three times in triplicate, and data are expressed as mean ± standard deviation. |
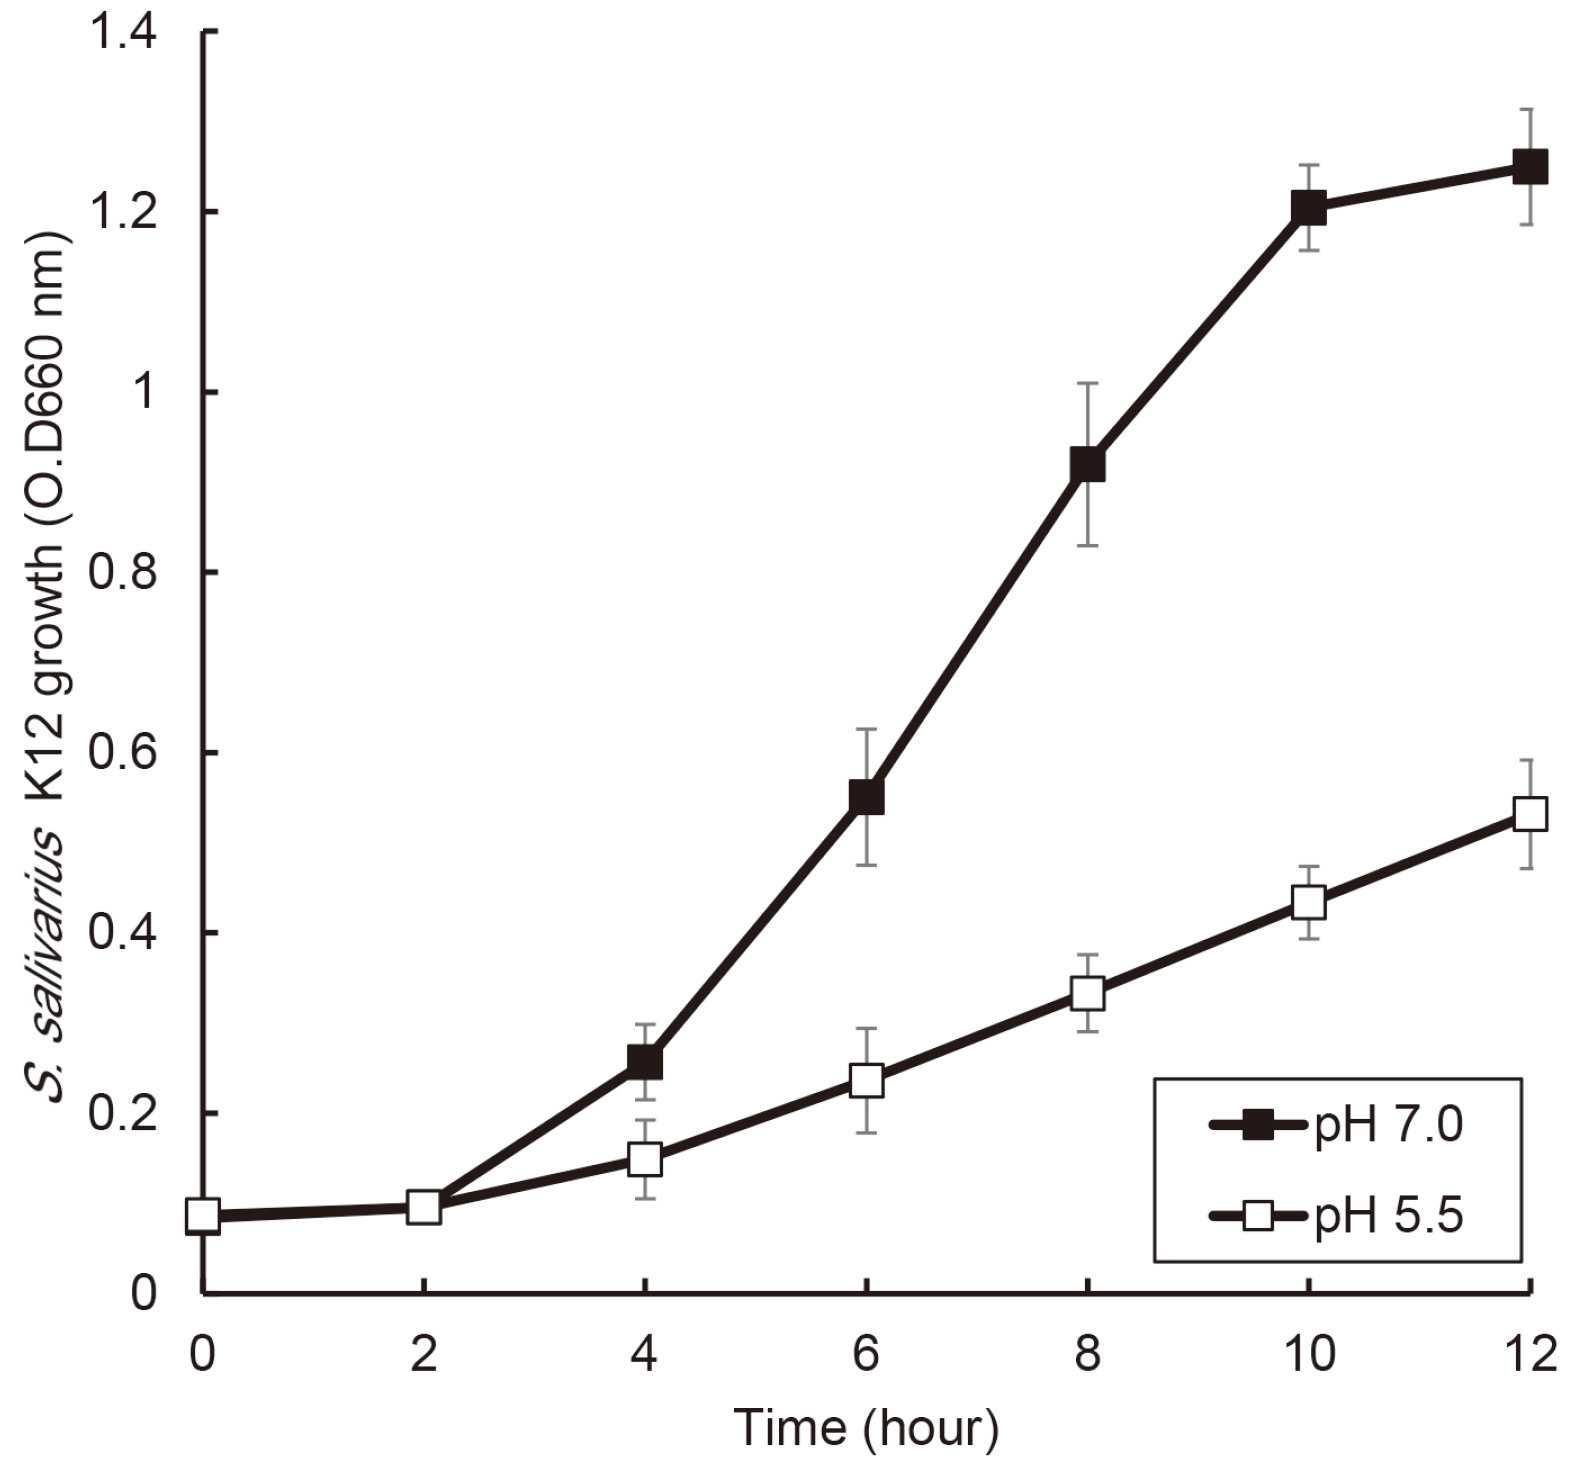
 | Fig. 2Comparison of effects of pH condition on the growth of S. salivarius K12. S. salivarius K12 was cultured in medium with pH 7.0 and pH 5.5, and the growth of this bacterium was measured every 2 hours by optical density using a spectrophotometer. The experiments were carried out three times in triplicate, and data are expressed as mean ± standard deviation. * indicates statistically significant differences between the two conditions. |
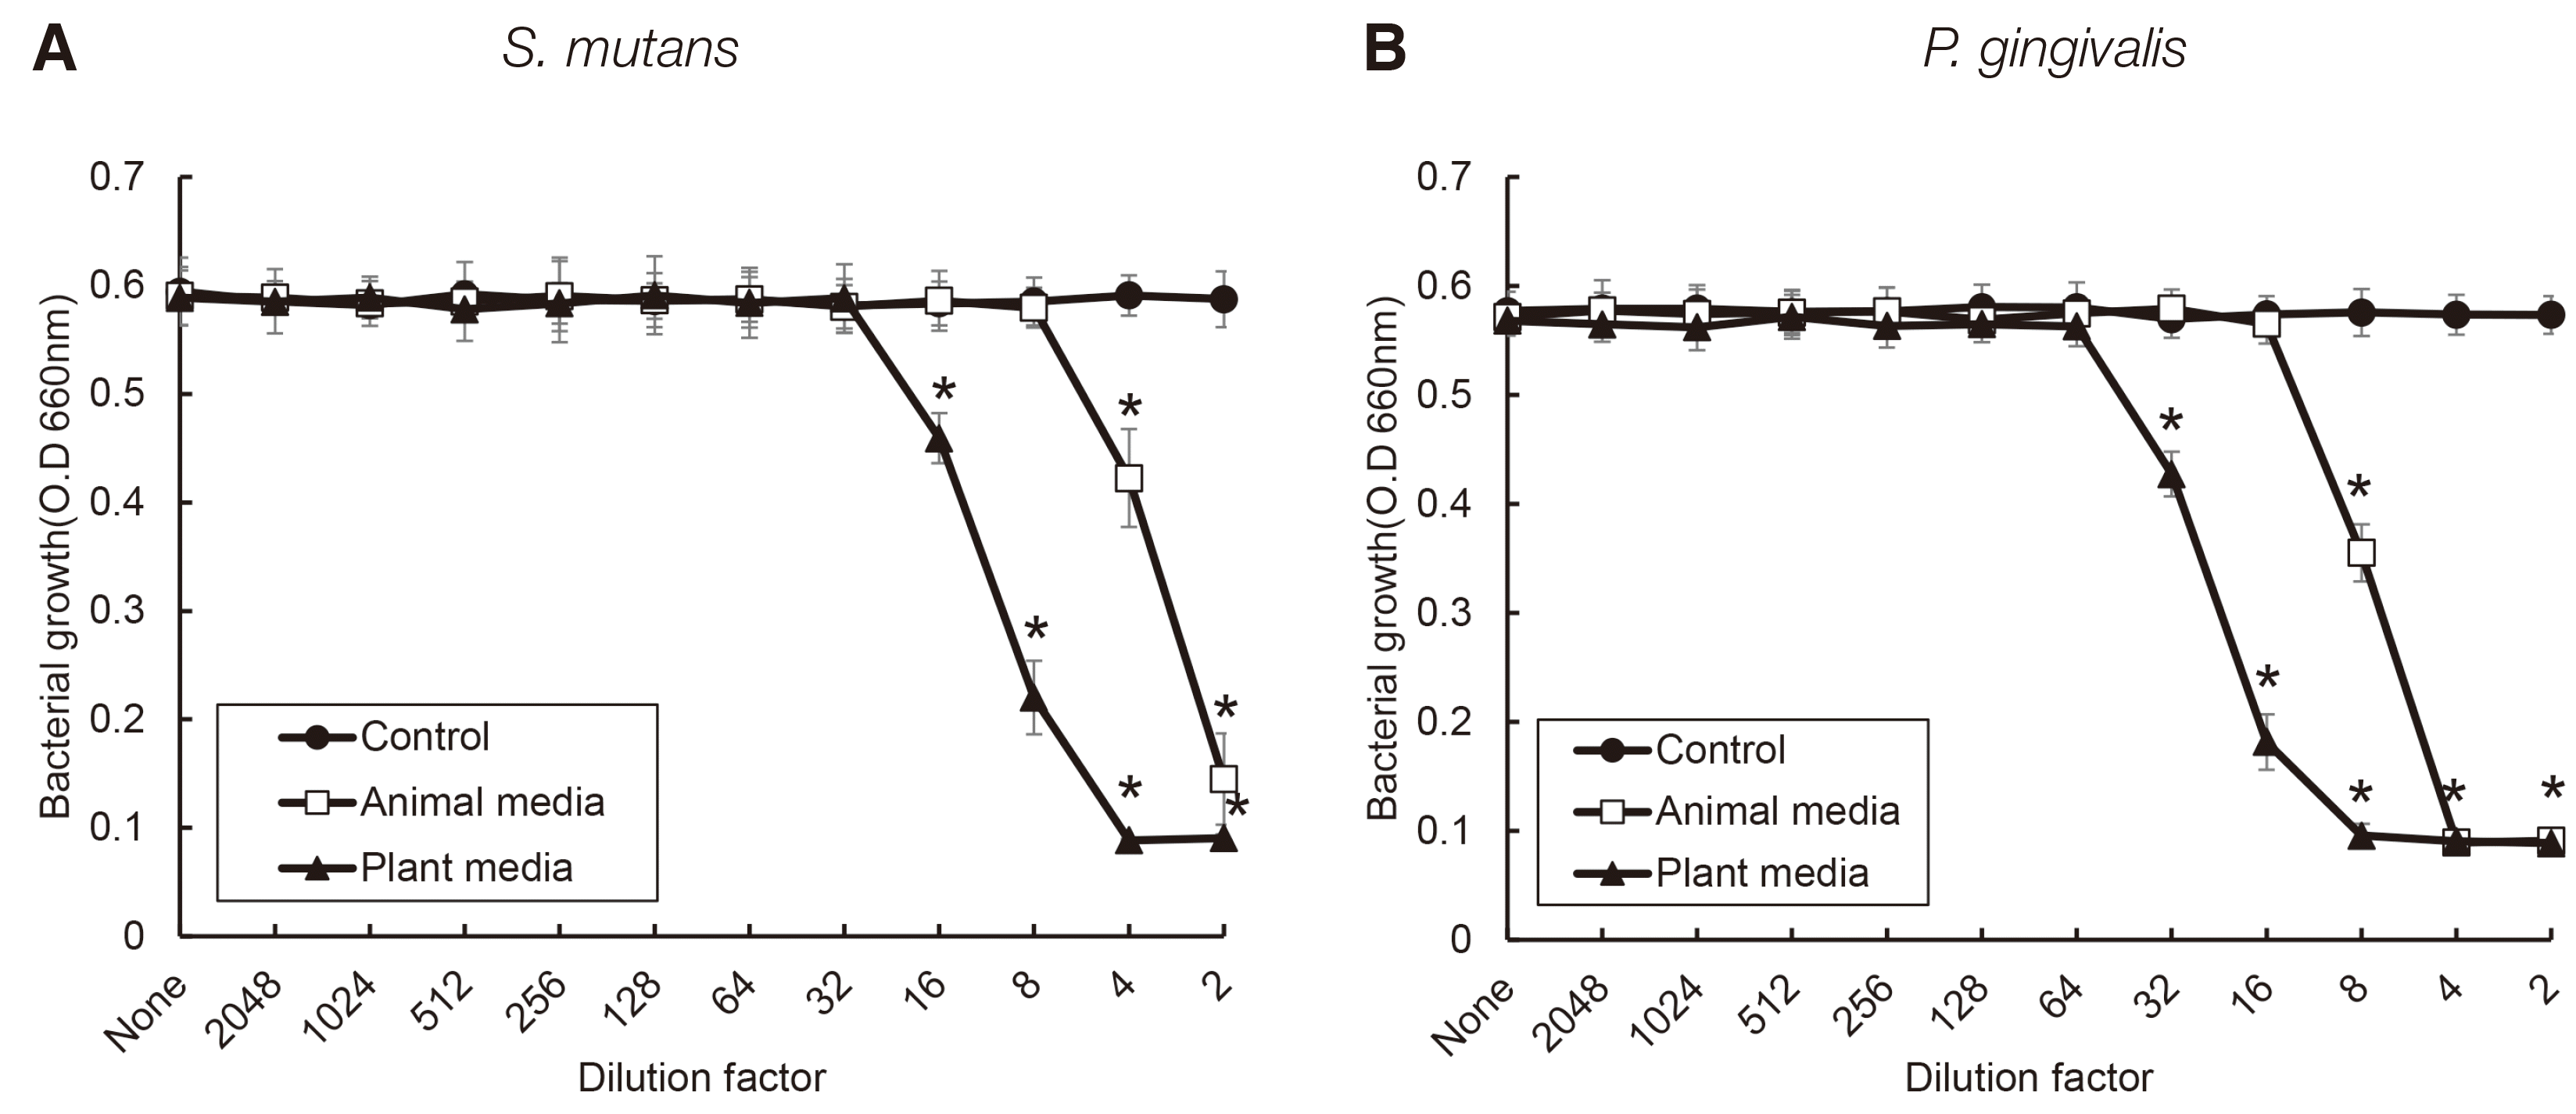
 | Fig. 3Antimicrobial activity of S. salivarius K12 against oral bacteria. The spent culture medium was collected from S. salivarius K12 cultured with medium containing animal and plant protein. S. mutans (A) and P. gingivalis (B) was incubated in the presence or absence of the SCM of S. salivarius K12. Bacterial growth was measured by a spectrophotometer. The experiments were carried out 4 times in duplicate, and data are expressed as mean ± standard deviation. * indicates statistically significant differences compared control group. |
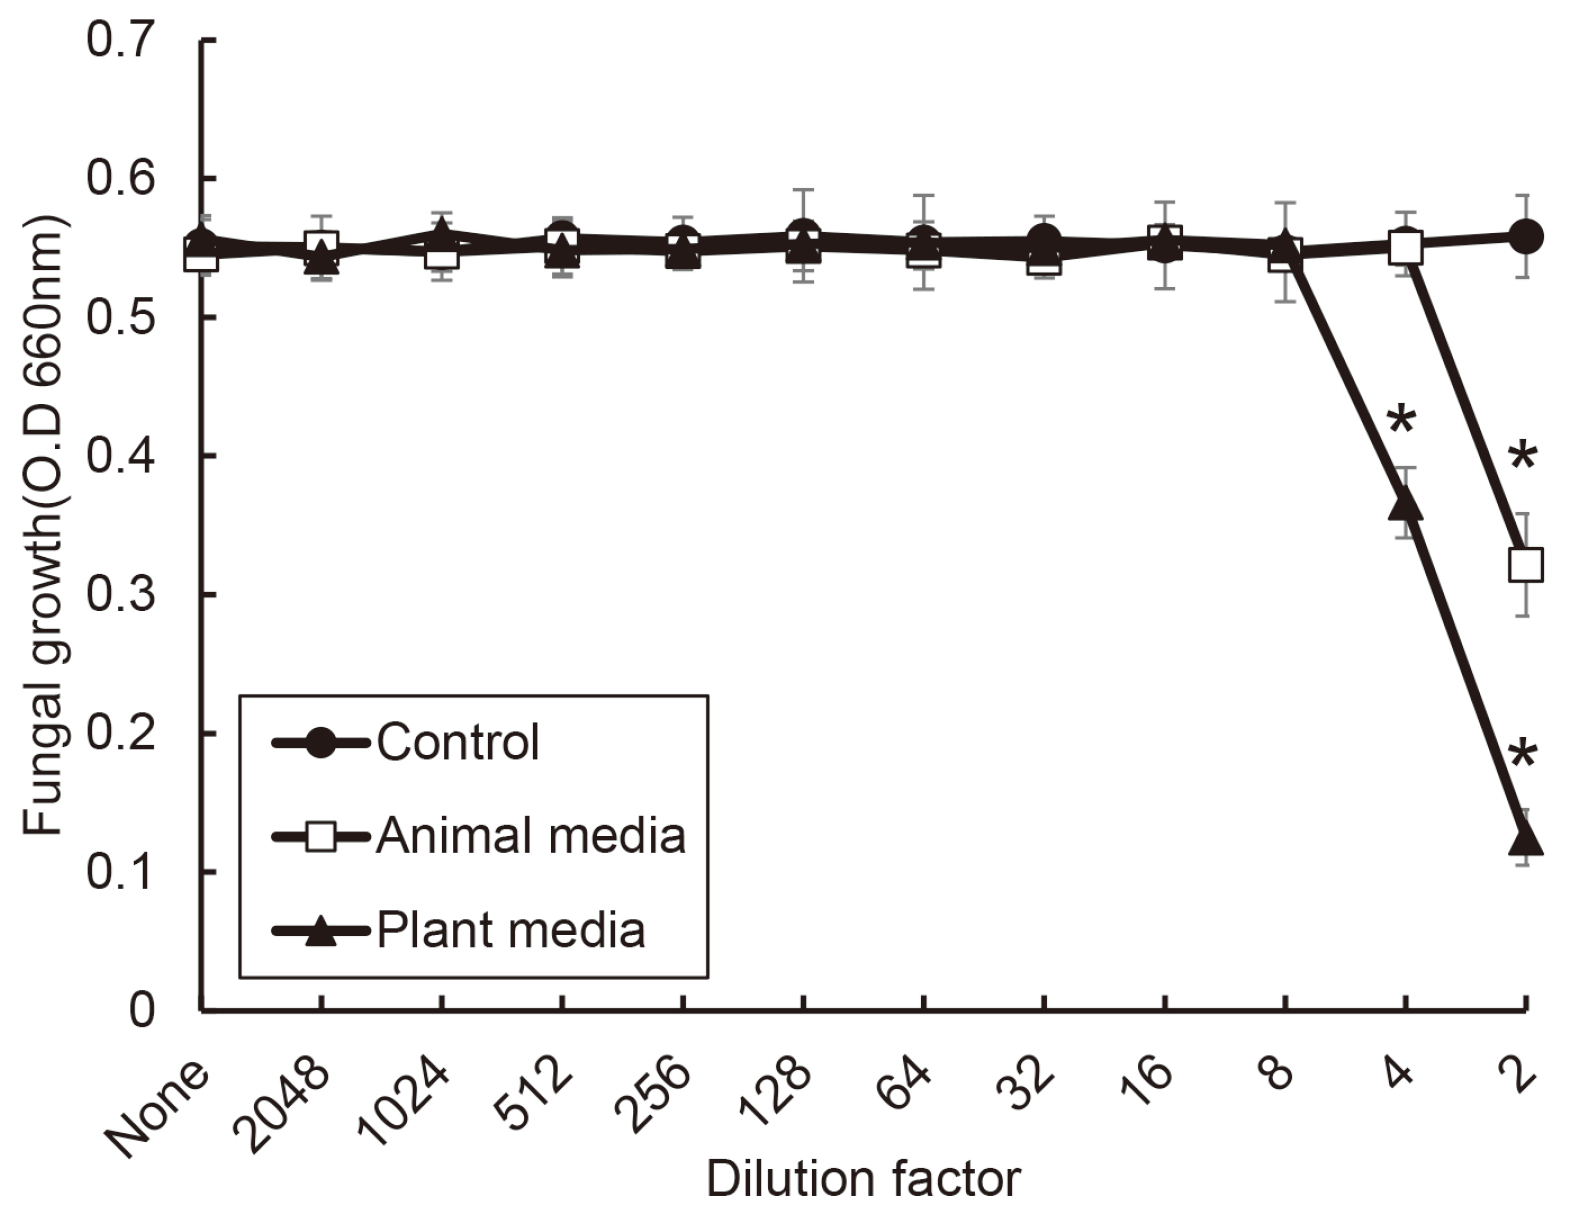
 | Fig. 4Antifungal activity of S. salivarius K12 against C. albicans. The spent culture medium was collected from S. salivarius K12 cultured with medium containing animal and plant protein. C. albicans was incubated in the presence or absence of the SCM of S. salivarius K12. Fungal growth was measured by a spectrophotometer. The experiments were carried out 3 times in duplicate, and data are expressed as mean ± standard deviation. * indicates statistically significant differences compared control group. |


 PDF
PDF Citation
 Print
Print


 XML Download