Introduction
In 1973, Duret coined the concept of computeraided design and computer-aided manufacturing (CAD/CAM) that produced dental prosthesis using intraoral optical images for the first time,
1 and in 1987, CEREC 1, a chair-side CAD/CAM system that performed digital design and machining using optical images, was introduced for the first time in the market by Mörmann.
2,
3 Since then, the frequency of using CAD/CAM in dentistry and orthodontics has been increasing, and the outcomes have improved. Thus, this methodology has been gradually replacing the traditional manufacturing method of prosthesis.
4,
5 When an intraoral scanner is used, acquired images are directly saved as computer data without conventional impression taking process of maxilla and mandibular arch. And it enables to fabricate prosthesis without a model in a simple case owing to an advancement of material and machining technology. A virtual model through intraoral scanning is applied to all areas of dental restoration including diagnosis, planning and treatment.
6
Moreover, discomfort of paitents during the procedure is known to be very little, and it can be even applied to the patient to whom impression taking is limited due to gag reflex. In addition, acquired data can be more easily organized and accessed, and the storage space is less required than the plaster cast. Also, it is easy to transfer data to laboratory technitians or other clinicians. With all these advantages, this method has been gradually more favored.
7,
8
Registration of maxillomandibular occlusal relationship is a process to transfer a plaster cast to an articulator at the actual occlusal state of a patient, and performed for diagnosis of mandibular motion and design of the occlusal surface of prosthesis.
9 For this, often mandibular border movements are reproduced on a semi-adjustable articulator after facebow transfer, and registering centric, lateral and anterior occlusions. There has been much progress in terms of material since Phillip registered the occlusal relationship on wax in the mid-18
th century.
10,
11 Polyvinylsiloxane, polyether, zinc oxide eugenol paste, plaster, resin and wax are used for registering occlusal relationship.
12-
14 Each material shows different reproducibility.
10,
15 Generally, for the reproduction of natural occlusion, the material for this purpose needs to be minimally resistant between teeth, and accurate when occlusion is being registered, and in addition, it should be strong and not change its volume after setting.
10,
11,
16 However, no materials have an absolute volume stability, and most of them change their volume over time.
17,
18 The accuracy of occlusal relationship is also different depending on how to register occlusion,
19,
20 and the maximum error over 0.5 mm has been reported.
21 If the occlusal relationship is not registered accurately, adjustment time of prosthesis in the oral cavity becomes longer, and if adjustment is too extensive, masticatory efficiency may be lowered, or the life span of the prosthesis reduced.
The early CEREC 1 (Sirona Dental System, Bensheim, Germany) did not have a function to calculate the three-dimensional relationship between an abutment and opposing dentition, and their movements. Therefore, it was applied only to the manufacture of an inlay, which was designed by referring to the shapes in a teeth library already saved without consideration of a relationship with opposing dentition. Consequently, individualization of crown design was impossible, and the final restoration finished with the manual adjustment in the oral cavity.
22 Recently, as the range of restoration manufactured by intraoral scanners has been widening, a process of registering static and dynamic occlusal relationship has become essential. Depending on the manufacturer of an intraoral scanner, the buccal interocclusal record scan is performed from the unilateral or bilateral molar region, and some scanners require anterior teeth. After acquiring the buccal interocclusal record scan, maxillary and mandibular data are registered and occluded on software.
22 Some systems display the shape of the occlusal contact surface and the contact strength so that how well occlusion of a patient has been registered can be checked. It has been reported that the errors generated by distortion of bite material and model mounting in articualtor could be reduced since this process was performed without any mediating material.
23 Furthermore, a system with a built-in virtual articulator simulation program can reproduce the mandibular movements and reflect them in the crown design by setting the relationship between the temporomandibular joint and the dentition of maxilla and mandible.
24,
25
Every manufacturer of intraoral scanners has different acquisition method of the buccal interocclusal record scan, interpretation of occlusal surface, and error correction algorithm. Although studies on the trueness and precision of intraoral scanner data, and the accuracy and clinical efficacy of the occlusal registration process have been constantly published, the scope of studies was limited to the quadrant arch or the range of scan data was not specified. If the area of the restoration by prosthesis is large or intraoral scan is performed for orthodontic treatment, the full arch data need to be dealt with, and there has been no study that analyzed the accuracy of occlusal reproduction by setting only the buccal interocclusal record data as an independent variable in the full arch scan.
The purpose of this study is to compare and analyze the accuracy of recognized occlusion according to the shape of the buccal interocclusal record scan for each intraoral scanner system. For this purpose, after angle between buccal surfaces of maxillary and mandibular molar teeth were gradually adjusted by quantitatively increasing the molar occlusal vertical dimension on the opposite side of the buccal interocclusal record scan on the same model, recognized interocclusal relationships through vestibular scan were two- and three-dimensionally evaluated. The null hypothesis of this study was that the interocclusal relationship of the data of maxillary and mandibular arch acquired through vestibular scan would not show any difference in the trueness according to the angle between buccal surfaces of upper and lower teeth and scanner systems.
Materials and Methods
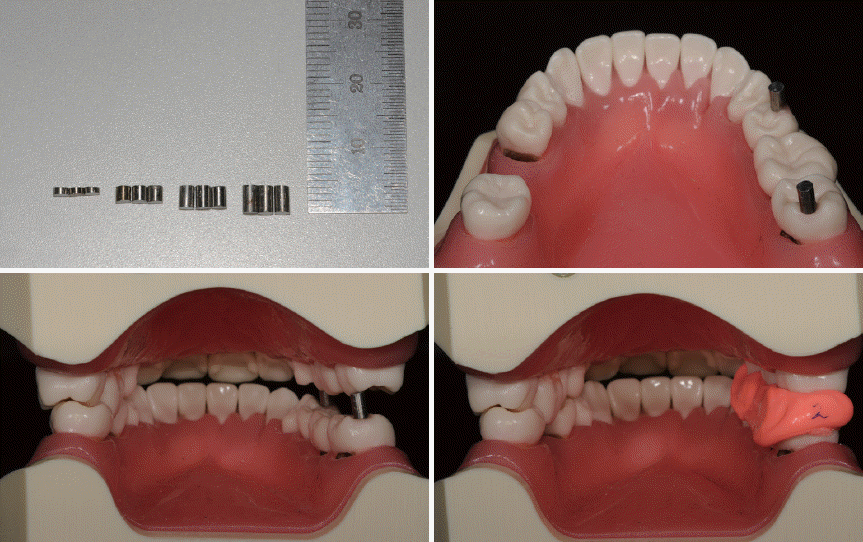
The phantom used for this study was manufactured using a dentiform model (Nissin Dental Product, Kyoto, Japan) that had a normal occlusal relationship with a missing left mandibular first molar. Then, 4 unilateral jigs with different heights were placed on the right molar, and thus occlusion was artificially made open. The 4 jigs were made with 1 mm, 2 mm, 3 mm and 4 mm, metal cylinder core embedded by polyvinylsiloxane bite registration material (Exabite, CG Corp., Tokyo, Japan) in order to avoid the vertical variation after repeated scans. Maxillary and mandibular full arches were scanned according to the recommended scan mode of each intraoral scanner. After that the buccal interocclusal records were scanned, only at the left side without the jig with a stable tripodism state where the dentiform model would not move during scanning (
Fig. 1).
Fig. 1
Unilateral 4 jigs were made with 1 mm, 2 mm, 3 mm and 4 mm metal cylinder core embedded by bite registration material.

The reference data were acquired using the industrial AICON 3D scanner (Breukmann, Braunschweig, Germany) that displayed a minimum accuracy of 8 μm. Used intraoral scanners were the CEREC Omnicam (Sirona Dental System), CS3500 (Carestream dental, Sydney, Australia), iTero (Align Technology Inc., Santa Clara, California), Trios (2nd generation, 3Shape dental systems, Copenhagen, Denmark) and True Definition (3M, Minnesota, USA). All the scan processes were performed following the manufacturer’s instructions, and the buccal vestibular interocclusal records were scanned five times for each vertical dimension group. The CEREC Omnicam and CS3500, Trios that could replicate the scan data of maxillary and mandibular arch were classified into the replication group, and to exclude the effect of deviations in maxillary and mandibular data themselves, only the buccal interocclusal scans were performed after replicating scans. The iTero and True Definition that could not replicate the scan data were classified into the repeated scan group, and a total of 5 scans were performed for the maxillary, mandibular arch and the buccal interocclusal relationship respectively.
The scan data verification software (Geomagic Verify; 3D Systems, North Carolina, USA) was used to measure and assess the accuracy of the buccal interocclusal record. Intraoral scan data were aligned with fixed reference points on the maxilla teeth of the reference data using the best-fit algorithm (
Fig. 2A -
2C), and based on this, superimposition and cross-section analyses conducted. Superimposition analysis was conducted by superimposing reference data and intraoral scanner data to calculate and analyze the mean value of their three-dimensional deviations (
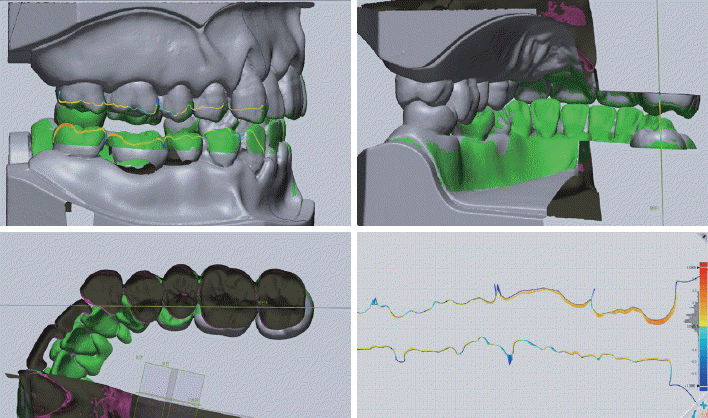
Fig. 2D). In cross-section analysis, the degree and direction of deviations were analyzed in a virtual reference plane which passes through the maxillary molar palatal cusp tip and the mandibular molar central fossa (
Fig. 3).
Fig. 2
Intraoral scan data were aligned with reference points of maxillary arch and refined with best fit algorithm before mandibular teeth deviations were measured.
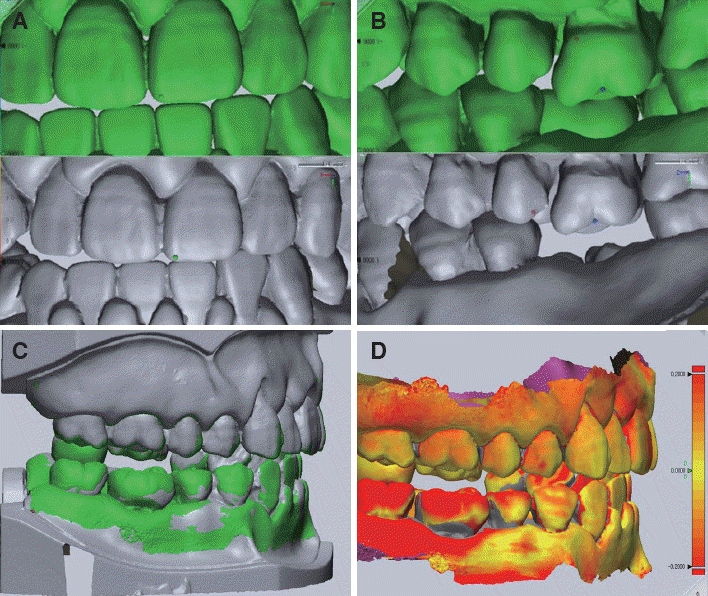

Fig. 3
Reference plane that passes the palatal cusp of maxillary first molar and the central fossa of mandibular first molar was set. Cross-section images of the reference plane were obtained and deviations of occlusal surface from reference scanner were calculated.

Statistical analysis was carried out using SPSS 23.0 for Windows (IBM Co., Armonk, USA). The 2-Way ANOVA was performed to analyze deviations by each scanner from the reference data according to the height of the jig on the superimposition study and deviations of the distance between upper and lower teeth on the cross-section study. Differences in the mean values between the replication group and the repeated scan group according to the height of the jig were also analyzed by the 2-Way ANOVA (α = 0.05).
Results
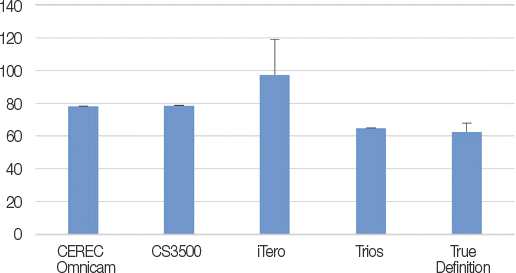
The reference data acquired with the AICON 3D scanner were compared with the maxillary arch data scanned with each of intraoral scanners, and the variations probable in the arch itself assessed. The CEREC Omnicam, CS3500 and Trios that could scan the arch only once displayed the variations of 78.3 μm, 78.6 μm and 64.8 μm, respectively. The iTero and True Definition that had to scan the arch whenever the buccal interocclusal record was scanned showed the variations of 97.4 ± 21.3 μm and 62.5 ± 5.3 μm (
Fig. 4).
Fig. 4
Mean deviations of maxillary arch. Phantom was scanned once and duplicated for each buccal vestibular interocclusal record registration in CEREC Omnicam, CS3500, Trios, whereas in iTero and True Definition, it was scanned repeatedly with interocclusal record registration (unit: μm).

Deviations between the reference data and intraoral scan data were three-dimensionally analyzed by superimposing the two sets of data (
Fig. 5,
6). The trueness displayed by each scanner depending on the height of the metal cylinder is shown in
Table 1.
Fig. 5
Mean deviations of intraoral scanner in superimposition study (unit: μm).
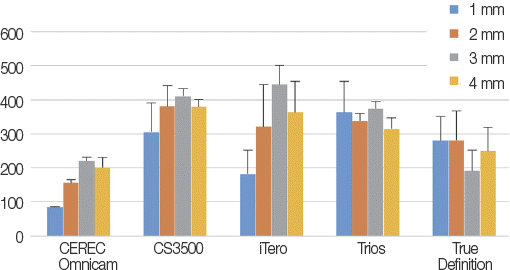

Fig. 6
The color maps of deviations shown with 1 mm open condition. (A) CEREC Omnicam, (B) CS3500, (C) iTero, (D) Trios, (E) True Definition.
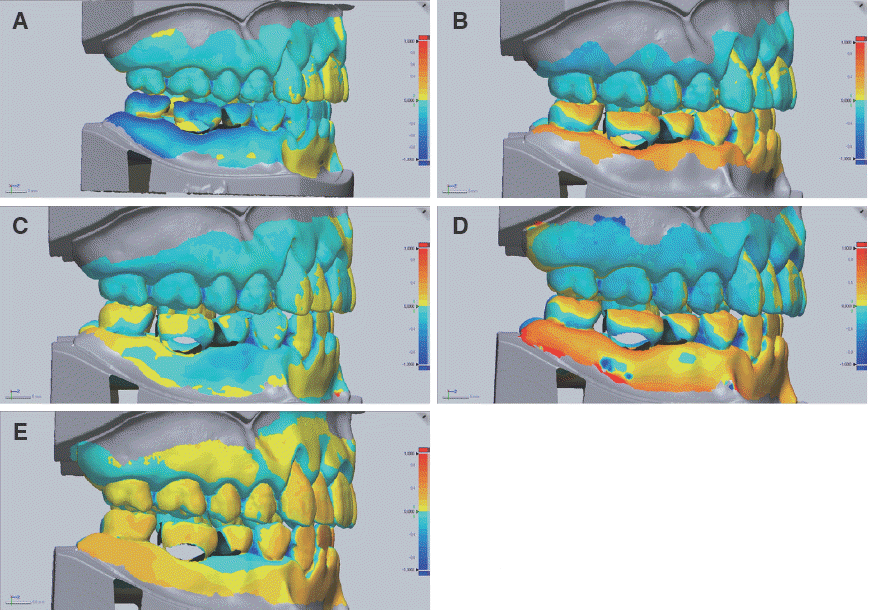

Table 1
The mean deviations of intraoral scanner in superimposition study (unit: μm)
|
Size |
Scanner |
F (P value) |
|
CEREC Omnicam (a) |
CS3500 (b) |
i Tero (c) |
Trios(d) |
True Definition (e) |
Scanner (A) |
Size (B) |
(A)×(B) |
|
|
|
|
|
|
9.121**
|
|
|
|
1 mm (1) |
84.5 ± 1.3 |
305.2 ± 85.8 |
181.0 ± 70.7 |
293.2 ± 84.2 |
280.0 ± 70.8 |
(.000)(b)=(d)=(e)>(a),(b)=(d)=(e)=(c),(c)=(a) |
|
|
|
|
|
|
|
|
6.779**
|
|
|
|
2 mm (2) |
157.0 ± 10.3 |
380.8 ± 59.6 |
320.7 ± 123.4 |
337.5 ± 21.1 |
281.4 ± 86.4 |
(.001)(b)=(d)=(c)>(a),(b)=(d)=(c)=(e),(e)=(a) |
|
|
|
|
|
|
|
|
41.740**
|
|
|
|
3 mm (3) |
221.1 ± 11.5 |
411.1 ± 22.3 |
444.7 ± 57.1 |
374.3 ± 22.0 |
192.3 ± 59.0 |
(.000),(c)=(b)=(d)>(a)=(e) |
|
|
|
|
|
|
|
|
9.093**
|
|
|
|
4 mm (4) |
202.0 ± 29.7 |
378.8 ± 20.9 |
363.5 ± 91.4 |
314.5 ± 31.2 |
248.8 ± 70.2 |
(.000)(b)=(c)>(e)=(a),(b)=(c)=(d),(d)=(e) |
|
|
|
F (P value) |
65.708** (.000)(3)=(4)>(2)>(1) |
3.423* (.043)(3)>(1),(3)=(2)=(4),(2)=(4)=(1) |
7.647** (.002)(3)=(4)>(1),(3)=(4)=(2),(2)=(1) |
2.678 (.082) |
.026 (.215) |
34.954** (.000)(b)>(d)=(c)>(e)>(a) |
12.044** (.000)(3)=(4)=(2)>(1) |
3.959** (.000) |

In superimposition analysis, the deviations for each scanner were shown to be in the decreasing order of the CS3500 (369.0 μm), Trios (347.5 μm), iTero (327.5 μm), True Definition (250.5 μm) and CEREC Omnicam (165.5 μm). And bite raising with the height of 2, 3 and 4 mm showed higher deviations than that with 1 mm. The post hoc test showed that the variations for each scanner at all the heights of the jig were significantly different. At 1 mm, the mean deviations of CS3500, Trios and True Definition were significantly higher those of by the CEREC Omnicam (
P < 0.01), and at 2 mm, the mean deviations by the CS3500, Trios and iTero were significantly higher than those by the CEREC Omnicam (
P < 0.01). In addition, at 3 mm, the mean deviations were higher with the iTero, CS3500 and Trios than with the CEREC Omnicam and True Definition (
P < 0.01) while at 4 mm, the mean deviations of the CS3500 and iTero were significantly higher than those of the True Definition and CEREC Omnicam (
P < 0.01). The deviations depending on the height of the jig for each scanner showed statistically significant differences for all scanners except the Trios and True Definition. The mean deviations in the Omnicam at each height were in the decreasing order of 3 mm, 4 mm, 2 mm and 1 mm, and showed a statistically significant difference (
P < 0.01). In the CS3500, the mean deviation at 3 mm was significantly higher than those at 1 mm, and those at 2 mm and 4 mm were intermediate values (
P < 0.05). In the iTero, the mean deviations at 3 mm and 4 mm were significantly higher than that at 1 mm, and the deviation at 2 mm was an intermediate value (
P < 0.01). In the superimposition data, the difference in the mean values between the replication group and repeated scan group according to the height of the jig was verified to be statistically significant (
P < 0.05,
Table 2). In the replication group, the mean value at 3 mm was significantly higher than that at 1 mm (
P < 0.05) while in the repeated scan group, the mean values were not significantly different (
P > 0.05). The mean deviations between the replication group and the repeated scan group at each height of the jig were not significantly different (
P > 0.05).
Table 2
Two-way ANOVA for mean on overlapped experimental data between replication group and repeated scan group
|
Size |
Scanner (a) |
F (P value) |
|
Omincam-Trios-CS3500 |
iTero-True Definition (b) |
Scanner (A) |
Size (B) |
(A) × (B) |
|
1 mm (1) |
0.23 ± 0.12 |
0.23 ± 0.08 |
-.064 (.949) |
|
|
|
2 mm (2) |
0.29 ± 0.11 |
0.30 ± 0.10 |
-.217 (.830) |
|
|
|
3 mm (3) |
0.34 ± 0.09 |
0.32 ± 0.14 |
.370 (.715) |
|
|
|
4 mm (4) |
0.30 ± 0.08 |
0.31 ± 0.10 |
-.215 (.831) |
|
|
|
F (P value) |
2.988* (.039)(3)>(1), (3)=(4)=(2),(4)=(2)=(1) |
1.315 (.285) |
.001 (.974) |
3,891* (.011)(3)>(1),(3)=(4)=(2),(4)=(2)=(1) |
.081 (.970) |

The two-dimensional deviations obtained from the cross-section analysis on the reference plane are shown in
Table 3. Decreased occlusal vertical dimension due to closer intermaxillary space was shown as the positive value, while increased occlusal vertical dimension as the negative value (
Fig. 7,
8). The analysis of deviations according to the scanner and the height of the jig on the cross-section data showed that the interactions between the scanner and the height of the jig were all statistically significant (
P < 0.01). In the analysis between scanners, the deviations were in the decreasing order of the CS3500 (312.5 μm), Trios (217.0 μm), iTero (-77.3 μm), True Definition (-106.5 μm) and CEREC Omnicam (-242.8 μm). And according to the height of the jig, deviations at 3 mm were higher than those at other heights. In the post hoc test, the mean values between scanners at all the heights of the jig showed statistically significant differences. At 1 mm, deviations were the highest in the Trios and CS3500, and the lowest in the CEREC Omnicam with differences statistically significant differences (
P < 0.01). At 2 mm and 3 mm, the deviations were also high in the CS3500 and Trios, and low in the CEREC Omnicam with the statistically significant differences (
P < 0.01). At 4 mm, the deviations were higher with CS3500, and lower with the True Definition, CEREC Omnicam and iTero with significant differences (
P < 0.01). The mean deviations according to the height of the jig with each scanner showed statistically significant differences except the CEREC Omnicam. With the CS3500, the 3 mm and 4 mm heights showed significantly higher deviations than the 1 mm height (
P < 0.01) while with the iTero, the 1 mm and 3 mm heights had significantly higher deviations than the 4 mm height (
P < 0.01). With the Trios and True Definition, the 3 mm height showed significantly higher deviations than other heights (for both,
P < 0.01). On the cross-section data, the deviations according to the replication group, the repeated scan group and the height of the jig showed statistically significant differences (
P < 0.01,
Table 4). In the post hoc analysis, the mean deviations between the replication group and the repeated scan group showed statistically significant differences at the 2 mm and 4 mm heights of the jig. At 2 mm, the mean deviations of the replication group was higher than those of the repeated scan group, and their difference statistically significant at the confidence level of 0.05 (
P < 0.05). At 4 mm, the mean deviations of the replication group were also higher than those of the repeated scan group, and their differences were statistically significant at the confidence level of 0.01 (
P < 0.01). Within the repeated scan group, the 3 mm height showed significantly higher deviations than the 2 mm and 4 mm heights (
P < 0.01) while the deviations within the replication group did not show statistically significant differences according to the height of the jig (
P > 0.05).
Fig. 7
Two-dimensional deviations of intraoral scanner data in a reference plane. The positive value means that upper and lower teeth got closer and the negative value means they got farther from each other (unit: μm).
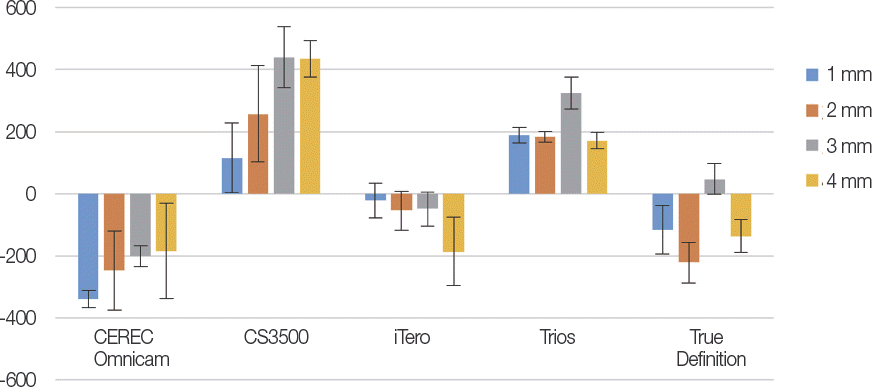

Fig. 8
The color maps of two-dimensional deviations in cross-section. Blue means negative, red means positive. (A) CEREC Omnicam, (B) CS3500, (C) iTero, (D) Trios, (E) True Definition.
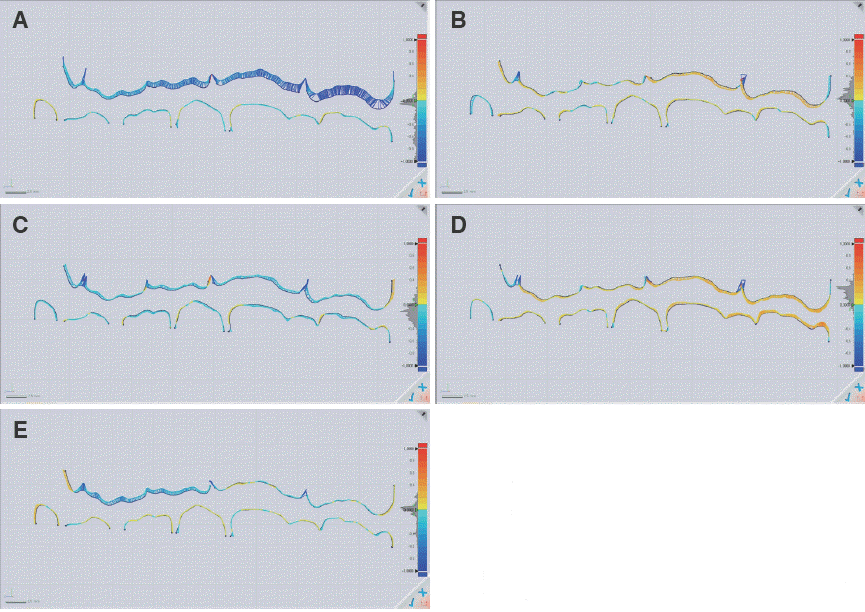

Table 3
Two-dimensional deviations of intraoral scanner data in cross-section view (unit: μm)
|
Size |
Scanner |
F (P value) |
|
CEREC Omnicam (a) |
CS3500 (b) |
iTero (c) |
Trios (d) |
True Definition (e) |
Scanner (A) |
Size (B) |
(A) × (B) |
|
|
|
|
|
|
53.994**
|
|
|
|
1 mm (1) |
-338.9 ± 28.2 |
166.3 ± 112.2 |
-22.5 ± 56.5 |
189.2 ± 25.1 |
-166.4 ± 77.7 |
(.000)(d)=(b)>(c)>(e)>(a) |
|
|
|
|
|
|
|
|
27.134**
|
|
|
|
2 mm (2) |
-246.8 ± 126.6 |
258.0 ± 155.2 |
-53.6 ± 62.5 |
182.5 ± 16.8 |
-221.5 ± 66.4 |
(.000)(b)=(d)>(c)>(a),(c)=(e), (e)=(a) |
|
|
|
|
|
|
|
|
92.087**
|
|
|
|
3 mm (3) |
-201.3 ± 34.5 |
439.6 ± 98.5 |
-47.6 ± 55.2 |
324.9 ± 50.8 |
48.4 ±50.0 |
(.000)(b)=(d)>(e)=(c)>(a) |
|
|
|
|
|
|
|
|
44.246**
|
|
|
|
4 mm (4) |
-183.8 ± 153.5 |
435.8 ± 58.8 |
-186.2 ± 111.4 |
171.1 ± 27.1 |
-136.5 ± 53.1 |
(.000)(b)>(d)>(e)=(a)=(c) |
|
|
|
F (P value) |
2.319 (.114) |
7.374** (.003)(3)=(4)>(1),(3)=(4)=(2),(2)=(1) |
4.852* (.014)(1)=(3)>(4),(1)=(3)=(2),(2)=(4) |
24.776** (.000)(3)>(1)=(2)=(4) |
17.386** (.000)(3)>(4)=(1)=(2) |
171.374** (.000)(b)>(d)>(c)=(e)>(a) |
16.019** (.000)(3)>(4)=(2)=(1) |
4.879** (.000) |

Table 4
Two-way ANOVA for mean on cross-section experimental data
|
Size |
Scanner |
F (P value) |
|
Omincam-Trios-CS3500 (a) |
iTero-True Definition (b) |
Scanner (A) |
Size (B) |
(A) × (B) |
|
1 mm (1) |
0.01 ± 0.26 |
-0.09 ± 0.10 |
1.148 (.263) |
|
|
|
2 mm (2) |
0.06 ± 0.25 |
-0.14 ± 0.11 |
2.367* (.027) |
|
|
|
3 mm (3) |
0.19 ± 0.30 |
0.00 ± 0.07 |
1.955 (.063) |
|
|
|
4 mm (4) |
0.14 ± 0.28 |
-0.16 ± 0.09 |
3.320** (.003) |
|
|
|
|
6.001**
|
|
|
|
|
F (P value) |
1.320 (.227) |
(.002)(3)>(2)=(4), (3)=(1),(1)=(2)=(4) |
19.397** (.000) |
2.022 (.116) |
.857 (.467) |

Discussion
In previous studies, it was found that the scan of a quadrant arch showed a measurement error of 40 μm or lower,
26-
28 while the scan of the full arch showed an error of up to 90 μm, and a larger error on the specific surface.
29-
31 In this study, in the comparison of the maxillary model scan data, the scan data by all the intraoral scanners except the iTero (97.4 ± 21.3 μm) showed errors of less than 90 μm, which confirms that the overall performance of the intraoral scanners is similar to the results in previous studies. Since the intraoral scanner acquires the data by moving a relatively small camera through the curved arch, and repeats analyzing and stitching the scanned surface fragments to create the overall shape, distortion occurs inevitably. Flügge compared the intraoral and extraoral digital impressions that were taken with the iTero and desktop scanners, and concluded that the extraoral scan data were more accurate than the intraoral data.
32 Sorensen reported that the digital impression was substantially exaggerated horizontally in the distal ends of the arch in an analysis of the accuracy of scanning the full arch using various intraoral scanners.
33 Other studies
31,
32 also suggested that the distortion of the full arch data became more severe in the horizontal direction toward the distal end of the arch, and the accuracy was poorer in the distal surface of the molar region, the labial surface of the anterior teeth, and the interdental space of the full arch. It is considered that this horizontal deformation is caused by the inaccuracy of software during the course of combining the scanned data.
30 In addition, artifacts may arise in the process of acquiring optical data, and more deformation is expected as the optical artifacts increases since such optical artifacts are corrected by the maximum mean value. In combination with these technical errors, the presence of saliva, the reflection of teeth and surrounding tissues, and the movements of patients and operator’s hand during the scanning process are common problems that lead to uncertainty and deformation, and eventually cause errors in the final data.
34 For these reasons, while a small range of partial arch can be digitalized with high accuracy, a large range of structure such as the full arch is less accurate.
35
The purpose of this study was to compare and analyze the accuracy of occlusal relationship recognized in the buccal vestibular interocclusal record scan using various intraoral scanner systems. For this purpose, the occlusion on the opposite right half was gradually opened to vary the buccal surface angle of the upper and lower teeth in the left molar region where the buccal interocclusal record was taken. Superimposition analysis of reference data and mandibular data upon alignment with reference points of maxilla showed that the CS3500 had the largest deviation from the reference data and the CEREC Omnicam had the smallest deviation. When the angle of the buccal surface increased by up to 3 mm, the deviation also increased, but as angle increased with 4 mm, the deviation did not increase accordingly. Analysis of the deviation between the upper and lower teeth on the cross-section revealed that the CS3500 showed the largest deviation from the reference data, and the iTero showed the smallest. In addition, according to the angle of the buccal surface between maxillary and mandibular teeth, a large deviation was observed at 3 mm. Deviations tended to be large at 3 and 4 mm for the Trios and CS3500, and at 1 and 2 mm for the True Definition. No differences were observed in the iTero and CEREC Omnicam. Therefore, the null hypothesis that the occlusal relationship of maxillary and mandibular arch acquired through buccal interocclual record at different scan angle would not show any differences was rejected.
In the superimposition analysis, while deviations of the CS3500 and iTero increased with the increase of the disclusion up to 3 mm, no differences were observed in other scanners. In the cross-section analysis, the CS3500, iTero and Trios showed a tendency of the increase in deviations with the increase of disclusion, but on the other hand, the CEREC Omnicam showed a decreasing tendency. If occlusion is registered at a higher vertical dimension, the prosthesis will show a higher occlusal dimension, and if the deviation is not large, the prosthesis can be placed on the oral cavity on the day by direct adjustment from the chair-side. However, if occlusion is at too low vertical dimension and the maxilla and mandible are too close so that the prosthesis does not occlude, remake may be necessary. Subsequently care should be taken in intraoral scanner systems with such tendency.
In the replication group where scan data could be replicated, the accuracy of occlusal relationship was measured by only scanning the buccal interocclusal record for each group with different buccal surface angles with zigs on the opposite site. Although it was expected that the accuracy of the occlusal relationship would be better in this replication group, the superimposition analysis showed that there was no significant difference between the replication group and the repeated scan group by scanner systems and by the angle between buccal surfaces of maxillary and mandibular teeth. In the cross-sectional analysis, the repeated scan group was more accurate than the replication group by the system. The replication group generally showed large deviations regardless of the height of the jig while the repeated scan group showed differences according to the height of the jig and the value was generally small. The reasons are assumed to be that the replication group might have inaccurate bite registration performance, or the repeated scan group might produce less distortions in images or a better stitching accuracy. Finally, it is likely that the deviations by the CS3500 has degraded the mean values in the replication group.
Vergos et al. measured the accuracy of the interocclusal record obtained with the rubber registration material using the metal model, and found that there was a difference of approximately 0.5 mm,
21 which is consistent with the results of this study. In this study, since only the left vestibular interocclusal record was utilized for the registration of relationship between maxilla and mandible, the occlusal trueness of approximately 0.5 mm was considered to be the limitation.
Keeling et al. studied the trueness of the bite registration of a model scanner in the maxillary and mandibular full-arch model.
36 They performed the interocclusal record scan of the mandible five times at the right, protrusive, retrusive, inferior and superior positions, and then, measured the reproducibility, which yielded the deviations of -15 ~ 93 μm. Hence, they suggested that the buccal interocclusal record registration was more reproducible than the conventional analog bite registration method. In addition, they reported that the deviation of the molar region (46 μm) was larger than that of the anterior region (22 μm), which could lead to an interpretation that the positional accuracy at the region distant from the interocclusal record scan was lower compared to the region of the interocclusal record scan. Solaberrieta et al.
37 analyzed the impact of the number and size of the interocclusal record scan on the trueness when the virtual bite registration of a full arch plaster cast was scanned with the ATOS Compact Scan 5M, an industrial precision scanner. The study suggested that the trueness became higher as the range of virtual occlusion registration was smaller, the number of virtual occlusion registration greater, and the scan interval longer. However, unlike this study that compared the distance between the actual opposing teeth, their study analyzed the number of occlusion points, and thus, direct comparison is difficult. Furthermore, Solaberrieta et al.
38 conducted a similar study with four patients using four types of intraoral scanners (Trios, Lava COS, Zfx and Intrascan), and found that the scan of the occlusal surface had to be performed at two or more regions and as the distance between regions for the bite registration became further, the outcome was better. However, if more than one bite registrations are not available due to the type of the scan program, merging of upper and lower arch should proceed only with the scan of the one side of the arch. This study attempted to determine the occlusal relationship of the opposite side of the arch by scanning only one side in virtual bite registration. Recently, although studies on the accuracy of the buccal interocclusal record of intraoral scanners have been reported, there was no study that has directly measured the cross-section to find the distance between maxillary and mandibular teeth. In addition, this study has an additional significance in that it has compared and assessed multiple intraoral scanner systems.
In this study, the occlusion was reconstructed only with the relationship between the buccal surfaces of maxillary and mandibular teeth, the characteristics of the buccal interocclusal record scna. In order to analyze only the buccal interocclusal record as an evaluation factor, the disclusion on the opposite side was gradually increased to measure different angles between buccal surfaces for comparative evaluation. While the buccal bite registrations were performed at the left molar region, the deviations of the actual occlusal gap were measured at the right molar region, and therefore, the error might be exaggerated.
Since this study was carried out using a teeth model made of resin that has different surface reflections from natural teeth, differences from the actual oral cavity exist. The conditions that make the scan in the actual oral cavity difficult, such as patient’s movement, saliva control and the degree of mouth opening, could not be reproduced. This study also used the best fit algorithm to perform three-dimensional analysis of the scanned model with free curved surface shape. Ender et al.
29 reported that the comparison results might vary depending on the digitization method, the reference scanner, the best-fit alignment method and the number and distribution of surface data points. This study alone is not enough to compare and evaluate the performance of specific oral scanner systems for the trueness of the interocclusal record scan, and further studies are needed by adding more specific comparison factors.
Conclusion
In this study, unilateral interocclusal records were taken while vertical dimensions were gradually increased on the opposite site only. The scan data were aligned with the reference points of maxillary arch, and subsequently, the superimposition analysis of the mandibular data and the cross-section analysis were performed to analyze the interocclusal relationship between upper and lower teeth. As a result, the following conclusion was obtained.
The superimposition analysis found that the CS3500 showed the largest deviation from the reference and the CEREC Omnicam showed the smallest. As the angle between buccal surfaces increased up to 3 mm disclusion group, the deviation became larger, but no more increase was observed in 4 mm disclusion group.
In the cross-section analysis, the deviations between upper and lower teeth were the largest with the CS3500 and the smallest with the iTero, and the deviation the largest in the 3 mm group. Deviations were larger in the Trios and CS3500 with the smaller angle between buccal surfaces while the True Definition had larger deviations with the larger angle between buccal surfaces. On the other hand, no difference was shown in the iTero and CEREC Omnicam.


 PDF
PDF Citation
 Print
Print


 XML Download