Introduction
Methods
1. Participants and study design
2. Data collection and measurements
3. Study outcomes
4. Statistical analysis
Results
1. Clinical characteristics
Table 1.
| Characteristics | Total (n=253) | Ketamine group (n=112) | Control group (n=141) | p-value |
|---|---|---|---|---|
| Sex | 0.665 | |||
| Male | 145 (57.3) | 62 (55.4) | 83 (58.9) | |
| Female | 108 (42.7) | 50 (44.6) | 58 (41.1) | |
| Age (yr) | 64.8±11.6 | 61.5±11.3 | 67.4±11.2 | <0.001 |
| Body mass indexa) | 0.656 | |||
| <23 kg/m2 | 103 (40.7) | 48 (42.9) | 55 (39.0) | |
| 23–24.9 kg/m2 | 23 (9.1) | 15 (13.4) | 8 (5.7) | |
| ≥25 kg/m2 | 11 (4.3) | 5 (4.5) | 6 (4.3) | |
| Data not provided | 116 (45.8) | 44 (39.3) | 72 (51.1) | |
| Diagnosisb) | 0.886 | |||
| Lung cancer | 40 (15.8) | 11 (9.8) | 29 (20.6) | |
| Stomach cancer | 36 (14.2) | 15 (13.4) | 21 (14.9) | |
| Pancreatic cancer | 34 (13.4) | 21 (18.8) | 13 (9.2) | |
| Rectal cancer | 23 (9.1) | 12 (10.7) | 11 (7.8) | |
| Hepatocellular carcinoma | 20 (7.9) | 5 (4.5) | 15 (10.6) | |
| Others | 100 (39.5) | 48 (42.9) | 52 (36.9) | |
| Time since cancer diagnosis | 0.768 | |||
| <1 yr | 101 (39.9) | 44 (39.3) | 57 (40.4) | |
| 1–3 yr | 83 (32.8) | 37 (33.0) | 46 (32.6) | |
| ≥3 yr | 69 (27.3) | 31 (27.7) | 38 (27.0) | |
| Smoking status | 0.821 | |||
| Smoker | 47 (18.6) | 22 (19.6) | 25 (17.7) | |
| Non-smoker | 206 (81.4) | 90 (80.4) | 116 (82.3) | |
| Alcohol consumption | 0.848 | |||
| Yes | 45 (17.8) | 21 (18.8) | 24 (17.0) | |
| No | 208 (82.2) | 91 (81.2) | 117 (83.0) | |
| Length of hospital stay (day) | 23.7±43.8 | 23.2±38.7 | 24.0±47.7 | 0.537 |
| Objective prognosis scorec) | 0.009 | |||
| 0 | 20 (7.9) | 3 (2.7) | 17 (12.1) | |
| 1 | 99 (39.1) | 40 (35.7) | 59 (41.8) | |
| 2 | 101 (39.9) | 53 (47.3) | 48 (34.0) | |
| ≥3 | 33 (13.0) | 16 (14.3) | 17 (12.1) | |
| Co-analgesic (Keromin) use | <0.001 | |||
| Yes | 51 (20.2) | 44 (39.3) | 7 (5.0) | |
| No | 202 (79.8) | 68 (60.7) | 134 (95.0) | |
| Sedation drug use | <0.001 | |||
| Yes | 128 (50.6) | 79 (70.5) | 49 (34.8) | |
| No | 125 (49.4) | 33 (29.5) | 92 (65.2) | |
| Sleep time (hr) | 6.0±0.7 | 6.0±0.7 | 6.0±0.7 | 0.954 |
| Type of pain | 0.030 | |||
| Somatic | 1 (0.4) | 0 | 1 (0.8) | |
| Visceral | 245 (96.8) | 112 (100) | 133 (94.3) | |
| Musculoskeletal | 7 (2.8) | 0 | 7 (5.0) | |
| Type of opioid | 0.074 | |||
| Intravenous | 237 (93.7) | 103 (92.0) | 134 (95.0) | |
| Patch | 5 (2.0) | 0 | 5 (3.5) | |
| Intrathecal | 11 (4.3) | 9 (8.0) | 2 (1.4) |
Values are presented as number (%) or mean±standard deviation.
p-values were calculated using the t-test for continuous variables and the chi-square test for categorical variables.
b) The stage of cancer was IV and was categorized according to the American Joint Committee on Cancer staging system, seventh edition.
c) The objective prognosis score is a tool for predicting the survival of terminal cancer patients in palliative care units in Korea that was developed by Jho et al. [16], and it ranges from 0 to 8 points.
2. Efficacy: pain control
Table 2.
|
Control group (n=141) |
Ketamine group (n=112) |
p-value | |||
|---|---|---|---|---|---|
| No. (%) | OR | No. (%) | OR (95% CI) | ||
| Favorable responsea) | 11 (7.8) | Reference | 28 (25.0) | 3.84 (1.76–8.37) | 0.001 |
| Optimal responseb) | 9 (6.4) | Reference | 25 (22.3) | 3.99 (1.73–9.22) | 0.001 |
| Opioid-sparing effectc) | 76 (53.9) | Reference | 52 (46.4) | 0.64 (0.38–1.09) | 0.101 |
OR, odds ratio; CI, confidence interval.
p-values were calculated using a multivariable logistic regression after adjusting for age and the objective prognosis score.
a) A favorable response to ketamine was defined as a reduction in pain intensity by ≥2 points at 48 hours after the introduction of ketamine.
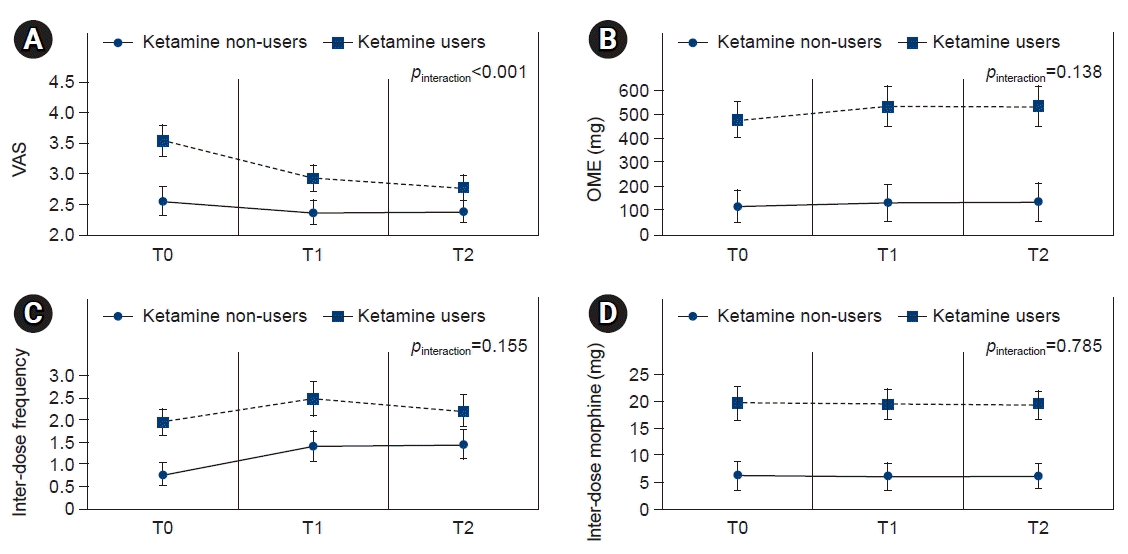
 | Fig. 1.Changes in VAS score, OME, inter-dose frequency, and inter-dose amount over time in the two groups: T0, ketamine or placebo introduction time; T1, 24 hours after treatment initiation; and T2, 48 hours after treatment initiation. (A) Change in VAS score after ketamine initiation. (B) Change in OME after ketamine use. (C) Change in inter-dose frequency after ketamine use. (D) Change in inter-dose amount after ketamine use. VAS, visual analog scale; OME, oral morphine equivalent. |
3. Tolerance: adverse effects
Table 3.
Values are presented as number (%) unless otherwise indicated. Adverse effects were observed for 48 hours after ketamine administration.
OR, odds ratio; CI, confidence interval.
p-values were calculated using the chi-square test for categorical variables or multivariable logistic regression for ORs (age and objective prognosis score were adjusted in the multivariable logistic analysis).


 PDF
PDF Citation
 Print
Print


 XML Download