

 PDF
PDF Citation
 Print
Print


INTRODUCTION
Bladder outlet obstruction (BOO) is a common outcome of benign prostatic hypertrophy. Bladder hypoxia is the result of high intravesical pressure that is generated to overcome the resistance to urinary flow in BOO. High intravesical pressure induces hypoxia by reducing the bladder blood flow and oxygen saturation in the blood. Blood vessel compression as a result of the contraction of muscles and intravesical pressure higher than intravascular pressure diminishes blood flow in bladder flow.12345 In BOO, this phase is prolonged and tissue ischemia is induced.4 Ischemic injury contributes to the initiation of bladder dysfunction.67 Hypoxia may also trigger cellular and tissue damage on the bladder wall. Detrusor hypertrophy and increased intravesical pressure are the ways in which the bladder responds to prevent urinary flow fluctuations in animal models of BOO.789 If the stress is beyond the capacity of the compensatory responses of the bladder, it undergoes decompensatory responses. Excessive long-term distension of the bladder caused ischemia, and consequent hypoxia induces decompensatory responses of the bladder dysfunction. There is still a lack of clarity about the underlying signaling mechanisms, despite the wide range of factors that have been proposed to be involved in bladder remodeling.10
We proposed to find out whether tissue hypoxia is present and the signaling mechanisms involved in the decompensated bladder in BOO.
METHODS
Rat BOO model
Twenty Sprague-Dawley female rats, six weeks of age (weighing 200 g), were equally divided into two groups: group 1, sham operation (n = 10); group 2, BOO for 8 weeks (n = 10).
The rats were anesthetized with isoflurane (BK Pharm, Goyang, Korea) and the BOO intervention was initiated. The skin of the lower abdomen was incised to enable dissection of the urethra, which was surrounded with 4-0 silk sutures, including a metal rod length of 1-mm external diameter in the extraluminal position. The rod was taken out upon suture tying, followed by closure of the abdominal wall. We administered 10 mg/kg injection of Flomoxef (cephalosporin; Ildong, Seoul, Korea) intraperitoneally daily in order to prevent infection.
Measurement of voiding function after transplantation
We evaluated the voiding response after eight weeks of BOO procedure. To place a catheter into the bladder surgically, isoflurane anesthesia was administered to the rats. A midline abdominal incision was subsequently made for exposure of the bladder. A small incision in the dome of the bladder facilitated insertion of a polyethylene 50 catheter. The distal end of this catheter (placed in the bladder) was subjected to heat to form a collar, around which a suture was placed tightly. The other catheter end went through the subcutaneous tissue and out via the skin. The muscle and skin were then sutured to close the incision to the abdomen. The rats intended for anesthesia-free examination were put in a restraining cage for 5–6 hours, permitting them to recover from the isoflurane anesthetic. A T-stopcock attached the bladder catheter to infuse physiological saline constantly as well as to be a pressure transducer. For stimulation of repetitive voiding responses, we infused physiological saline to the bladder at a fixed 0.04 mL/min rate and at ambient temperature. The rats were used to investigate the triggered micturition reflexes under urethane anesthesia. We measured the micturition-inducing intravesical pressure, pressure threshold (PT), maximal voiding pressure (MVP), and intercontraction interval (ICI) representing the duration between voids or reflex bladder contractions.
Histology and immunohistochemistry
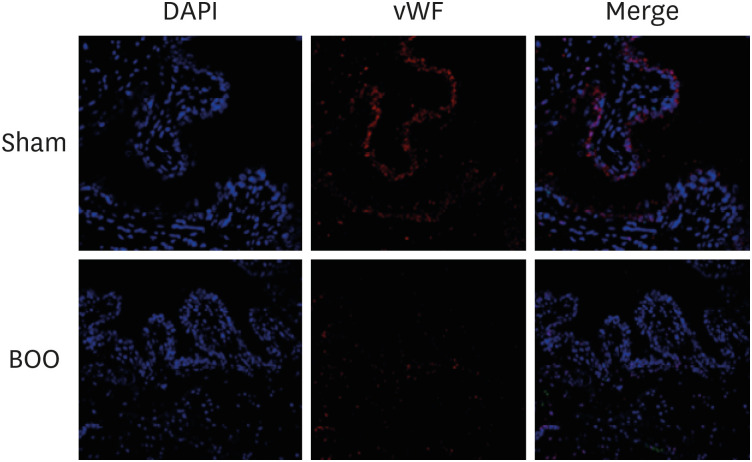
The next step after cystometry was anesthetizing the animals and perfusing them by means of the heart with 100 mL cold saline and 100 mL 4% paraformaldehyde in phosphate-buffered saline. This was followed by extraction of the bladder, which was fixed in 4% paraformaldehyde and subjected to cryoprotection in 30% sucrose for three days. The bladder was segmented into 10-μg portions in a Leica CM 1900 cryostat (Leica, Wetzlar, Germany) and stained. Immunofluorescence examination was processed for fluorescent staining, and stained sections were then examined under an Olympus laser confocal fluorescence microscope (Olympus, Tokyo, Japan). We did immunostaining for von Willebrand Factor (vWF) (1:200 dilution; Abcam, Cambridge, UK). Ten-minute heating with 9 mM sodium citrate (pH 5.0) was undertaken to retrieve the antigen for vWF. We used a peroxidase blocking reagent (Dako, Carpinteria, CA, USA) to inhibit endogenous peroxidase activity. Tissue portions were subjected to overnight incubation in a mixed primary antibody solution for vWF at 4°C, and subsequently to 60-minute incubation in a mixed secondary antibody solution of Alexa Fluor 488-conjugated anti-mouse IgG (1:200 dilution; Molecular Probe, Eugene, OR, USA) and Alexa Fluor 594-conjugated anti-rabbit IgG (1:200 dilution; Molecular Probe) at ambient temperature. The procedure for preparing the negative controls was the same, aside from the exclusion of the primary antibodies. We inspected the stained portions with an Olympus laser confocal fluorescence microscope.
mRNA expression
When cystometric analysis was completed, the animals anesthetized with isoflurane were destroyed to enable bladder extraction. After removal of surrounding tissue, we weighed the bladders, then immediately froze and stored them in liquid nitrogen until required for biochemical and molecular biological assays.
We used Trizol® reagent (Invitrogen, Carlsbad, CA, USA) for extraction of total RNA from the cells, followed by real-time polymerase chain reaction (PCR). Measurement of the relative gene expression was based on the threshold cycle value, and the housekeeping gene β-actin facilitated normalization of the gene expression. The data reflected the means of three experiments. The process of quantitative PCR (qPCR) involved one 10-second cycle at 95°C, 40 five-second cycles at 95°C, and one half-minute cycle at 60°C. At the end, we did a melting curve analysis in the temperature range 60–95°C.
Hypoxia gene real-time PCR array
We used the RNeasy Mini Kit (QIAGEN, Hilden, Germany) in keeping with the manufacturer’s guidelines for the isolation and extraction of total RNA. Subsequently, DNA contamination was eliminated by using RNase-free DNase (QIAGEN) to treat the solution with the extracted RNA. The first-strand cDNA synthesis involved the use of 2 μg total RNA and RT2 First Strand Kit (QIAGEN) and complied with the manufacturer’s guidelines. A mixture of first-strand cDNA and RT2 qPCR Master Mixes was created and aliquoted into the 96-well RT2 Profiler PCR Array for rat hypoxia (QIAGEN). SYBR green-optimized primer assays were included in the 96-well plate to achieve a comprehensively investigated array of pertinent pathway-oriented genes. This encompassed 84 genes underpinning the hypoxic response and 12 genes involved in the regulation of loading and cDNA quality. The procedure of real-time PCR detection involved ten-minute heating of the plate at 95°C, 40 15-second cycles at 95°C, and one 60-second cycle at 60°C. We employed genomic DNA, reverse transcription, and positive PCR controls for quality control; the housekeeping gene β-actin was the basis for data normalization. Fold increase/decrease reflected gene expression alterations. Alterations of more than two-fold represented the cut-off determining expression. The genes satisfying the two criteria above were established to display upregulation or downregulation.
Network analysis
We used network data-integration software, Cytoscape version 3.7.2 (Institute for Systems Biology, Washington, D.C., USA; Available from: https://www.cytoscape.org) and stringApp version 1.5.1 (Institute for Systems Biology; Available from: https://www.cytoscape.org) for integrating biomolecular interaction networks and states.
RESULTS
Body and bladder weight
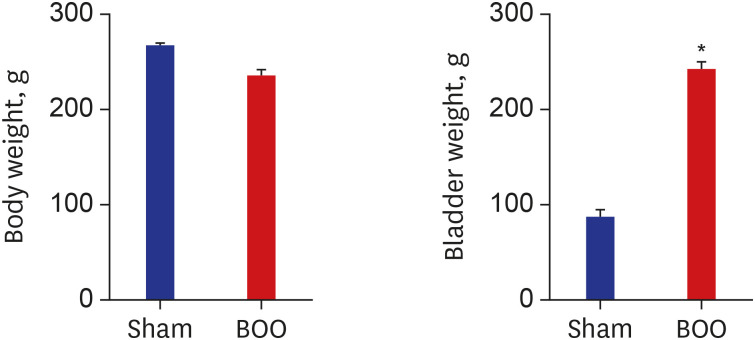
Group 1 had a mean body weight of 266 ± 3.3 g, and group 2 had a mean body weight of 235 ± 7.1 g; so the groups were relatively similar in body weight. Group 1 had a mean bladder weight of 86.9 ± 8.5 mg, and group 2 had a mean bladder weight of 242.2 ± 7.9 mg. Compared to the sham intervention group, the BOO group had a heavier bladder (Fig. 1).
Impaired bladder contractility
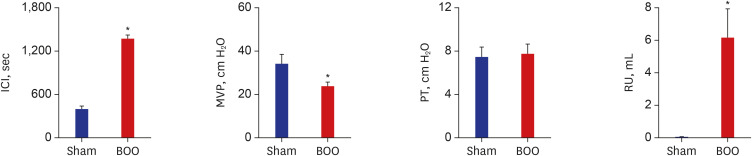
ICI was 412 ± 17 second and 1,386 ± 221 second in groups 1 and 2. ICI increased after BOO (P < 0.05). PT was 9.2 ± 1.2 cm H2O and 6.7 ± 0.8 cm H2O in groups 1 and 2. PT had no change between groups. MVP was 33.9 ± 4.7 cm H2O and 20.6 ± 3.5 cm H2O in groups 1 and 2. Residual urine volume (RU) was 0.07 ± 0.06 mL and 6.1 ± 1.8 mL in groups 1 and 2. MVP decreased and RU increased after BOO (Fig. 2).
mRNA expression of bladder in the group of BOO
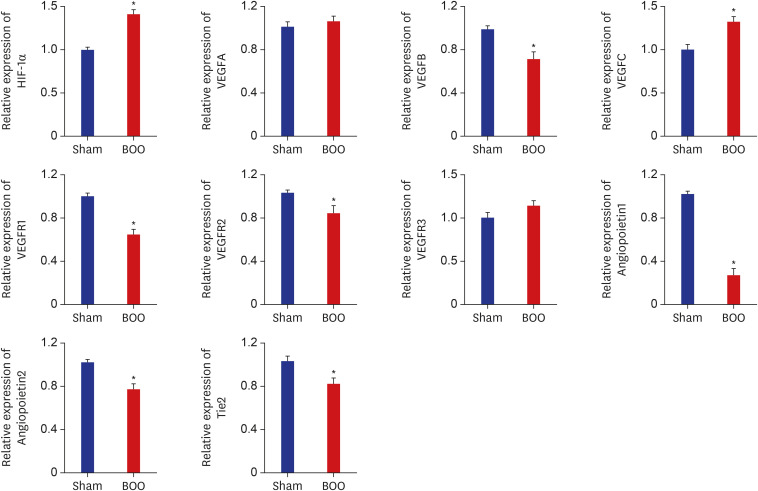
Table 1 shows the primer for real-time PCR of hypoxia. The mRNA expression of hypoxia-inducible factor (HIF)-1α increased in the group of BOO (P < 0.05). The mRNA expression of VEGFB and receptor VEGFR1 and VEGFR2 decreased in the group of BOO (P < 0.05). The mRNA expression of angiopoietin and Tie2 decreased in the group of BOO (P < 0.05) (Fig. 3).
Table 1
Primer for real-time polymerase chain reaction

Fig. 3
mRNA expression of bladder in the group of BOO. mRNA expression of HIF-1α increased in the group of BOO. mRNA expression of VEGFB and receptor VEGFR1, VEGFR2 decreased in the group of BOO. mRNA expression of angiopoietin and receptor tie decreased in the group of BOO.
Sham = sham operation, BOO = bladder outlet obstruction, HIF = hypoxia-inducible factor.
*P < 0.05.
Histopathology
Immunofluorescent staining with vWF showed decreased vWF-positive cells around blood vessel structures in the group of BOO (Fig. 4).
Hypoxia signaling pathway PCR array
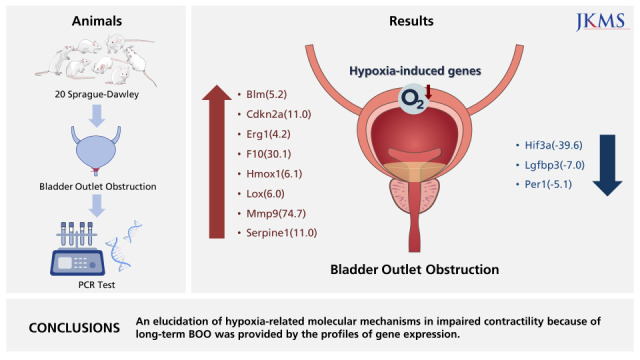
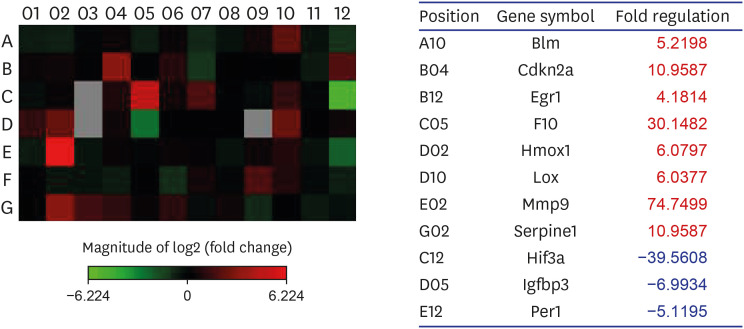
Supplementary Table 1 shows genes of the RT2 Profiler PCR Array for hypoxia. From the 84 hypoxia genes, eight genes, including Bloom syndrome (Blm; 5.2), cyclin-dependent kinase inhibitor 2A (Cdkn2a; 11.0), early growth response 1 (Egr1; 4.2), coagulation factor X (F10; 30.1), heme oxygenase 1 (Hmox1; 6.1), lysyl oxidase (Lox; 6.0), matrix metalloproteinase (Mmp) 9 (74.7), and serpin peptidase inhibitor, clade E, member 1 (Serpine1; 11.0), displayed at least two-fold upregulation, whereas three genes, namely, Hif3a (−39.6), insulin-like growth factor binding protein 3 (Igfbp3; −7.0), and Per1 (period homolog 1; −5.1), displayed at least two-fold downregulation in the BOO group by contrast to the sham intervention group. Hif3a and Per1 were among the HIG and co-transcription factors, whereas Cdkn2a was a HIF1 interactor. Egr1, Mmp9, Serpine1, Lox, and Hmox1 were involved in angiogenesis, and F10 and Serpine1 contributed to coagulation. The proliferation of cells was controlled with the involvement of Igfbp3. Heat mapping confirmed the modifications (Fig. 5).
Fig. 5
Gene expression profiling of rat bladder under hypoxic conditions. An RT2 Profiler™ PCR Array was used to screen a panel of 84 genes associated with rat hypoxia in sham and BOO group. Eight genes were 2-fold up-regulated, and 3 genes were at least 2-fold down-regulated in BOO, compared with Sham group. Changes were confirmed by heat mapping.
Sham = sham operation, BOO = bladder outlet obstruction, Blm = Bloom syndrome, Cdkn2a = cyclin-dependent kinase inhibitor 2A, Egr1 = early growth response 1, F10 = coagulation factor X, Hmox1 = heme oxygenase 1, Lox = lysyl oxidase, Mmp = matrix metalloproteinase, Serpine1 = serpin peptidase inhibitor, clade E, member 1, Hif = hypoxia-inducible factor, Igfbp3 = insulin-like growth factor binding protein 3, Per1 = period homolog 1.
Network analysis
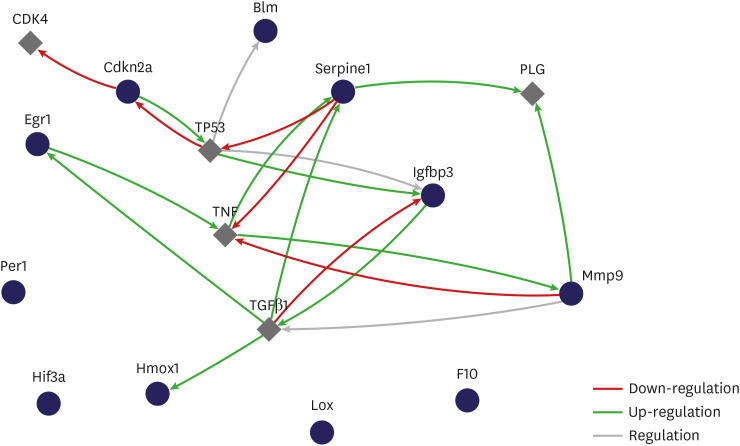
The relationship between selected genes showed that genes influenced each other by means of TGFβ1, TNF, and TP53 (Fig. 6).
Fig. 6
Gene expression profiling of rat bladder under hypoxic conditions. The interactive network during hypoxia. Relationship between selected genes showed that genes influenced each other through TGFβ1, TNF and TP53 (cytoscape string app. regulation of expression network, interaction network).
Blm = Bloom syndrome, Cdkn2a = cyclin-dependent kinase inhibitor 2A, Egr1 = early growth response 1, F10 = coagulation factor X, Hmox1 = heme oxygenase 1, Lox = lysyl oxidase, Mmp = matrix metalloproteinase, Serpine1 = serpin peptidase inhibitor, clade E, member 1, Hif = hypoxia-inducible factor, Igfbp3 = insulin-like growth factor binding protein 3, Per1 = period homolog 1.
DISCUSSION
Obstruction causes an increase in bladder-wall thickness and bladder weight that stabilizes and compensates for the demands of emptying against the increased urethral resistance (compensated function).1112 As the wall thickens, cyclical ischemia/reperfusion begins to occur with each micturition cycle.413 The bladder detrusor and subserosal areas exhibited focal hypoxia,14 leading to reduced contractile function and selective metabolic dysfunction of smooth muscles. In this study, we found increased bladder thickness (Fig. 1) and decreased bladder contractility in the decompensated bladder (Fig. 2).
An obstructed bladder is associated with diminished blood flow in the bladder wall and decreased oxygen tension when the bladder contracts, but bladder emptying reverses these effects.1315 If the duration of bladder obstruction is short, the bladder is compensated. However, if the duration of bladder obstruction is long, hypoxia induced by BOO is a major cause of the progressive dysfunction observed during decompensation.
There was a direct correlation between the BOO-related reduction in detrusor blood flow and the degree of decompensation.15 Cyclical detrusor ischemia/reperfusion results in the generation of reactive free radicals and the activation of specific phospholipases and proteases that mediate the observed cellular and subcellular membrane damage16 that is the etiology for the progressive bladder decompensation. In this study, we found increased mRNA expression of HIF-1α, decreased mRNA expression of VEGF and receptor VEGFR, and decreased mRNA expression of angiopoietin and receptor tie (Fig. 3). These results demonstrated hypoxic injury in our BOO model.
Earlier studies confirmed that hypoxia and HIF-1α were closely correlated.171819 This justifies the use of the HIF-1α protein as a reliable indicator of hypoxia. In mammals, the activity of the transcription factor, HIF, underpins the mechanism of the cellular hypoxia response. This oxygen-dependent factor is usually active solely under conditions of cellular hypoxia.2021 It is responsible for the activation of genes participating in glucose transport and metabolism, as well as the upregulation of genes contributing to the survival of cells.22 The HIF is the main activator of the hypoxia signaling pathway when oxygen levels are low. Among the biological processes underpinned by hypoxia-inducible target genes are angiogenesis, hematopoiesis, and vascular tone maintenance to ensure blood and oxygen are delivered to tissues.
In this study, the group with BOO showed decreased blood vessel structures more than did the groups of sham operation and controls with immunofluorescent staining of vWF (Fig. 4). Compared with the sham group, blood vessel density was clearly decreased in the BOO group.
To achieve a comprehensively investigated array of pertinent pathway-oriented genes, we included SYBR green-optimized primer assays in the 96-well plate RT2 Profiler PCR Array for rat hypoxia (QIAGEN). As indicated in Supplementary Table 1, the array encompassed 84 genes underpinning the hypoxic response, cell differentiation, and metabolism, and 12 genes involved in the regulation of loading and cDNA quality. We found that, from the 84 hypoxia genes, eight genes exhibited at least two-fold upregulation, and three genes exhibited at least two-fold downregulation in the BOO group compared with the sham group (Fig. 5). Hif3a demonstrated 39.6-fold down-regulation and means positive regulation of hypoxia-inducible gene expression. Per1, which is a HIF and co-transcription factor, demonstrated a 5.1-fold down-regulation. Cdkn2a, which is another HIF1 interactor, demonstrated an 11.0-fold up-regulation.
Egr1, Serpine1, and Hmox1, which are angiogenesis, demonstrated 4.2-, 11.0-, and 6.1-fold up-regulation, respectively. Igfbp3, which regulates cell proliferation, demonstrated a 7.0-fold down-regulation. F10 and Serpine1, which are involved in coagulation, demonstrated a 30.1- and 11.0-fold up-regulation and means positive regulation of hematopoiesis gene expression. The gene expression profiles could explain the molecular mechanisms of the increased HIF-1 pathway in a decompensated obstructed bladder. Depositing of the extracellular matrix and smooth-muscle dysfunction are among the many pathological events associated with hypoxia.23
The extracellular enzyme Lox not only mediates the covalent cross-linking of fibers of collagen type I and III, but also contributes to making extracellular collagen more stable and rigid.24 In this study, Lox demonstrated a 6.0-fold up-regulation. Protease of the MMP family is involved in the breakdown of ECM in angiogenesis and wound healing.25 In this study, Mmp9 demonstrated a 74.7-fold up-regulation and means positive regulation of angiogenesis.
Blm (RecQ helicase-like) acts to suppress inappropriate recombination.26 In this study, Blm demonstrated a 5.2-fold up-regulation.
The purpose of a gene-regulatory network is to define inter-gene biological interplay and afford insight into processes of cellular signaling and regulation. It also demonstrates the formation of a functional module via gene interaction and the correlation between distinct gene modules. The gene-regulatory network provides an estimate of a scale-free network topology with a couple of hub genes with close links and many nodes without close links.27 Playing the part of master regulators within a gene network, the hub genes are typically highly important in biological systems. The gene-regulatory network is worth researching, because it could help to distinguish clinical uses by mediating the methodical functional annotation of genes28 as well as by detecting hub genes.29 In the present study, the relationship between selected genes showed that genes influenced each other by means of TGFβ1, TNF, and TP53. We have contributed to identifying possible extra BOO-impaired hypoxia genes and pathways with potential adverse implications for bladder function.
It is clear that expression analysis based on a PCR array has notable advantages. However, the application of this approach here has some weak points. For instance, the extracted bladder samples contained various different types of cells, despite the fact that smooth-muscle cells are dominant in bladder tissues. Consequently, the results obtained regarding differential gene expression could be distorted. Furthermore, although the noted gene alterations and bladder dysfunction from BOO were found to be correlated, additional empirical research must be conducted to gain a better insight into which genes with differential expression promote impaired bladder function but are unrelated to BOO. Since many PCR array studies are afflicted by this difficulty, this work has been more of an endeavor to formulate new hypotheses.
Also, the RT2 Profiler PCR Array for rat hypoxia (QIAGEN) includes probe sets for more than 84 genes and transcripts, including common rat hypoxia genes, but not for every one of them. Hence, only a partial analysis could be conducted in this work. Moreover, important modifications emerging at earlier or later points in the progression of bladder dysfunction from BOO may be overlooked by focusing on just one time point in gene expression analysis. Identification of genes with direct involvement in bladder dysfunction from BOO may be aided by an all-inclusive examination of temporal transformations on the basis of expression patterns over time.
In conclusions, hypoxia genes were increased in impaired contractility because of protracted BOO. An elucidation of hypoxia-related molecular mechanisms in impaired contractility because of long-term BOO was provided by the profiles of gene expression.
 XML Download