

 PDF
PDF Citation
 Print
Print


INTRODUCTION
South Korea recently entered an era of ultra-low fertility. The total fertility rate in the country dropped below 1, to 0.977 in 2018 and 0.837 in 2020,1 which is the lowest in the world. The increasing number of late-age marriages leads to an increase in the average age of women at first pregnancy; the number of mothers aged > 35 years is, thus, increasing. Pregnancies at an advanced maternal age carry a higher risk of incidence of pregnancy-related complications, such as preeclampsia, placental abruption, premature birth, and gestational diabetes. This leads to a rise in the number of high-risk neonates, such as premature infants born at < 37 weeks of gestation and low-birth-weight infants weighing < 2,500 g.2 At the same time, childbirth infrastructure is continuously collapsing, and the regional gap is widening. The number of childbirth institutions per 100,000 fertile women in Seoul decreased by 20.7% from 5.7 in 2012 to 4.5 in 2019, while in Chungcheongbuk-do this decrease was 35.3%, from 9.5 in 2012 to 6.2 in 2019.34
The maternal mortality ratio in South Korea remained higher than the Organisation for Economic Co-operation and Development (OECD) average of 15, 16, and 12 in 2006, 2007, and 2008, respectively, but it fell to 7.8 in 2017, which was lower than the OECD average of 8.2. The perinatal mortality rate, which accounts for fetal and neonatal death (< 7 days of age), also improved to 2.7% in 2017, which was lower than the OECD average of 5.3. However, since the number of high-risk pregnant women and newborn infants is increasing, and the birth rate is decreasing, it is crucial to identify the current status of national perinatal healthcare services, such as maternal-fetal intensive care units (MFICUs) and neonatal intensive care units (NICUs), to help strengthen the available perinatal medical care accordingly.
Easter et al.5 reported that up to 68.2% of high-risk pregnant women with cardiovascular diseases or placenta previa who had undergone uterine surgery gave birth in medical institutions without adequate therapeutic capabilities. While defects in transport systems are one of the main reasons for this, inaccessibility to hospitals where appropriate treatments are available may be a crucial reason for the high rate of such births. The distribution of hospitals capable of childbirth management from 2002 to 2013 varied greatly by region in the United States.6 A similar phenomenon was observed in South Korea; thus, several studies proposed that maternal and neonatal prognoses could be improved by establishing a perinatal medical care sharing system for each region so that high-risk pregnant women, and subsequent high-risk newborn infants, could receive the appropriate perinatal care.7
Infant death is commonly caused by complications related to premature birth.8 The treatment outcomes of very-low-birth-weight infants (VLBWIs), weighing < 1,500 g, are used as quality indicators for the national healthcare management of neonates. The survival rate of VLBWIs in South Korea has improved up to 86.0% due to the development of neonatal intensive care.9 However, there is still scope for improvement, particularly when the survival rate of VLBWIs in South Korea is compared to that in other developed countries such as Japan, Canada, and Europe, which have better treatment outcomes for VLBWIs.9 In particular, improving the survival rate of extremely premature infants born at 22–27 weeks of gestation is an ongoing challenge.9 Domestic regional differences in survival rates of VLBWIs persist due to regional imbalances in neonatal intensive care resources.10
In rural areas, than in urban areas, it required more time to escort pregnant women requiring emergency delivery to the hospital from their homes.11 Little research has been conducted on such regional deviations in maternal and neonatal healthcare systems and their impact on perinatal health outcomes, such as maternal mortality ratio or perinatal mortality rate.
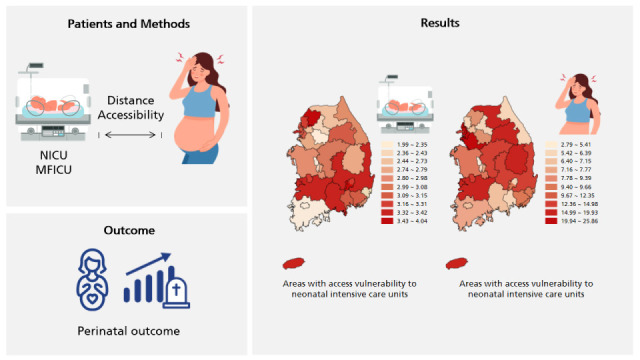
Therefore, the present study aimed to define perinatal medical care service areas (PMCSAs) among 70 hospital service areas (HSAs) across the country by comparing the maternal and neonatal healthcare accessibility between regions without MFICUs and NICUs to nearby regions where institutions with NICU and MFICU were located. We also evaluated perinatal outcomes such as maternal mortality ratio and perinatal mortality rate for each PMCSA and compared these among vulnerable and invulnerable regions, which were classified based on the degree of accessibility to the NICU and MFICU.
Go to : 
METHODS
This study was conducted by the Planning Committee of the Korean Society of Perinatology with the help of the Mother and Child Medical Policy Support Team and Public Health Statistics and Informatization Team in the National Medical Center in 2019, as a part of the project of “Support plan for the establishment of a regional maternal and neonatal medical care center.”12
Selection of medical institutions to be analyzed
Selection of medical institutions for this study was based on the current status data of medical institutions issued by the Health Insurance Review and Assessment Service at the end of December 2018.13
Designation for PMCSAs
The 70 HSAs across the country were determined by analyzing the modified Dartmouth Atlas methodology,14 a hierarchical clustering methodology that is based on data regarding utilization patterns of medical care services, such as population numbers, self-sufficiency rates of local medical services, and the distance from medical institutions; opinions stated by experts, including local governments, local hospitals, public health policy institutions, and public works directors from national universities,15 were also taken into consideration. If the Dartmouth Atlas in USA is just applied to Korea, an appropriate medical service area with geographic continuity cannot be derived because population and medical resources are concentrated in the capital area and big cities. Therefore, to derive 70 HSA, not only relevance index (RI) but also commitment index (CI) were used together to reflect actual medical care service utilization in more detail. RI is the ratio of medical service usage by local patients using hospitals located in the region out of the total medical service usage of patients living in the region. CI is the ratio of medical service usage by local patients using hospitals located in the region out of the total amount of medical care provided by medical institutions located in the region.
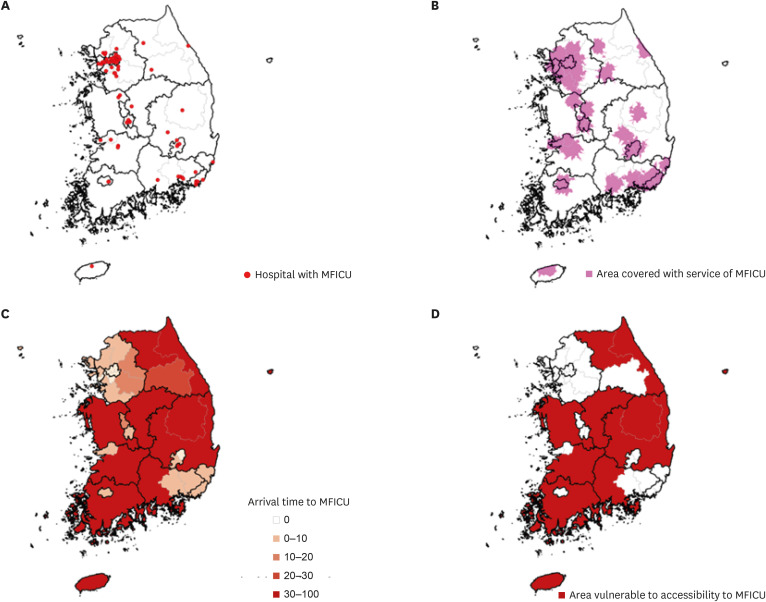
Of the 70 HSAs, we identified those that did not have medical institutions and analyzed the optimal pathway from the population-weighted centroid of the corresponding area to the appropriate medical institution in a nearby area by using the closest facility module of ArcGIS.16 We were then able to establish PMCSAs by finding the shortest travel distance to the institution with MFICU and NICU (Fig. 1).
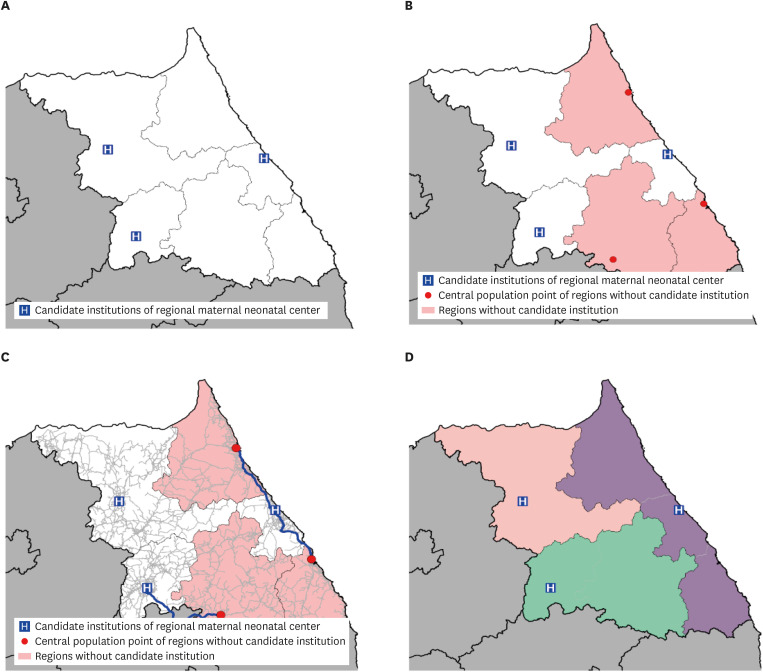 | Fig. 1Establishment of PMCSAs analyzed using the ArcGIS closet facility. (A) Current status of the candidate regional perinatal centers with maternal-fetal intensive care units and neonatal intensive care units. (B) Identification of regions without candidate institutions. (C) Analysis to identify the optimization path to candidate institutions in adjacent region. (D) Establishment of PMCSAs.PMCSA = perinatal medical care service area.
|
Analysis of areas vulnerable to accessibility
Seventy-five hospital-level institutions had ≥ 10 NICU beds or performed > 2,789 days of inpatient care in the NICU and were considered to provide neonatal intensive care equivalent to institutions running 10 beds with an average NICU bed utilization rate of 76.4%. Further, 76 hospital-level institutions had ≥ 3 MFICU beds or performed > 709 days of inpatient care for high-risk pregnant women; these were considered to provide medical care equivalent to institutions running 3 beds with an average MFICU bed utilization rate of 64.7% across the country.
Areas vulnerable to accessibility were analyzed using the ArcGIS service area module.17 Accessibility was evaluated with vehicle travel distance analysis that used the road network data provided by the Korea Transport Database (https://www.ktdb.go.kr). The road network data was modified for ArcGIS Network analysis. The proportion of the population with vulnerable accessibility in PMCSAs was analyzed with regional population data provided by BIZGIS. Co (www.biz-gis.com). The PMCSAs were classified as vulnerable to accessibility if more than 30% of the population within the service area could not reach a medical institution within 60 minutes.
Analysis of maternal mortality ratio and perinatal mortality rate
Data on the causes of death statistics provided by Statistics Korea for the 5 years from 2014 to 2018 were utilized.18 The maternal mortality ratio was calculated by dividing the number of pregnancy-related female deaths that occurred during pregnancy or within 42 days after delivery by the total number of childbirths that year, and then dividing this value by 100,000. The perinatal mortality rate was calculated by dividing the sum of the number of fetal deaths at > 28 weeks of gestation and the number of newborn infants deaths aged < 7 days by the total number of childbirths that year, and further dividing this value by 1,000.19 The calculated maternal mortality ratio and perinatal mortality rates were compared between areas that were vulnerable and invulnerable to accessibility. The difference between the variance of the maternal mortality ratio and perinatal mortality rates in the PMCSAs was evaluated using the coefficient of variation analysis.20
Go to :
RESULTS
Designation of PMCSAs
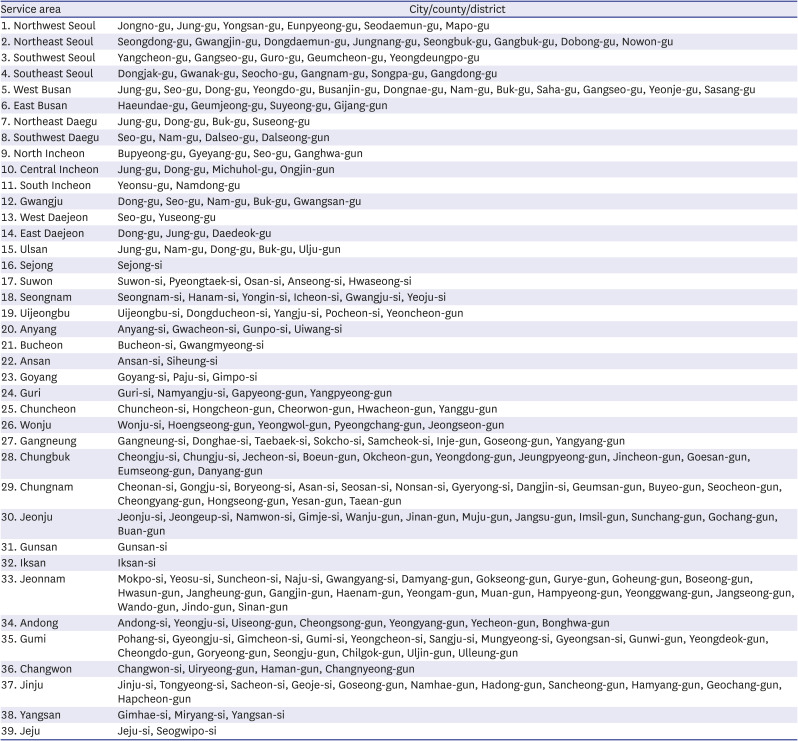
Eighty-eight medical institutions had > 5 NICU beds or > 3 MFICU beds and were deemed suitable for analysis. Of the 70 HSAs, 33 did not contain a medical institution that was appropriate for analysis. The final 39 PMCSAs were established by merging them with the nearby HSAs that contained medical institutions subject to analysis. (Table 1 and Fig. 2).
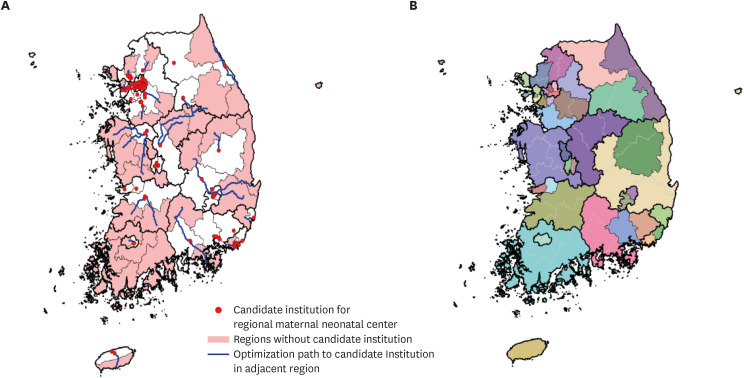 | Fig. 2Formulation of PMCSAs. (A) Composition of PMCSAs through optimization path. (B) Thirty-nine newly formulated PMCSAs.PMCSA = perinatal medical care service area.
|
Table 1
Thirty-nine perinatal medical care service areas in Korea
![]()
Analysis of areas vulnerable to accessibility
Of the 39 PMCSAs, 10 were found to be vulnerable to accessibility, where > 30% of the population was unable to access the NICU or an MFICU of a medical institution subject to analysis in 60 minutes (Fig. 3). All institutions vulnerable to MFICU accessibility were also vulnerable to NICU accessibility (Fig. 4). Therefore, these 10 PMCSAs were defined as vulnerable to NICU and MFICU accessibility.

Maternal and perinatal mortality
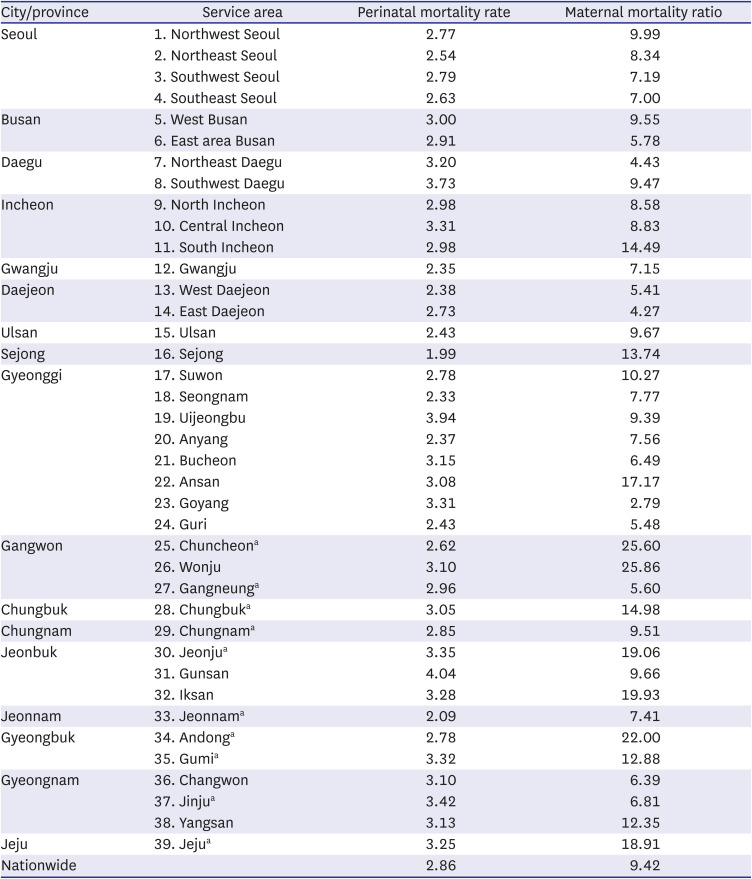
The national perinatal mortality rate was 2.86, with the highest and lowest rates of perinatal mortality observed in the Gunsan and Sejong, respectively (Table 2 and Fig. 5). The total number of perinatal deaths from 2014 to 2018 was 5,569. Of the PMCSAs, the highest number of perinatal deaths was observed in the Suwon (325) followed by the Southeast Seoul (301); the Sejong showed the lowest number of perinatal deaths (29).
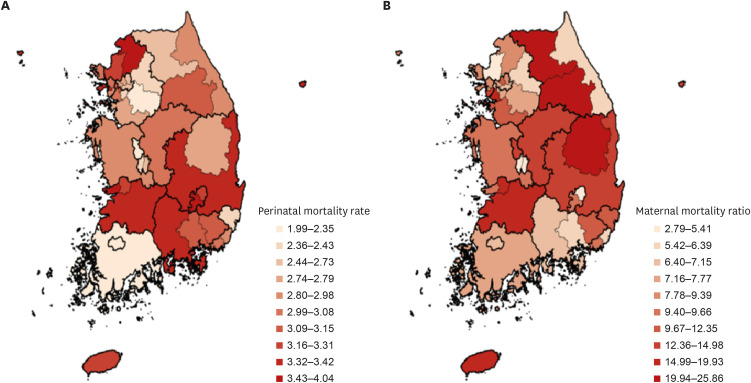 | Fig. 5Perinatal mortality rates and maternal mortality ratio in 39 perinatal medical care service areas. (A) Perinatal mortality rates. (B) Maternal mortality ratio.
|
Table 2
Perinatal mortality rate and maternal mortality ratio in 39 perinatal medical care service areas
aAreas with access vulnerability to NICUs and MFICUs.
NICU = neonatal intensive care unit, MFICU = maternal-fetal intensive care unit.
![]()
The national maternal mortality ratio was 9.42; the highest and lowest maternal mortality ratios were observed in the Wonju and Goyang, respectively (Table 2 and Fig. 5). The total number of maternal deaths from 2014 to 2018 was 183. Of the PMCSAs, the highest number of maternal deaths were observed in the Suwon (12) followed by the Pohang (11); the East Daejeon, Gangneung, and Gunsan showed the lowest absolute number of maternal deaths (1 each).
Comparison of PMCSAs by access vulnerability to perinatal medical care provided by NICUs and MFICUs
The perinatal mortality rates for PMCSAs vulnerable and invulnerable to access to perinatal medical care services provided by MFICUs and NICUs were 2.97 and 2.92, respectively. The value was slightly higher for the vulnerable regions, but there was no significant difference in the perinatal mortality rates (P = 0.789). On the other hand, the maternal mortality ratio for PMCSAs vulnerable and invulnerable to perinatal medical care service of MFICU and NICU accessibility were 14.28% and 9.48%, respectively; this rate was significantly higher for regions vulnerable to accessibility (P = 0.022).
The coefficient of variation for maternal mortality ratio among the PMCSAs was 54.26, and that for the perinatal mortality rates was 15.75. The coefficient of variation for the maternal mortality ratio was significantly higher than that of the perinatal mortality rates (P < 0.001).
Go to :
DISCUSSION
In the present study, we defined 39 PMCSAs that were determined by areas with medical institutions comprising > 10 NICU beds or > 3 MFICU beds, based on the 70 HSAs announced by the government, to help bridge the gap in healthcare services among regions. We found that the maternal mortality ratio of PMCSAs vulnerable to access to medical institutions with >10 NICU beds and > 3 MFICU beds was significantly higher than that of invulnerable PMCSAs.
Accessibility to secondary or tertiary hospitals is an important factor in determining the prognosis of postpartum hemorrhage, which is one of the most common causes of maternal death. Conservative management using medication and blood transfusions can be conducted in the early stages of postpartum hemorrhage; however, invasive treatment, including uterine artery embolization or balloon insertion, is required in cases of excess bleeding. Hysterectomy should be considered if vital signs such as blood pressure and heart rate are unstable, or if the bleeding continues even after the patients receive the aforementioned treatments. A study on postpartum hemorrhagic complications conducted in Scotland showed that approximately 35% of pregnant women did not receive adequate perinatal treatment21; another study reported that 90% of maternal deaths associated with postpartum hemorrhage in North Carolina could have been prevented.22 According to studies by Wright et al.,23 if treatment was carried out at high-volume hospitals rather than at low-volume hospitals with low surgical experience, surgical complication and perioperative mortality rates were reduced by 34% (odds ratio [OR], 0.66; 95% confidence interval [CI], 0.47–0.93), and 71% (OR, 0.29; 95% CI, 0.10–0.88), respectively. These findings suggest that building a system that can direct patients to local hospitals with reasonable surgical experience can reduce maternal mortality rates. Several perinatology reports exist on the successful implementation of the regionalized healthcare system.2425262728 Hospitals capable of providing appropriate perinatal care must be built within the PMCSAs to help resolve the difference in maternal mortality ratio between the vulnerable and invulnerable areas determined in this study. However, since this is difficult to accomplish within a short period, it is necessary to build efficient transport systems for high-risk maternal patients between hospitals within PMCSAs.
There was no significant difference in perinatal mortality rates between the vulnerable and invulnerable areas. The distribution of the perinatal mortality rates for each PMCSA is more even compared to that of the maternal mortality ratio; this may be because of the establishment of regional neonatal intensive care centers in most areas, excluding Seoul, with the support of the government.2930 However, the present study showed that 10 (25.6%) out of 39 PMCSAs remained vulnerable to NICU accessibility. Shim et al.10 analyzed the mortality rates of VLBWIs by dividing the country into 6 regions and referring to the data on medical resources and NICU status in 76 hospitals across the nation. Differences in the mortality rates of VLBWIs were based on the grade assigned to the NICUs according to their levels of care, volume of VLBWIs, and the region where the NICU was located. In particular, it was found that the smaller the weight of the infant, the greater the regional difference in mortality rates. This regional difference was significantly reduced when the aforementioned factors, such as the levels of care and volume of VLBWIs, were adjusted. The management of high-risk newborns, including in NICUs, is essential, and the relevant public health infrastructure must be established to be complementary to the management of high-risk pregnant women. Continual efforts should be made to improve neonatal intensive care, such as increasing the number of medical personnel in NICUs and expanding the neonatal transport system.
The present study has some limitations. Herein, to evaluate the access vulnerability of PMCSAs to perinatal care, the criteria for adequate perinatal medical care service was at least 10 NICUs beds and 3 MFICU or MFICU-equivalent beds; this might be controversial. Further, the criterion of 3 MFICU-equivalent beds was used based on the copay data of equivalent services for high-risk pregnant women as the current nationwide official MFICU beds are still lacking. Furthermore, sophisticated data, such as that on the reasons for maternal or perinatal death as well as the exact outcomes for high-risk pregnant women and high-risk newborn infants such as VLBWIs were not available in the present study; thus, this could not be evaluated. In addition, the present study could not analyze the difference in transport system for high-risk pregnant women and newborn infants, and medical resources for caring for them adequately among PMCSAs. Therefore, further study regarding these issues should be performed in the future.
Nevertheless, the present study has several strengths. Previous studies focused on the number of medical uses or on temporal accessibility according to the size of the city.1231 The present study is meaningful as it focused on defining PMCSAs according to the status of medical resources and supply for each region for the first time in Korea and confirmed the differences in the maternal and perinatal outcomes in line with medical infrastructure. In addition, previous studies only assessed specific areas, such as Gyeonggi-do and Gangwon-do, or cities of unspecified sizes1131; this study is significant in that the analysis involved the entire country. Therefore, the perinatal healthcare system should be implemented by building new and improving existing regional MFICUs and NICUs and establishing efficient transport systems to connect regions vulnerable to perinatal care access to those invulnerable to perinatal care access. This can positively affect social values such as perinatal health outcomes in the corresponding regions.
In conclusion, we first defined 39 PMCSAs in across Korea, of which 25.6% had poor accessibility to maternal and neonatal healthcare services, such as MFICUs and NICUs. Perinatal healthcare outcomes, including the maternal mortality ratio, were different among the PMCSAs according to their access vulnerability to the perinatal care provided by MFICUs and NICUs. We believe that the government and medical expert groups should expand perinatal healthcare infrastructure, such as MFICUs and NICUs, and establish a systemic and efficient transport system for high-risk pregnant women and newborn infants.
Go to :
 XML Download