Journal List > Ann Lab Med > v.42(4) > 1159778

Yang, Jeong, Kim, Hwang, Hur, and Lee: Sex-Specific U-Shaped Relationships Between High-Density Lipoprotein Cholesterol Levels and 10-year Major Adverse Cardiovascular Events: A Nationwide Cohort Study of 5.7 Million South Koreans

Abstract

Background

High-density lipoprotein cholesterol (HDL-C) is a well-known predictor of atherosclerotic cardiovascular diseases (ASCVD). We explored the relationships between HDL-C levels and 10-year major adverse cardiovascular events (MACE) and provided sex-specific upper reference limits for HDL-C levels.

Methods

Based on the Korean National Health Insurance Sharing Service, we identified 5,703,897 subjects (women, 48%) with age ≥40 years, eligible HDL-C results, and no prior ASCVD in 2009. We investigated the distribution of 10-year MACE according to HDL-C levels in 10 mg/dL (0.26 mmol/L) intervals and in three HDL-C groups (low men <40 mg/dL [1.03 mmol/L], women <50 mg/dL [1.29 mmol/L]; high between low and extremely high levels; and extremely high >90 mg/dL [2.33 mmol/L]).

Results

There were U-shaped relationships between HDL-C levels and 10-year MACE with later inflection in women than in men (nadir 80-99 mg/dL [2.07-2.56 mmol/L] and 50-59 mg/dL [1.29-1.53 mmol/L], respectively). In men, the extremely high HDL-C group showed significantly higher 10-year MACE than the high group (28.1% vs. 24.6%, P<0.0001). In women, the extremely high group showed the lowest 10-year MACE; if the extremely high starting point was raised to 130 mg/dL, it became similar to that in men and showed higher 10-year MACE than the high group (25.6% vs. 20.1%, P<0.0001).

Conclusions

The 10-year MACE showed U-shaped relationships with HDL-C levels, and extremely high HDL-C level at 90 mg/dL (2.33 mmol/L) in men was corresponding in risk to 130 mg/dL (3.36 mmol/L) in women.

INTRODUCTION

High-density lipoprotein cholesterol (HDL-C) is a well-known negative predictor of atherosclerotic cardiovascular diseases (ASCVD) [1-4]. Traditionally, HDL-C has been a key variable in the pooled cohort ASCVD risk equation [5]. With new evidence piling up, the traditional paradigm has been challenged, and the optimal cardioprotective HDL-C levels need to be clarified [6-9]. The lower optimal cutoffs are universally established.
The 2019 American College of Cardiology/American Heart Association (ACC/AHA) guidelines on the primary prevention of cardiovascular (CV) disease defined low HDL-C levels (men <40 mg/dL [1.03 mmol/L]; women <50 mg/dL [1.29 mmol/L]) as one of the risk-enhancing factors in a 10-year ASCVD risk assessment [10]. However, the upper optimal cutoff reports are not entirely clear as to whether the relationship between HDL-C levels and CV events is linear or U-shaped. The current ACC/AHA-derived ASCVD risk calculator only allows HDL-C levels up to 100 mg/dL (2.59 mmol/L), and the 2019 European Society of Cardiology (ESC)/the European Atherosclerosis Society (EAS) guidelines stated that HDL-C level improves the accuracy of the ASCVD risk evaluation only up to 90 mg/dL (2.33 mmol/L) [11, 12]. Thus, an extremely high HDL-C level (>90 mg/dL [2.33 mmol/L]) cannot be used as a risk predictor [7, 12].
Recent studies have suggested that extremely high HDL-C levels are not associated with cardioprotection and possibly even paradoxically increase CV morbidities or mortalities [6-9, 13]. As HDL-C levels are affected by complex factors, such as ethnicity, lifestyle, and co-morbidities, it is worth assessing the optimal upper reference limits, particularly, sex-specific limits, in various demographics [14].
In 2009, the Korean National Health Insurance Service (NHIS) started evaluating HDL-C levels in men ≥24 years and women ≥40 years. As 10 years have passed, we could track actual 10-year major cardiovascular events (MACE) in this nationwide cohort. We explored the relationships between baseline HDL-C levels and 10-year MACE in South Koreans without prior ASCVD. The primary purpose of this study was to test the hypothesis that the 2019 ESC/EAS-derived extremely high HDL-C level (>90 mg/dL [2.33 mmol/L]) has higher 10-year MACE than the usual high HDL-C level (men 40-90 mg/dL [1.03-2.33 mmol/L], women 50-90 mg/dL [1.29-2.33 mmol/L]) for the total cohort and for each sex. The secondary purpose was, if a U-shape exists, to provide an optimal upper reference limit, defined by the HDL-C risk exceeding that of the reference HDL-C after the nadir, and a true extremely high HDL-C cutoff with a risk comparable to that of the known dangerous low HDL-C group (men <40 mg/dL [1.03 mmol/L], women <50 mg/dL [1.29 mmol/L]) in each sex.

MATERIALS AND METHODS

Data sources

De-identified data regarding general medical checkups were provided by the Korean National Health Insurance Sharing Service (NHISS), which contains all charged medical and pharmacy claims on all healthcare in South Korea. Information regarding all-cause mortality was obtained from the National Death Registry of Korea. As the customized sample cohort data contains personal sensitive information, access was restricted to authorized locations on pre-approved dates. The study protocol was designed according to the criteria of the Declaration of Helsinki and was approved by the Institutional Review Board of Konkuk University Medical Center (KUMC 2020-03-037), Seoul, Korea, and the NHISS official review committee (NHIS-2021-1-622).

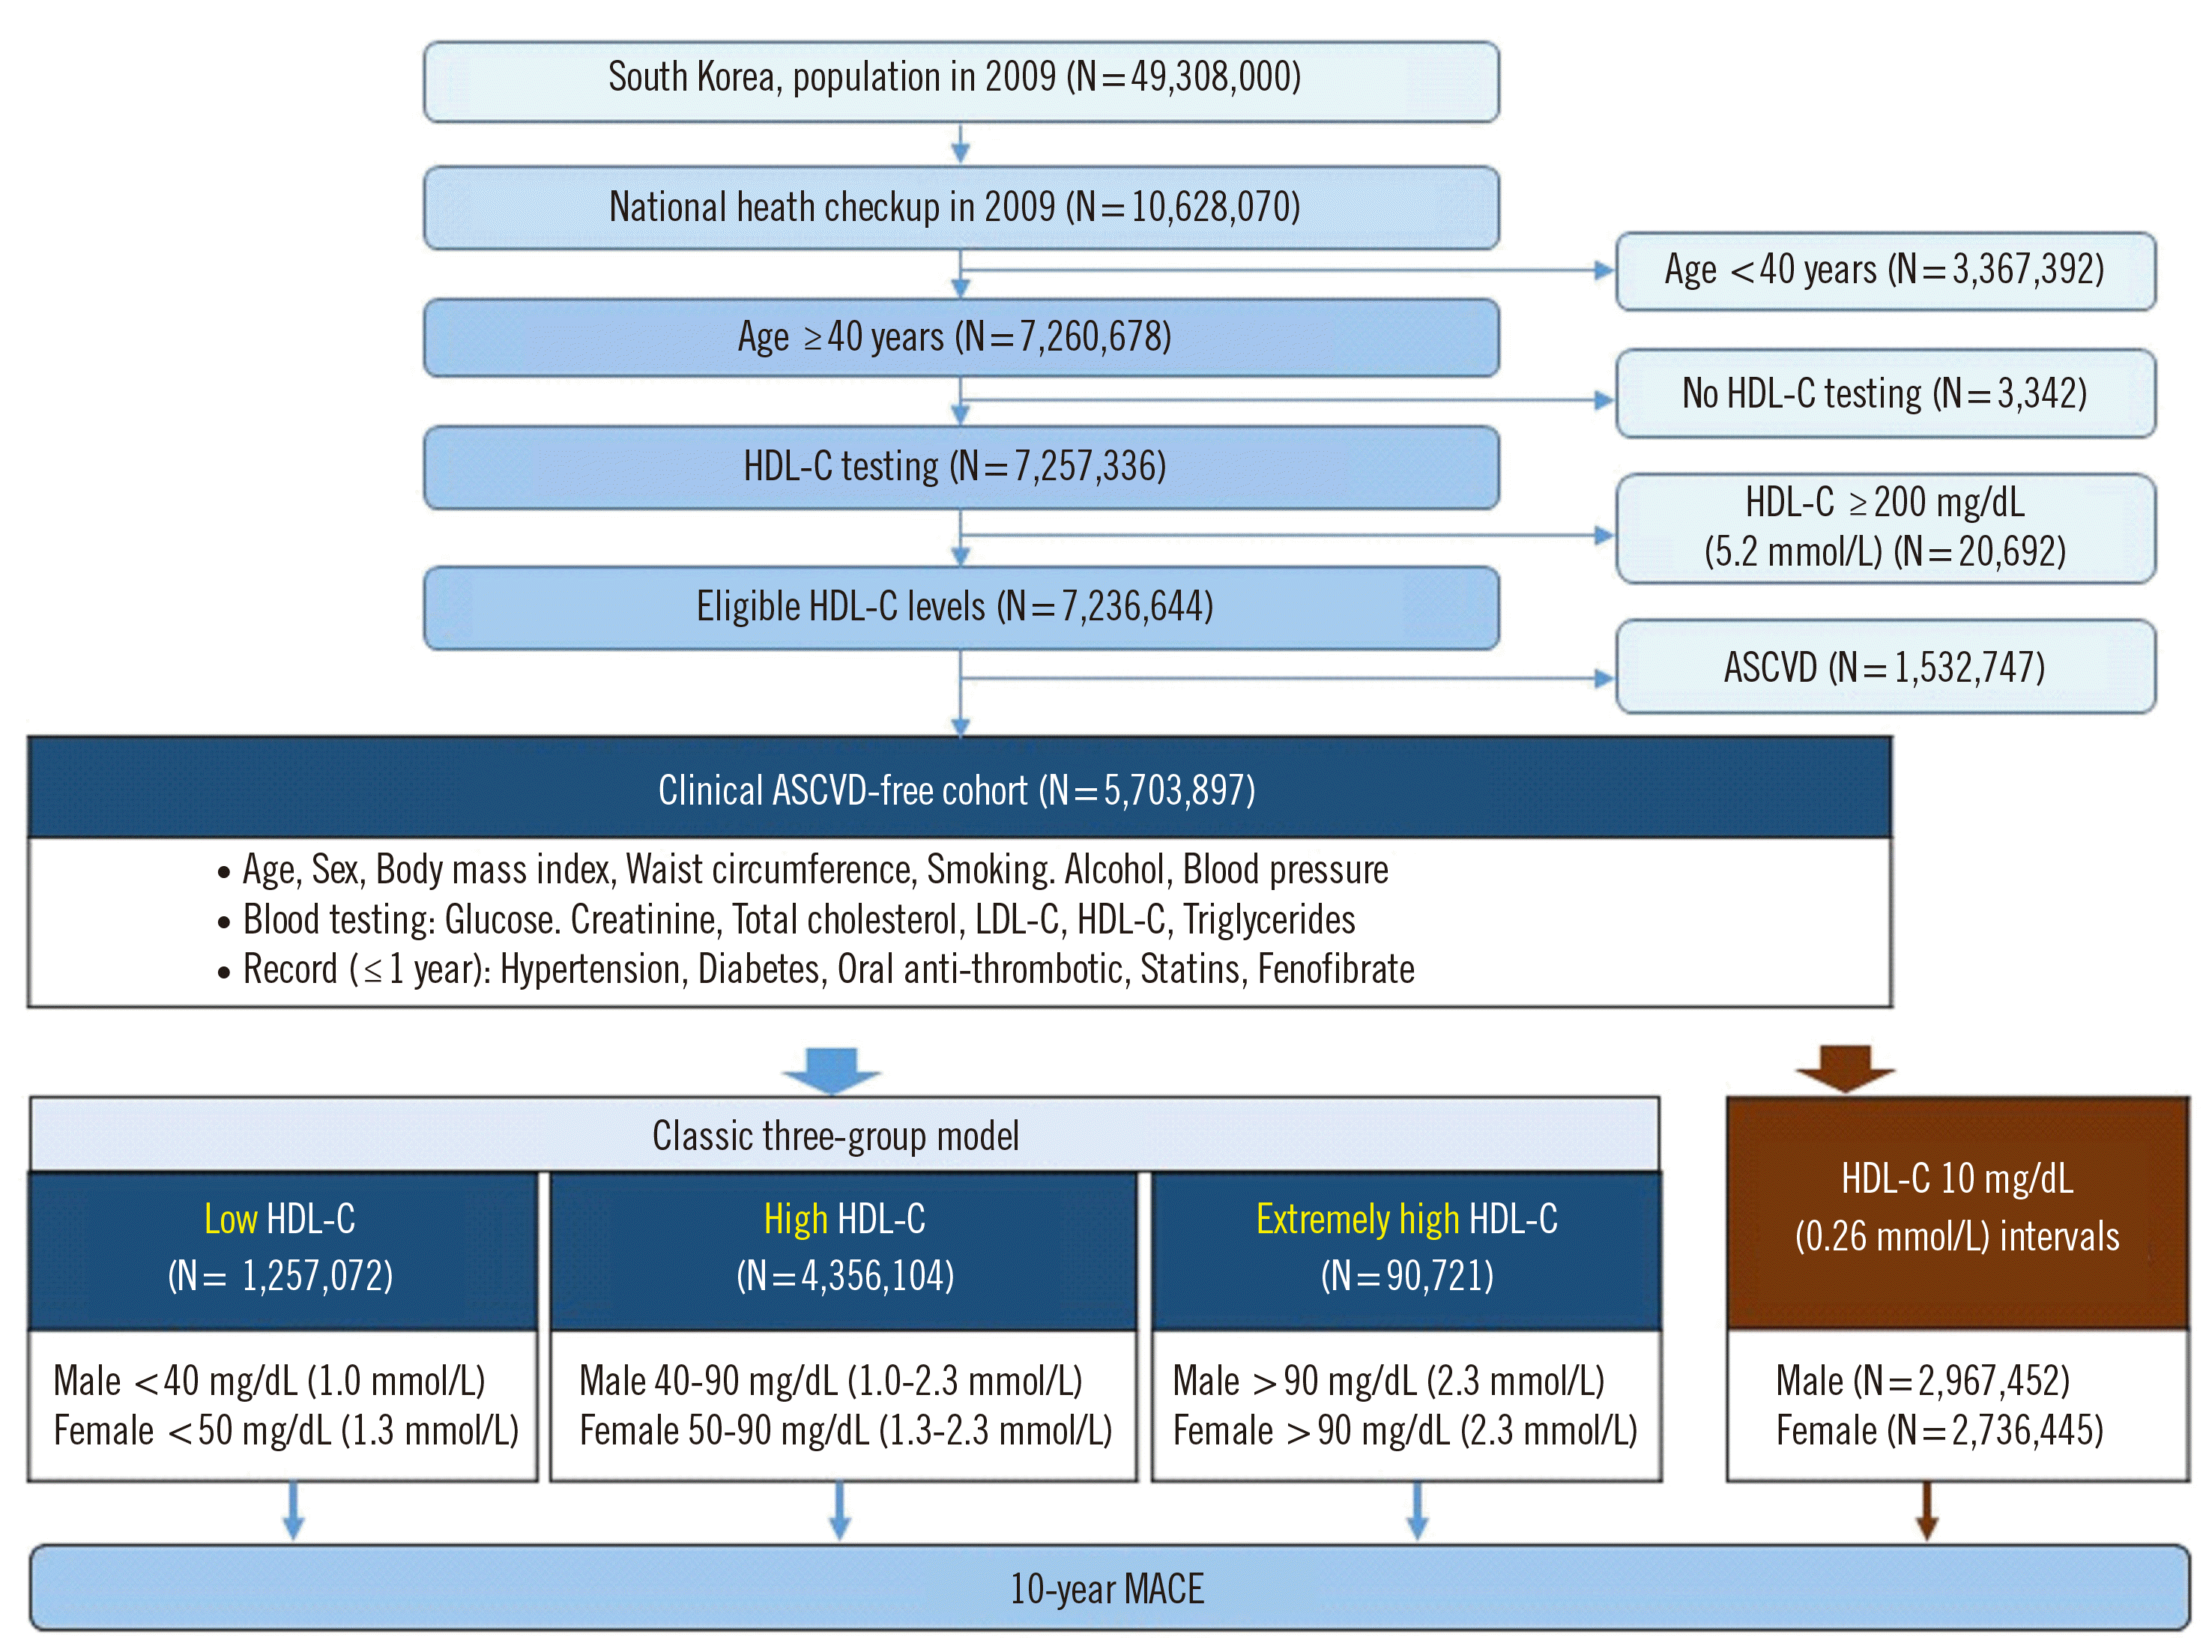
Study design and subject selection

This was a retrospective nationwide population-based cohort study. The study flow diagram is presented in Fig. 1. Approximately 22% of the total South Korean population underwent a national health checkup in 2009 (the index year). Of those, we enrolled subjects with age ≥40 years and eligible HDL-C results; we excluded subjects with no HDL-C testing, HDL-C levels ≥200 mg/dL, or a prior history of ASCVD before the index year based on the 8th Korean Standard Classification of Diseases (KCD) codes, an extension of the International Classification of Diseases 10th revision: angina pectoris (I20), acute myocardial infarction or acute coronary syndrome (I21-24), chronic ischemic heart disease (I25), presence of a coronary angioplasty implant and graft (Z95.5), presence of an aortocoronary bypass graft (Z95.1), stroke (I63-66), transient ischemic attack (G45), or peripheral arterial disease (I73) [15]. Finally, we analyzed 5,703,897 ASCVD-free subjects.

Definitions

The index date for each subject was defined as the date on which the subject’s 2009 national health checkup was performed. Data collected on the index date included age, sex, body mass index (BMI), waist circumference, smoking, alcohol consumption, blood pressure (BP), and blood test results. Blood samples were drawn after an overnight fast and the following parameters were measured using standard laboratory methods: glucose, serum creatinine, total cholesterol (TC), HDL-C, and triglycerides. Low-density lipoprotein cholesterol (LDL-C) was calculated using the Friedewald formula: LDL-C=TC-(triglycerides/5)−HDL-C. Obesity was defined as a BMI >25 kg/m2, while abdominal obesity was defined as waist circumference ≥90 cm for men and ≥85 cm for women [16]. A medical history of hypertension and diabetes mellitus (DM) was determined based on the 8th KCD codes (hypertension: I10*, I11*, I12*, I13*, I15*, I674; DM: E10*, E11*) within one year of the index year. Hypertension was defined as having either systolic BP ≥140 mm Hg at the index date or a medical history of hypertension. DM was defined having either fasting glucose ≥126 mg/dL (7.0 mmol/L) at index date or a medical history of DM. The medications used at baseline were determined from the prescription records (oral anti-thrombotic drugs in 430 products including aspirin, warfarin, and P2Y12 inhibitors; statins in 1,426; fenofibrate in 49) within one year of the index year.
We categorized the HDL-C levels according to two schemes (Fig. 1): one using the classic three-group model (low: men <40 mg/dL [1.03 mmol/L], women <50 mg/dL [1.29 mmol/L]; high: men 40-90 mg/dL [1.03-2.33 mmol/L], women 50-90 mg/dL [1.29-2.33 mmol/L]; and extremely high: >90 mg/dL [2.33 mmol/L]) and the other using 10 mg/dL (0.26 mmol/L) intervals. The classic model is based on the following two guidelines: (1) the risk-enhancing factors in the 2019 ACC/AHA guidelines on the primary prevention of CV disease (low HDL-C <40 mg/dL [1.03 mmol/L] in men; <50 mg/dL [1.29 mmol/L] in women), and (2) the statement in the 2019 ESC/EAS guidelines for the management of dyslipidemia: at extremely high HDL-C levels (>90 mg/dL [2.33 mmol/L]), there appears to be an increased risk of ASCVD [10, 12]. MACE in this study were defined as new-onset angina, acute myocardial infarction, cardiac arrest, stroke, or all-cause mortality. All subjects were followed for 10 years; 35,744 (0.6%) were lost to follow-up (Supplemental Data Table S1). The MACE-free survival time was defined as the duration between the index date and the first occurrence of MACE in each subject.

Statistical analysis

Data are expressed as frequency (percentage) for categorical variables, and as mean±standard deviation or median and the interquartile range for continuous variables. In the classic three-group model, frequencies of demographics and distributions of influential factors were compared using a chi-square test. Continuous variables were examined using ANOVA with Scheffé’s test if the distribution was homogeneous.
For the primary-purpose analysis, we compared the 10-year MACE between the three classic groups (low, high, and extremely high HDL-C) in the entire cohort as well as in each sex using a chi-square test.
For the secondary-purpose analysis, initially, the relationship between 10-year MACE and baseline HDL-C level was examined to determine the risk from below 20 mg/dL (0.52 mmol/L) to 199 mg/dL (5.15 mmol/L) in 10 mg/dL (0.26 mmol/L) intervals. For each sex, exploring optimal upper reference limits or true extremely high HDL-C cutoffs started from the risk nadir. We compared the 10-year MACE between the three new HDL-C groups (low: men <40 mg/dL [1.03 mmol/L], women <50 mg/dL [1.29 mmol/L]; high: between; extremely high: >new reference cutoffs) using a chi-square test. Model I (upper optimal cutoff) was defined using a three-group model with an extremely high HDL-C risk exceeding that of the reference HDL-C after the nadir, and model II (true extremely high HDL-C cutoff) was defined using a three-group model with an extremely high HDL-C risk comparable to that of the known dangerous low HDL-C group (men <40 mg/dL [1.03 mmol/L], women <50 mg/dL [1.29 mmol/L]) in each sex. With these models (classic, model I, and model II), both unadjusted and adjusted Cox proportional hazard analyses were performed. Ultimately, the relationship between 10-year MACE and HDL-C level on a continuous scale was analyzed using cubic splines in a Cox proportional hazard regression model. After checking the assumption using Schoenfeld residuals, we examined separate sex-stratified models to determine the risk, as women have higher HDL-C levels. The MACE-free survival models were initially assessed via the spline effects of HDL-C, and then adjusted for age, BMI, LDL-C, triglycerides, hypertension, DM, smoking, and alcohol consumption frequency.
Covariates for statistical adjustment (Supplemental Data Fig. S1) were chosen from the essential parameters of the ASCVD risk calculator (age, sex, ethnicity, systolic BP, TC, HDL-C, history of DM, smoking, and hypertension treatment) [5, 11, 17]. Among these, we excluded two variables (sex and ethnicity) due to the cohort including only Koreans, stratified by sex, and added two variables (BMI and alcohol) as potential confounding factors with HDL-C [14]. Instead of systolic BP and hypertension treatment, we included hypertension, which collectively represented those variables in this study. Instead of TC, we included LDL-C and triglycerides as causal risk factors for MACE [18]. All analyses were performed using SAS Enterprise Guide 7.1 software (SAS Institute Inc., Cary, NC, USA). The level of significance (alpha) was set to 0.05.

RESULTS

Baseline characteristics

Baseline characteristics of the study population are presented in Table 1. Just over a half (52%) were men, and the mean age at the index date was 52.6 years. Baseline HDL-C levels had a slight positive skew (skewness of 0.93) and a platykurtic (kurtosis of 2.6) pattern with a mean of 54.7 mg/dL (1.41 mmol/L), and the mean value was significantly lower in men than in women (52.1 mg/dL [1.35 mmol/L] vs. 57.5 mg/dL [1.49 mmol/L], P<0.0001). Approximately 22% of the subjects had low HDL-C levels: 15% of men and 30% of women had levels below the recommended targets (<40 mg/dL [1.03 mmol/L] and <50 mg/dL [1.29 mmol/L], respectively). Approximately 1.6% of the cohort showed HDL-C levels >90 mg/dL (2.33 mmol/L): 1.1% of men and 2.1% of women.
When the classic model was applied, in both men and women, the extremely high HDL-C group showed significantly less obesity, less oral anti-thrombotic or fenofibrate medication, and lower levels of LDL-C and triglycerides, but more frequent alcohol consumption than other groups (all, P<0.0001). Sex-specific findings were observed in hypertension: the highest BP and frequency of hypertension were observed in the extremely high HDL-C group in men, but in the low HDL-C group in women.

Classic three-group comparisons of 10-year MACE and all-cause mortality

Ten-year MACE were observed in 1,341,669 subjects (23.5%) of the total cohort and were significantly higher in men than in women (746,182 [25.2%] vs. 597,487 [21.8%], P<0.0001). In men, the classic extremely high HDL-C group showed significantly higher 10-year MACE than the high group (28.1% vs. 24.6%, P<0.0001), but the same as the low group (28.1% vs. 28.1%, P=0.92). However, in women, the classic extremely high HDL-C group showed the lowest 10-year MACE among the three groups (Table 2). The low HDL-C group showed higher 10-year MACE than the other groups in the age range 40-69 years, but the difference was no longer observed at ages ≥70 years.
All-cause mortality was observed in 304,426 (5.3%) subjects, about twice as often in men as in women (207,300 [7.0%] vs. 97,126 [3.6%], P<0.0001). In total, the classic extremely high HDL-C group showed significantly higher mortality than the high HDL-C group (6.0% vs. 5.2%, P<0.0001), but roughly the same as the low HDL-C group (6.0% vs. 5.9%, P=0.26). In men, the classic extremely high HDL-C group showed higher mortality than the high HDL-C group (11.0% vs. 6.8%, P<0.0001), even higher than the low HDL-C group (11.0% vs. 8.0%, P<0.0001); in women, there was no difference in mortality between the classic extremely high and high HDL-C groups (3.0% vs. 3.0%, P=0.51) (Table 2).

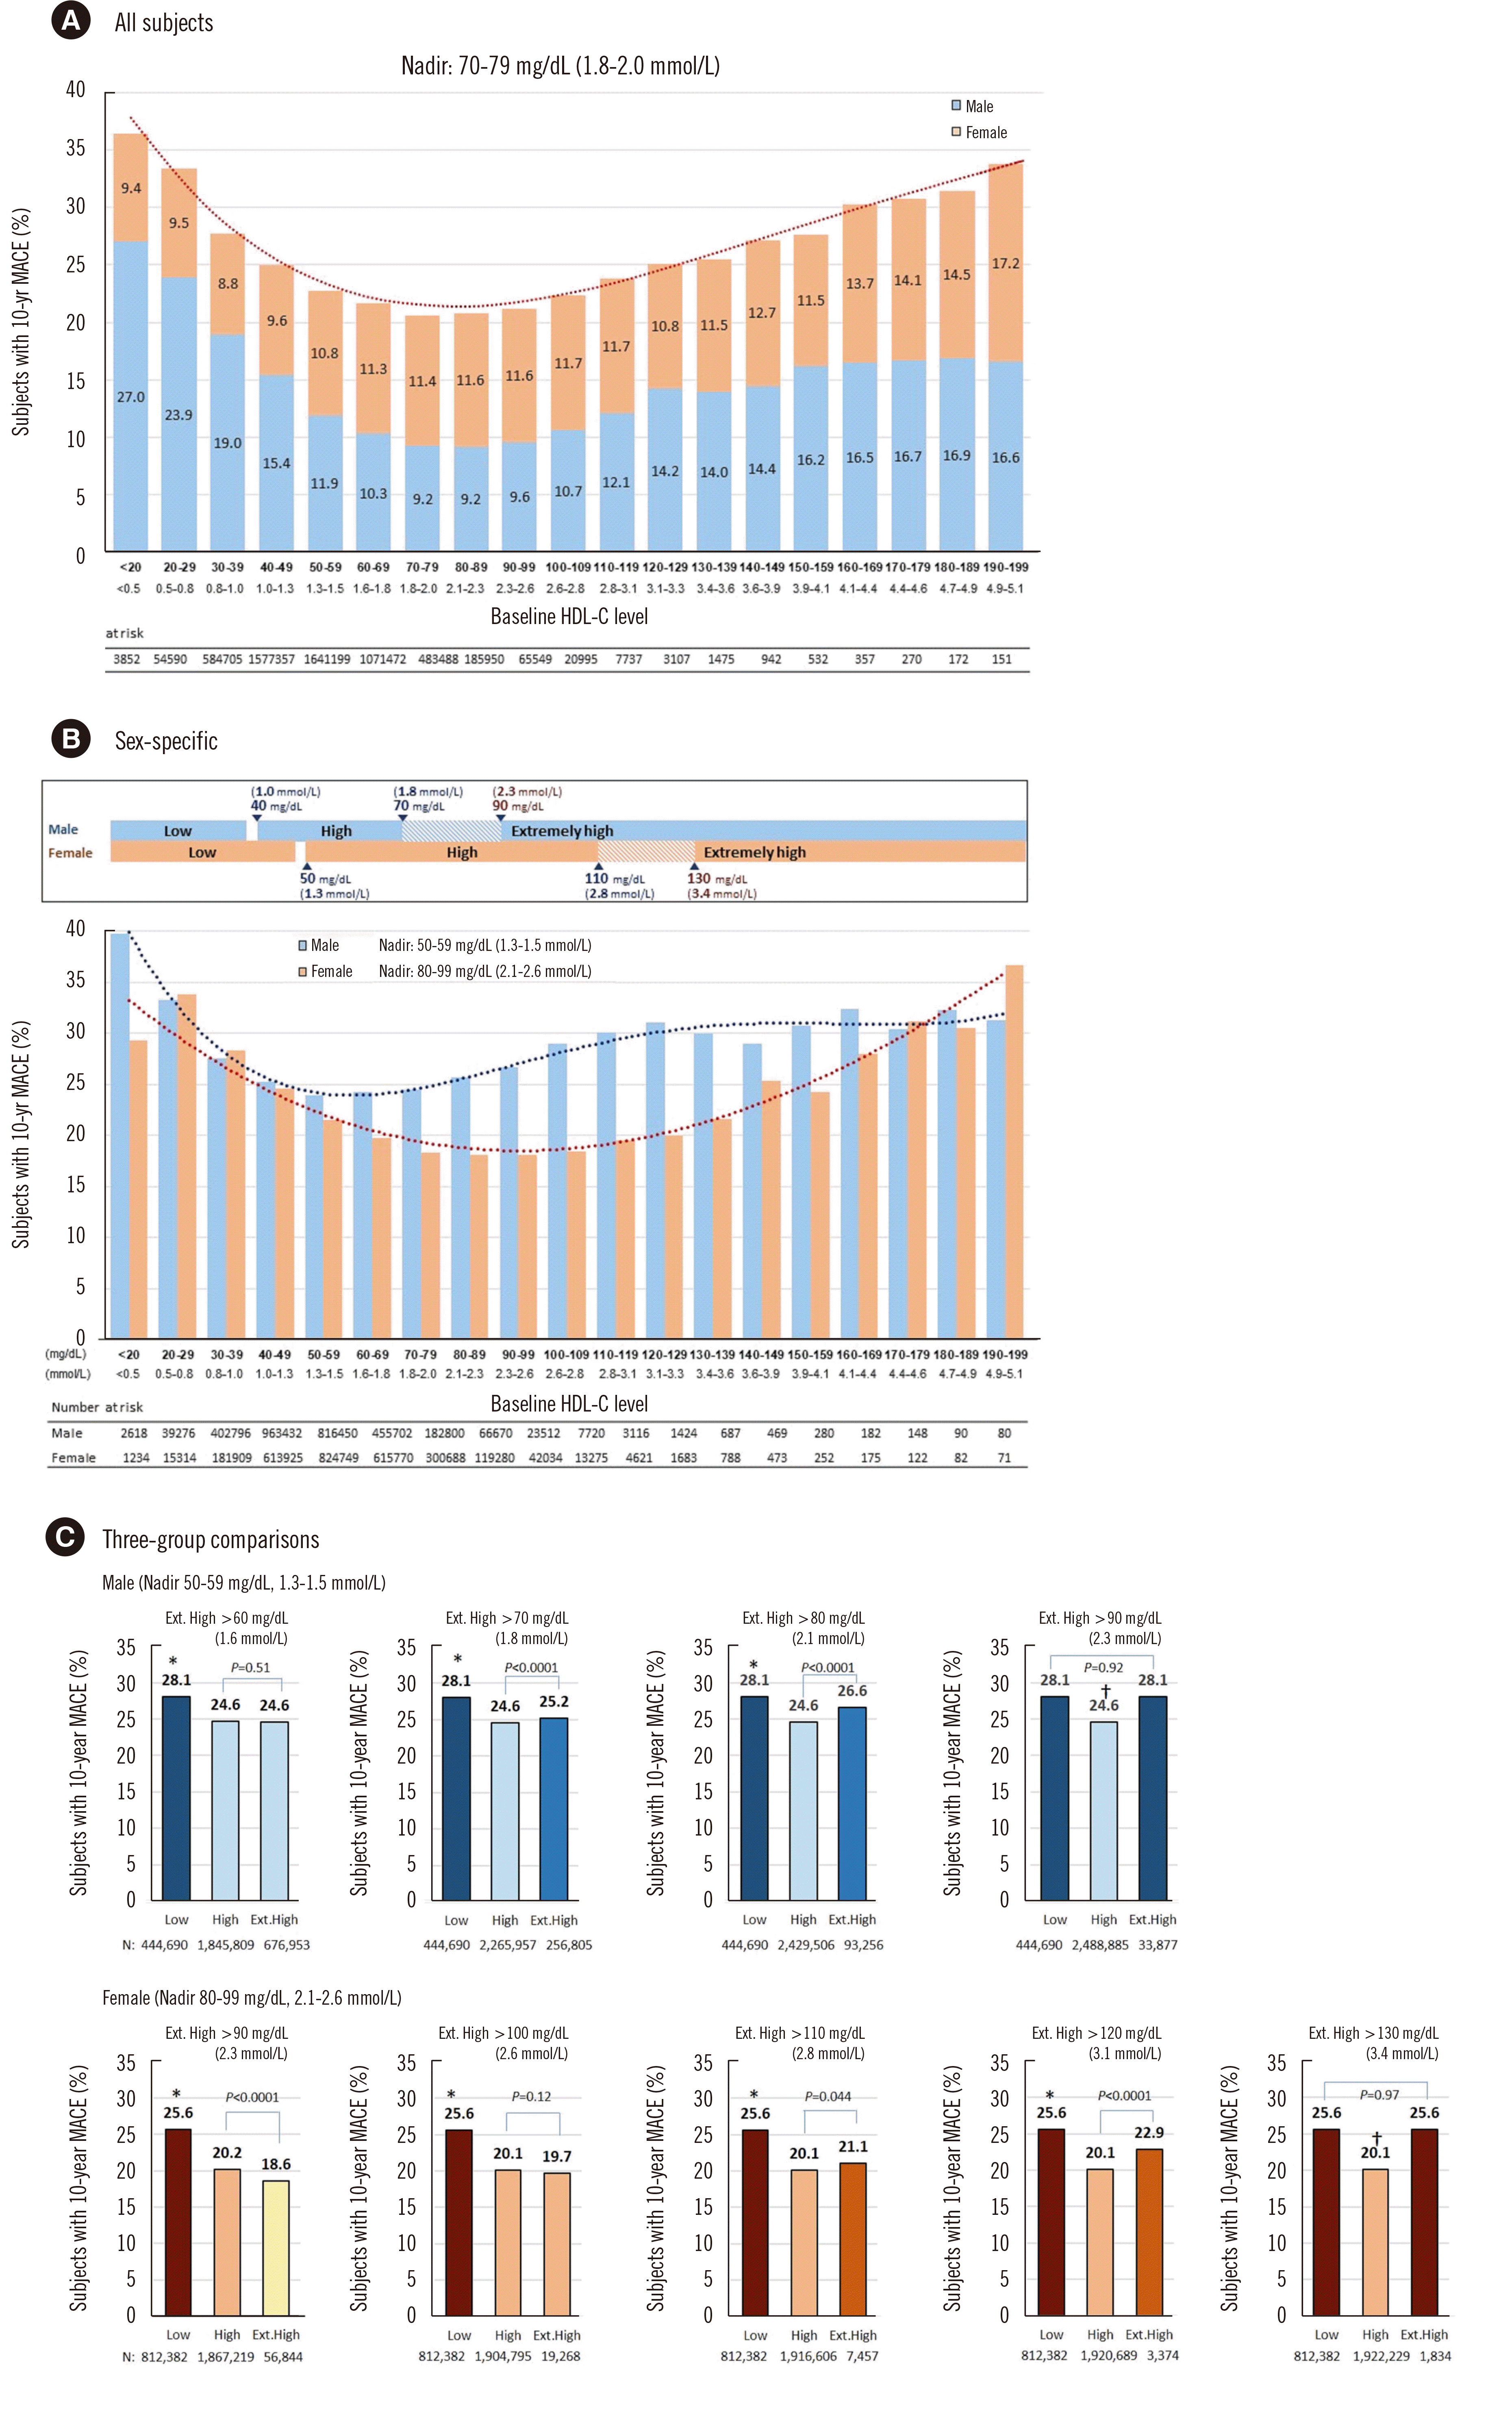
Distribution of 10-year MACE stratified by HDL-C levels

In the total cohort, the distribution of subjects with 10-year MACE stratified by HDL-C 10 mg/dL (0.26 mmol/L) intervals demonstrated a U-shaped relationship (Fig. 2A). The nadir was at HDL-C levels of 70-79 mg/dL (1.81-2.04 mmol/L). Among subjects with HDL-C level <40 mg/dL (1.03 mmol/L), the proportion of men was 2.2 times higher than that of women; therefore, the absolute frequency of men with 10-year MACE was substantially higher (19.4% vs. 8.9%). In subjects with HDL-C levels of 40-89 mg/dL (1.03-2.30 mmol/L), the ratio of men to women was 1.0, and the frequencies of subjects with 10-year MACE were 12.3% and 10.6%, respectively. Among subjects with HDL-C levels of 90-199 mg/dL (2.33-5.15 mmol/L), the proportion of women was 1.7 times higher than that of men, and the absolute frequency of men with 10-year MACE was lower than that of women (10.3% vs. 11.6%).
Both sex-subgroup plots of the distribution of 10-year MACE by HDL-C 10 mg/dL (0.26 mmol/L) intervals also demonstrated a U-shape, but with later inflection in women than in men (Fig. 2B). The nadir of HDL-C levels was 50-59 mg/dL (1.29-1.53 mmol/L) in men and 80-99 mg/dL (2.07-2.56 mmol/L) in women.

Exploration of sex-specific reference points of HDL-C levels in 10 mg/dL (0.26 mmol/L) intervals

Given the sex-specific inflection points, we explored new extremely high HDL-C reference points starting after the sex-specific risk nadir (men, 60 mg/dL [1.55 mmol/L]; women, 100 mg/dL [2.59 mmol/L]) (Fig. 2C). In men, the upper optimal cutoff was 70 mg/dL (1.81 mmol/L), the risk just exceeding the high HDL-C group (P<0.0001), and the true extremely high HDL-C cutoff was 90 mg/dL (2.33 mmol/L), the 10-year MACE then being comparable to those in the low HDL-C group (P=0.92). In women, the upper optimal cutoff was 110 mg/dL (2.84 mmol/L), and the true extremely high HDL-C cutoff was 130 mg/dL (3.36 mmol/L).

Hazard ratio (HR) of 10-year MACE by reference ranges in each sex

Based on Fig. 2C, three models (classic, model I, and model II) with different reference values were made, and the sex-stratified unadjusted and adjusted HRs of 10-year MACE are presented in Table 3. In men, the classic model revealed that the low and extremely high groups were associated with a 10% and 9% increased risk for MACE occurring within 10 years after the index date (adjusted HR [95% CI] of 1.10 [1.09-1.10] and 1.09 [1.07-1.11]), respectively.
In women, in the classic model, the extremely high group was associated with a lower (unadjusted HR of 0.92 [95% CI: 0.90-0.94], P<0.0001) or indifferentiable risk (adjusted HR of 0.99 [95% CI: 0.97-1.01], P=0.22). However, in model II, the low and extremely high groups were associated with a 6% and 14% increased risk of 10-year MACE (adjusted HR of 1.06 [95% CI: 1.05-1.07] and 1.14 [1.04-1.25]), respectively.

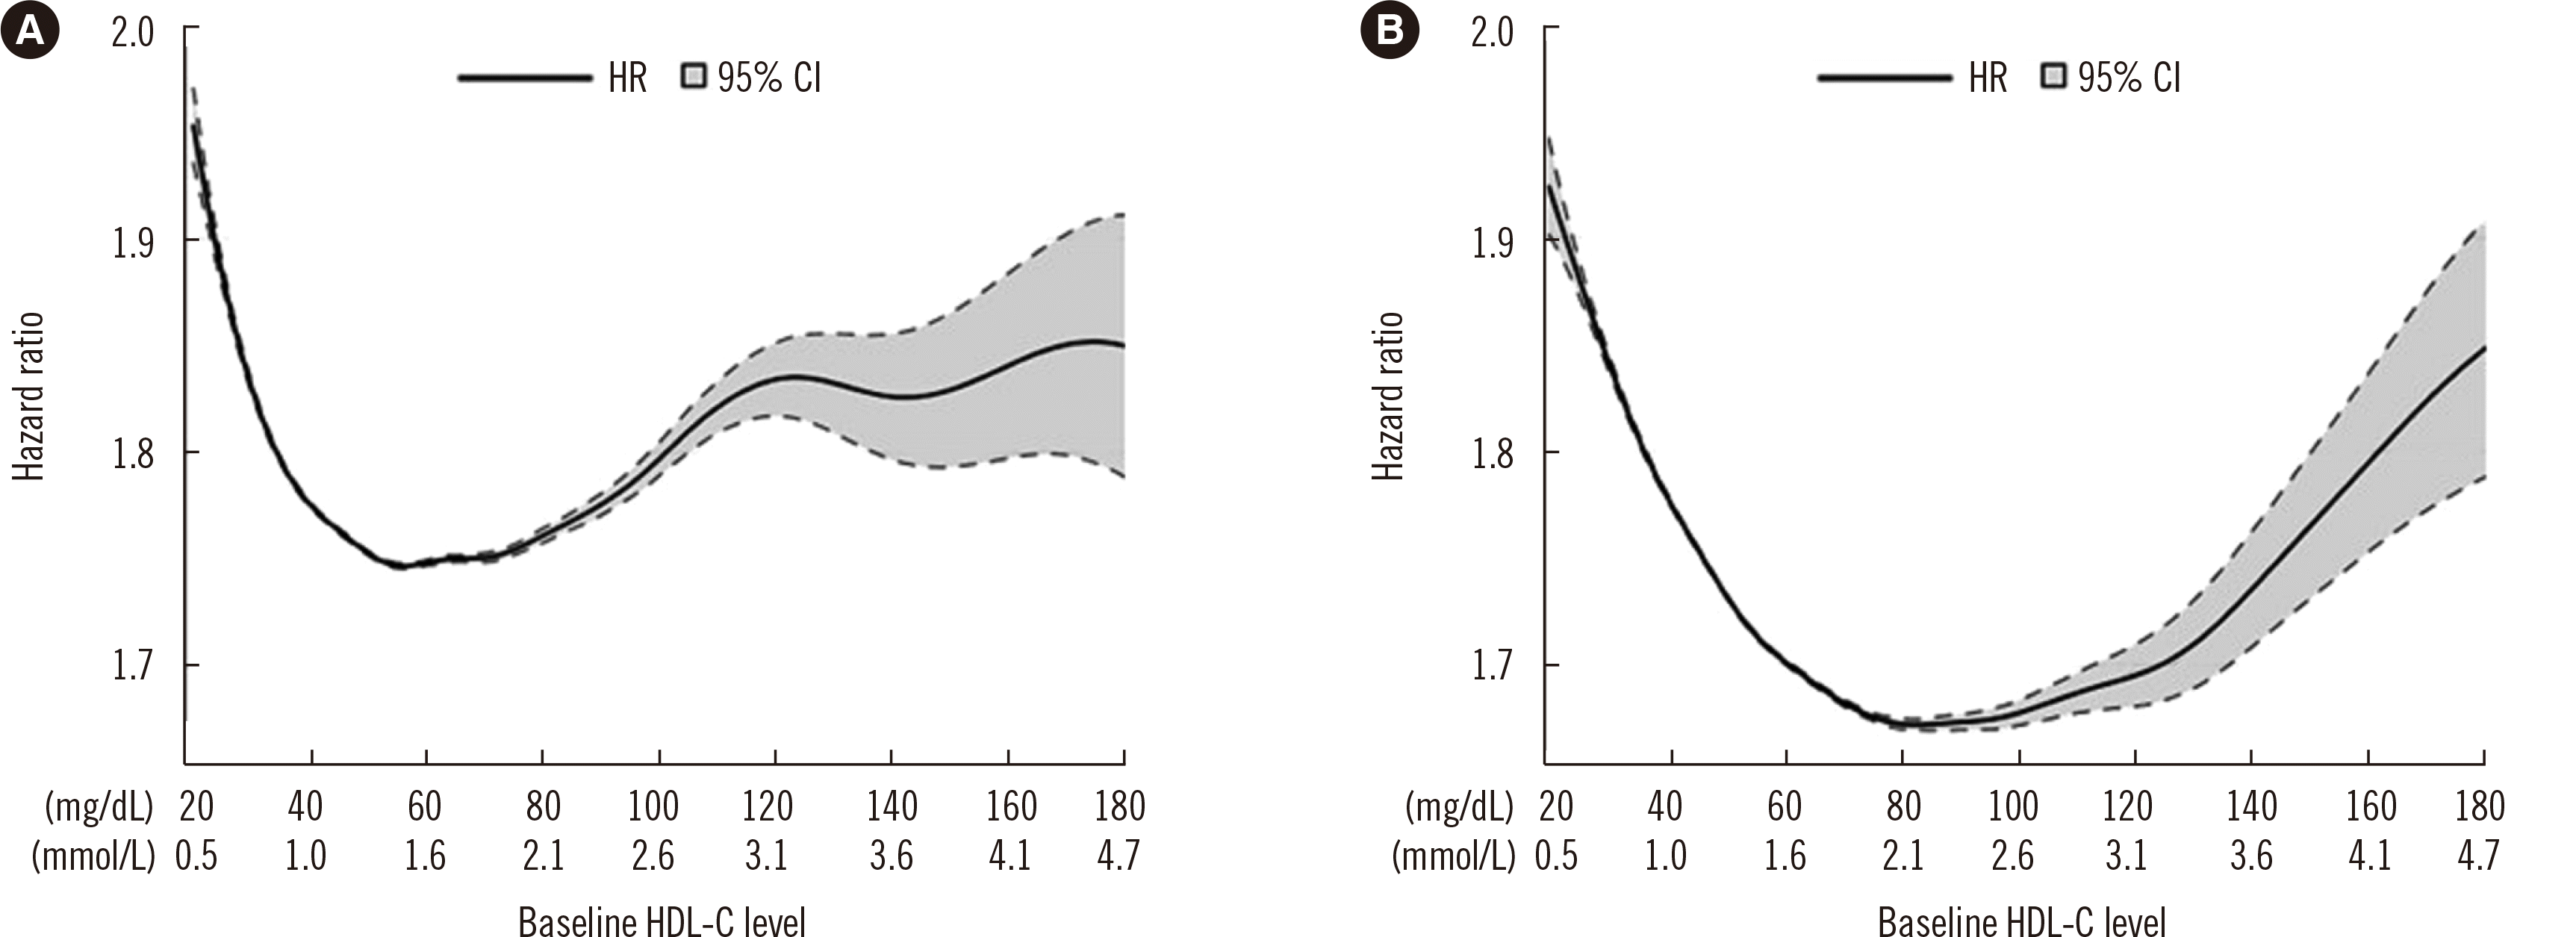
Cubic spline Cox proportional hazard regression model

In the cubic spline models, the risk of 10-year MACE showed a U shape for men and women on a continuous scale of HDL-C levels (Fig. 3). Both low anJd extremely high levels were associated with a higher 10-year MACE risk, and the risk showed later inflection in women.

DISCUSSION

This large population-based cohort study covering approximately 12% of the total South Korean population explored the relationship between HDL-C levels and 10-year MACE in ASCVD-free subjects who may need 10-year CV risk assessment for primary prevention. We found a U-shaped relationship between HDL-C levels and 10-year MACE, with later inflection in women than in men. There are conflicting reports on whether there is a U-shaped relationship between HDL-C and CV risk or mortality. Although complex factors may affect individual studies, an accurate interpretation of extremely high HDL-C levels is critical to understand the right end of the curve (linear, plateau, or U-shape). Two issues should be emphasized: (1) the definition of “extremely high HDL-C” level and (2) outcome variables.
Based on our HDL-C distribution data, nearly all (98% of subjects were ≤2.33 mmol/L) fit a conventional-wisdom inverse relationship: the low HDL-C group showed higher 10-year MACE than the usual high HDL-C group (26.5% vs. 22.7%, P<0.0001). Most of the early epidemiological studies strongly supporting a linear inverse relationship did not pay attention to the small proportion of extremely high HDL-C levels [1-4]. Recent big-data studies supporting U-shaped relationships have focused on extremely high HDL-C levels and revealed an increased risk of all-cause mortality. The U.S. Veterans study (N=1,764,986) demonstrated a U-shaped relationship between HDL-C levels and all-cause mortality [8]. The CANHEART study (N=631,762) revealed that higher HDL-C levels (>1.81 mmol/L in men, >2.33 mmol/L in women) implied an increased hazard of non-CV mortality [6]. The Copenhagen study (N=52,268) demonstrated increased risks of all-cause mortality in their extremely high HDL-C group in men (2.5-2.99 mmol/L and ≥3.0 mmol/L, reference 1.9 mmol/L; HR 1.36 and 2.06, respectively) and women (3.0-3.49 mmol/L and ≥3.5 mmol/L, reference 2.4 mmol/L; HR 1.10 and 1.68, respectively) [7].
The EPOCH-JAPAN study (N=43,407) demonstrated that extremely high HDL-C levels (≥2.33 mmol/L) were associated with increased ASCVD mortality [9]. However, regarding coronary artery diseases outcomes, there have been heterogeneous risk patterns: plateau or continuously inverse linear [19, 20]. Similarly, two Korean studies based on the NHIS cohort (Oh, et al. [21], N=365,457, median follow-up; 3.5 years; Yang, et al. [22], N=343,687, median follow-up, 6 years) reported an inverse linear relationship between HDL-C levels and CV mortality, but U- or J-shaped curves for all-cause mortality. Compared with the two Korean reports, the present study used well-balanced cohort data, which covered all follow-up records of those who were enrolled in 2009 (N=5,703,897, single index year, exclusion of all prior clinical ASCVD, 10-year follow-up). Although we did not examine each CV disease, this large population-based study clearly confirmed that a U-shaped relationship exists between HDL-C levels and 10-year composite end points of MACE (including all-cause mortality) in the South Korean population (Fig. 3).
In this study, the hypothesis that the classic extremely high HDL-C level (>90 mg/dL [2.33 mmol/L]) is associated with higher 10-year MACE than the high HDL-C level (men 40-90 mg/dL [1.03-2.33 mmol/L], women 50-90 mg/dL [1.29-2.33 mmol/L]) was true for men, but not for women. This study offers two potentially important lessons: cutoff values should first be chosen by looking at the entire distribution and then should be separated by sex. In women, our approach to shifting the reference beyond the nadir (80-99 mg/dL [2.07-2.56 mmol/L]) seemed appropriate given the U-shaped distribution, and the true extremely high HDL-C level, not >90 mg/dL (2.33 mmol/L) but >130 mg/dL (3.36 mmol/L), revealed a significant HR of 10-year MACE (0.99 [95% CI: 0.97-1.01], 1.14 [1.04-1.25], respectively) (Table 3).
Sex-specific reference limits are essential in HDL-C studies. The proportion of women increases with increasing HDL-C level [6, 7]. Men have a more atherogenic profile than women, with lower levels of HDL2 subfraction [23]. Sex-specific clinical studies may yield different results when the extremely high HDL-C level is set higher in women: extremely high HDL-C level (in this case, ≥2.07 mmol/L) was associated with a significant reduction in flow-mediated vasodilation in men, but not in women [24, 25]. Sex-specific reference limits have already been applied for the lower optimal cutoffs (men <40 mg/dL [1.03 mmol/L], women <50 mg/dL [1.29 mmol/L]) [10]. Our extremely large study has clinical value in that it is the first to recommend sex-specific optimal upper reference limits and true extremely high HDL-C cutoffs in the Korean population.
The pathophysiological role of extremely high HDL-C levels being linked with MACE risk remains to be elucidated. Mendelian genetic randomization failed to prove causal effects, and several pharmacological trials to increase HDL-C levels failed to reduce the risk of ASCVD [26-29]. Several pathological conditions could contribute to both extremely high HDL-C levels and alleged CV risk factors: genetic alterations, inflammatory diseases, thyroid disorders, and liver diseases. For example, scavenger receptor BI increases the HDL-C level as well as the risk of coronary heart diseases [30]. Reduced cholesterol efflux capacity and HDL phospholipid content have been associated with extremely high HDL-C levels and coronary artery diseases [31]. In this study, alcohol consumption, known to increase HDL-C levels, was higher in both men and women in the extremely high HDL-C group, in line with findings in the Copenhagen study [7]. In men, but not in women, elevated BP, possibly related to alcohol consumption, was also more frequent in the extremely high HDL-C group; this finding may indicate that extremely high HDL-C levels may be a marker of an unhealthy lifestyle. We can speculate that in some cases, the dysfunctional HDL particles (boosted by pathological conditions), not the good HDL particles (boosted by good lifestyles), induced extremely high HDL-C levels; in such cases, this disease marker may have contributed to the higher all-cause mortality [21, 32].
In the general population, having a high HDL-C level should not be presumed to always be protective. In clinical practice, extremely high HDL-C levels should not be used in the pooled cohort ASCVD risk equation or in the non-HDL-C calculation (TC-HDL-C), as they may underestimate the actual ASCVD risk [5, 10, 12]. Emphasizing the sex-specific values, the ESC/EAS guidelines description of the extremely high HDL-C level >90 mg/dL (2.33 mmol/L) could possibly be updated, at least for the Korean population, with sex-specific reference limits: the extremely high HDL-C level at 90 mg/dL (2.33 mmol/L) in men corresponded in risk to 130 mg/dL (3.36 mmol/L) in women [12]. Our study is particularly meaningful to women who have an HDL-C level in the range 90-99 mg/dL (2.33-2.56 mmol/L)—a risk nadir in women—but are misclassified as having higher risk based on the current guidelines.
This study has several limitations. First, as it was a retrospective cohort study, we could not confirm a causal relationship between HDL-C levels and MACE. Second, we analyzed all-cause mortality instead of CV mortality in a composite end point of MACE, as the National Death Registry of Korea provides only deceased dates, without causes of death. Third, some variables had missing data. Fourth, the categorization of HDL-C levels may have resulted in loss of information [33]. To determine reference ranges in clinical practice, our approach using 10 mg/dL (0.26 mmol/L) intervals seemed acceptable for an initial exploration; ultimately, we also used continuous scale cubic splines in a Cox proportional hazard regression model to confirm the relationship between HDL-C levels and 10-year MACE. Finally, HDL is a complex molecule with a mixture of heterogeneous atheroprotective subclasses, and the measured HDL-C level refers to the amount of cholesterol contained in the HDL particle. Therefore, quantitative measurement of total HDL-C levels does not necessarily represent HDL particle numbers, subclass distribution, apolipoprotein A-I, or HDL function [31, 34]. Qualitative measurement is warranted in future studies.
We conclude that in the South Korean population without prior ASCVD, HDL-C levels showed a U-shaped relationship with 10-year MACE, with later inflection in women than in men (nadir: 80-99 mg/dL [2.07-2.56 mmol/L] and 50-59 mg/dL [1.29-1.53 mmol/L], respectively). This study, with a well-balanced and substantially larger population, reinforced and confirmed the findings of other recent cohort studies [6-9]. We suggested sex-specific reference limits for men (optimal 40-70 mg/dL [1.03-1.81 mmol/L]; extremely high >90 mg/dL [2.33 mmol/L]) and women (optimal 50-110 mg/dL [1.29-2.84]; extremely high >130 mg/dL [3.36 mmol/L]). Our findings suggest that sex-specific extremely high HDL-C levels should be a warning when estimating CV risk in the pooled cohort ASCVD equation or non-HDL-C calculation.

Supplemental Materials

ACKNOWLEDGEMENTS

None declared.

Notes

AUTHOR CONTRIBUTIONS

Yang HS designed the study, analyzed the data, and wrote the draft; Hur M and Lee S conceived the study, analyzed the data, and finalized the draft; Jeong HJ, Kim H, and Hwang HK collected, analyzed, and discussed the data and reviewed the manuscript. All authors read and approved the final manuscript.

CONFLICTS OF INTEREST

None declared.

RESEARCH FUNDING

This work was supported by Konkuk University Medical Center Research Grant 2020-10.

REFERENCES

1. Gordon DJ, Probstfield JL, Garrison RJ, Neaton JD, Castelli WP, Knoke JD, et al. 1989; High-density lipoprotein cholesterol and cardiovascular disease. Four prospective American studies. Circulation. 79:8–15. DOI: 10.1161/01.CIR.79.1.8. PMID: 2642759.
crossref
2. Di Angelantonio E, Sarwar N, Perry P, Kaptoge S, Ray KK, et al. Emerging Risk Factors Collaboration. 2009; Major lipids, apolipoproteins, and risk of vascular disease. JAMA. 302:1993–2000. DOI: 10.1001/jama.2009.1619. PMID: 19903920. PMCID: PMC3284229.
crossref
3. Laitinen DL, Manthena S, Webb S. 2010; Association between HDL-C concentration and risk for a major cardiovascular event. Curr Med Res Opin. 26:933–41. DOI: 10.1185/03007991003656968. PMID: 20163298.
crossref
4. Ahmed HM, Miller M, Nasir K, McEvoy JW, Herrington D, Blumenthal RS, et al. 2016; Primary low level of high-density lipoprotein cholesterol and risks of coronary heart disease, cardiovascular disease, and death: results from the Multi-Ethnic Study of Atherosclerosis. Am J Epidemiol. 183:875–83. DOI: 10.1093/aje/kwv305. PMID: 27189327. PMCID: PMC4867155.
crossref
5. Goff DC Jr, Lloyd-Jones DM, Bennett G, Coady S, D'Agostino RB Sr., Gibbons R, et al. 2014; 2013 ACC/AHA guideline on the assessment of cardiovascular risk: a report of the American College of Cardiology/American Heart Association Task Force on practice guidelines. J Am Coll Cardiol. 63:2935–59. DOI: 10.1016/j.jacc.2013.11.005. PMID: 24239921. PMCID: PMC4700825.
6. Ko DT, Alter DA, Guo H, Koh M, Lau G, Austin PC, et al. 2016; High-density lipoprotein cholesterol and cause-specific mortality in individuals without previous cardiovascular conditions: the CANHEART study. J Am Coll Cardiol. 68:2073–83. DOI: 10.1016/j.jacc.2016.08.038. PMID: 27810046.
7. Madsen CM, Varbo A, Nordestgaard BG. 2017; Extreme high-density lipoprotein cholesterol is paradoxically associated with high mortality in men and women: two prospective cohort studies. Eur Heart J. 38:2478–86. DOI: 10.1093/eurheartj/ehx163. PMID: 28419274.
8. Bowe B, Xie Y, Xian H, Balasubramanian S, Zayed MA, Al-Aly Z. 2016; High density lipoprotein cholesterol and the risk of all-cause mortality among U.S. Veterans. Clin J Am Soc Nephrol. 11:1784–93. DOI: 10.2215/CJN.00730116. PMID: 27515591. PMCID: PMC5053782.
crossref
9. Hirata A, Sugiyama D, Watanabe M, Tamakoshi A, Iso H, Kotani K, et al. 2018; Association of extremely high levels of high-density lipoprotein cholesterol with cardiovascular mortality in a pooled analysis of 9 cohort studies including 43,407 individuals: The EPOCH-JAPAN study. J Clin Lipidol. 12:674–84.e5. DOI: 10.1016/j.jacl.2018.01.014. PMID: 29506864.
crossref
10. Arnett DK, Blumenthal RS, Albert MA, Buroker AB, Goldberger ZD, Hahn EJ, et al. 2019; 2019 ACC/AHA Guideline on the primary prevention of cardiovascular disease: a report of the American College of Cardiology/American Heart Association Task Force on clinical practice guidelines. Circulation. 140:e596–e646. DOI: 10.1161/CIR.0000000000000725. PMID: 30879355. PMCID: PMC7734661.
11. ASCVD Risk Estimator Plus. ACC recommendation. https://tools.acc.org/ascvd-risk-estimator-plus/#!/calculate/estimate/.
12. Mach F, Baigent C, Catapano AL, Koskinas KC, Casula M, Badimon L, et al. 2020; 2019 ESC/EAS Guidelines for the management of dyslipidaemias: lipid modification to reduce cardiovascular risk. Eur Heart J. 41:111–88. DOI: 10.1093/eurheartj/ehz455. PMID: 31504418.
13. Rodriguez A. 2021; High HDL-cholesterol paradox: SCARB1-LAG3-HDL axis. Curr Atheroscler Rep. 23:5. DOI: 10.1007/s11883-020-00902-3. PMID: 33398433. PMCID: PMC7782461.
crossref
14. Grundy SM, Stone NJ, Bailey AL, Beam C, Birtcher KK, Blumenthal RS, et al. 2019; 2018 AHA/ACC/AACVPR/AAPA/ABC/ACPM/ADA/AGS/APhA/ASPC/NLA/PCNA Guideline on the management of blood cholesterol: a report of the American College of Cardiology/American Heart Association Task Force on clinical practice guidelines. Circulation. 139:e1082–e143. DOI: 10.1161/CIR.0000000000000624. PMID: 30586774. PMCID: PMC7403606.
15. Korean standard classification of diseases. Seoul: Statistics Korea;2020. http://kssc.kostat.go.kr.
16. Seo MH, Lee WY, Kim SS, Kang JH, Kang JH, Kim KK, et al. 2019; 2018 Korean Society for the Study of Obesity Guideline for the management of obesity in Korea. J Obes Metab Syndr. 28:40–5. DOI: 10.7570/jomes.2019.28.1.40. PMID: 31089578. PMCID: PMC6484940.
crossref
17. Heinze G, Dunkler D. 2017; Five myths about variable selection. Transpl Int. 30:6–10. DOI: 10.1111/tri.12895. PMID: 27896874.
crossref
18. Varbo A, Benn M, Tybjærg-Hansen A, Jørgensen AB, Frikke-Schmidt R, Nordestgaard BG. 2013; Remnant cholesterol as a causal risk factor for ischemic heart disease. J Am Coll Cardiol. 61:427–36. DOI: 10.1016/j.jacc.2012.08.1026. PMID: 23265341.
crossref
19. Wilkins JT, Ning H, Stone NJ, Criqui MH, Zhao L, Greenland P, et al. 2014; Coronary heart disease risks associated with high levels of HDL cholesterol. J Am Heart Assoc. 3:e000519. DOI: 10.1161/JAHA.113.000519. PMID: 24627418. PMCID: PMC4187512.
crossref
20. Tashiro K, Inoue H, Shiga Y, Tsukihashi Y, Imaizumi T, Norimatsu K, et al. 2020; Associations between high levels of high-density lipoprotein cholesterol and the presence and severity of coronary artery disease in patients who have undergone coronary computed tomography angiography. J Clin Med Res. 12:734–9. DOI: 10.14740/jocmr4367. PMID: 33224375. PMCID: PMC7665872.
crossref
21. Oh IH, Hur JK, Ryoo JH, Jung JY, Park SK, Yang HJ, et al. 2019; Very high high-density lipoprotein cholesterol is associated with increased all-cause mortality in South Koreans. Atherosclerosis. 283:43–51. DOI: 10.1016/j.atherosclerosis.2019.01.035. PMID: 30776703.
crossref
22. Yang Y, Han K, Park SH, Kim MK, Yoon KH, Lee SH. 2021; High-density lipoprotein cholesterol and the risk of myocardial infarction, stroke, and cause-specific mortality: a nationwide cohort study in Korea. J Lipid Atheroscler. 10:74–87. DOI: 10.12997/jla.2021.10.1.74. PMID: 33537255. PMCID: PMC7838511.
crossref
23. Anagnostis P, Stevenson JC, Crook D, Johnston DG, Godsland IF. 2015; Effects of menopause, gender and age on lipids and high-density lipoprotein cholesterol subfractions. Maturitas. 81:62–8. DOI: 10.1016/j.maturitas.2015.02.262. PMID: 25804951.
crossref
24. Takaeko Y, Matsui S, Kajikawa M, Maruhashi T, Kishimoto S, Hashimoto H, et al. 2019; Association of extremely high levels of high-density lipoprotein cholesterol with endothelial dysfunction in men. J Clin Lipidol. 13:664–72.e1. DOI: 10.1016/j.jacl.2019.06.004. PMID: 31311726.
crossref
25. Takaeko Y, Matsui S, Kajikawa M, Maruhashi T, Yamaji T, Harada T, et al. 2020; Relationship between high-density lipoprotein cholesterol levels and endothelial function in women: a cross-sectional study. BMJ Open. 10:e038121. DOI: 10.1136/bmjopen-2020-038121. PMID: 32641366. PMCID: PMC7342861.
crossref
26. Holmes MV, Asselbergs FW, Palmer TM, Drenos F, Lanktree MB, Nelson CP, et al. 2015; Mendelian randomization of blood lipids for coronary heart disease. Eur Heart J. 36:539–50. DOI: 10.1093/eurheartj/eht571. PMID: 24474739. PMCID: PMC4344957.
27. Boden WE, Probstfield JL, Anderson T, Chaitman BR, Desvignes-Nickens P, et al. AIM-HIGH Investigators. 2011; Niacin in patients with low HDL cholesterol levels receiving intensive statin therapy. N Engl J Med. 365:2255–67. DOI: 10.1056/NEJMoa1107579. PMID: 22085343.
crossref
28. Lincoff AM, Nicholls SJ, Riesmeyer JS, Barter PJ, Brewer HB, Fox KAA, et al. 2017; Evacetrapib and cardiovascular outcomes in high-risk vascular disease. N Engl J Med. 376:1933–42. DOI: 10.1056/NEJMoa1609581. PMID: 28514624.
crossref
29. Tardif JC, Ballantyne CM, Barter P, Dasseux JL, Fayad ZA, Guertin MC, et al. 2014; Effects of the high-density lipoprotein mimetic agent CER-001 on coronary atherosclerosis in patients with acute coronary syndromes: a randomized trial. Eur Heart J. 35:3277–86. DOI: 10.1093/eurheartj/ehu171. PMID: 24780501. PMCID: PMC4258222.
30. Zanoni P, Khetarpal SA, Larach DB, Hancock-Cerutti WF, Millar JS, Cuchel M, et al. 2016; Rare variant in scavenger receptor BI raises HDL cholesterol and increases risk of coronary heart disease. Science. 351:1166–71. DOI: 10.1126/science.aad3517. PMID: 26965621. PMCID: PMC4889017.
31. Agarwala AP, Rodrigues A, Risman M, McCoy M, Trindade K, Qu L, et al. 2015; High-density lipoprotein (HDL) phospholipid content and cholesterol efflux capacity are reduced in patients with very high HDL cholesterol and coronary disease. Arterioscler Thromb Vasc Biol. 35:1515–9. DOI: 10.1161/ATVBAHA.115.305504. PMID: 25838421. PMCID: PMC4560933.
crossref
32. Madsen CM, Varbo A, Tybjærg-Hansen A, Frikke-Schmidt R, Nordestgaard BG. 2018; U-shaped relationship of HDL and risk of infectious disease: two prospective population-based cohort studies. Eur Heart J. 39:1181–90. DOI: 10.1093/eurheartj/ehx665. PMID: 29228167.
crossref
33. Royston P, Altman DG, Sauerbrei W. 2006; Dichotomizing continuous predictors in multiple regression: a bad idea. Stat Med. 25:127–41. DOI: 10.1002/sim.2331. PMID: 16217841.
crossref
34. Yang HS, Hur M, Kim H, Kim SJ, Shin S, Di Somma S, et al. 2020; HDL Subclass analysis in predicting metabolic syndrome in Koreans with high HDL cholesterol levels. Ann Lab Med. 40:297–305. DOI: 10.3343/alm.2020.40.4.297. PMID: 32067428. PMCID: PMC7054694.
crossref

Fig. 1
Flow diagram of the study population enrollment in the retrospective nationwide cohort study.
Abbreviations: HDL-C, high-density lipoprotein cholesterol; LDL-C, low-density lipoprotein cholesterol; ASCVD, atherosclerotic cardiovascular diseases (angina, acute myocardial infarction or acute coronary syndrome, prior myocardial infarction or chronic ischemic heart disease, prior coronary arterial revascularization, stroke, transient ischemic attack, and peripheral arterial disease); MACE, major adverse cardiovascular events (new-onset angina, acute myocardial infarction, cardiac arrest, stroke, and all-cause mortality).
alm-42-4-415-f1.tif
Fig. 2
Distribution of subjects with 10-year MACE by the baseline HDL-C levels in 10 mg/dL (0.26 mmol/L) intervals and by the three-groups exploring extremely high HDL-C levels. (A) For all subjects (N=5,703,897), the relationship between HDL-C levels and 10-year MACE is U-shaped. A polynomial trend line (red dots) shows R2 of 0.986 (y=0.0005x4-0.032x3+0.81x2-7.55x+44.08). The nadir of the HDL-C interval is 70-79 mg/dL (1.81-2.04 mmol/L). (B) From each sex (men, N=2,967,452; women, N=2,736,445), a U-shaped pattern exists with different inflection points. Blue color bars represent the percentage distribution of men subjects, with the nadir at 50-59 mg/dL (1.29-1.53 mmol/L); red color bars for women subjects, with the nadir at 80-99 mg/dL (2.07-2.56 mmol/L). For men, a polynomial trend-line (blue dots) fit R2 of 0.959 (y=0.0022x4−0.11x3+1.85x2−11.99x+50.1); for women, a polynomial trend-line (red dots) fit R2 of 0.914 (y=-0.0029x3+ 0.28x2−4.41x+37.37). (C) Exploring extremely high (ext. high) HDL-C cutoffs: comparisons of the three HDL-C categories by sex. Three-group comparisons [low HDL-C group: men<40 mg/dL (1.03 mmol/L), women<50 mg/dL (1.29 mmol/L); high HDL-C group: between; ext. high HDL-C group >values as explored] by chi-square test. *P<0.0001 (low vs. high or ext. high); P<0.0001 (high vs. low or ext. high). In men (N=2,967,452), the 10-year MACE of the ext. high HDL-C group is higher than that of the high HDL-C group at >70 mg/dL (1.81 mmol/L) or >80 mg/dL (2.07 mmol/L) (P<0.0001) and similar to the low group at >90 mg/dL (2.33 mmol/L) (P=0.92). Note the classic model [ext. high >90 mg/dL (2.33 mmol/L)]. In women (N=2,736,445), that point is delayed. The 10-year MACE of ext. high HDL-C group exceeds the high HDL-C group at >110 mg/dL (2.84 mmol/L) (P=0.044) or >120 mg/dL (3.10 mmol/L) (P<0.0001) and is similar to the low HDL-C group at >130 mg/dL (3.36 mmol/L) (P=0.97). Note that in the classic model [ext. high >90 mg/dL (2.33 mmol/L)], the ext. high HDL-C group has a significantly lower 10-year MACE than the high HDL-C group (P<0.0001).
Abbreviations: HDL-C, high-density lipoprotein cholesterol; MACE, major adverse cardiovascular events (new-onset angina, acute myocardial infarction, cardiac arrest, stroke, and all-cause mortality).
alm-42-4-415-f2.tif
Fig. 3
Multivariate adjusted HR for 10-year MACE by HDL-C levels (continuous variables). The relationship between HDL-C levels on a continuous scale and 10-year MACE risk was U-shaped for men (A) and women (B).
Abbreviations: HR, hazard ratio; HDL-C, high-density lipoprotein cholesterol; MACE, major adverse cardiovascular events (new-onset angina, acute myocardial infarction, cardiac arrest, stroke, and all-cause mortality).
alm-42-4-415-f3.tif
Table 1
Baseline characteristics of subjects and each of the three classic groups categorized by baseline HDL-C levels
All subjects Men Women


Total Low HDL-C High HDL-C Extremely high HDL-C Total Low HDL-C High HDL-C Extremely high HDL-C Total Low HDL-C High HDL-C Extremely high HDL-C
Subjects, N (%) 5,703,897 (100) 1,257,072 (22.0) 4,356,104 (76.4) 90,721 (1.6) 2,967,452 (100) 444,690 (15.0) 2,488,885 (83.9) 33,877 (1.1) 2,736,445 (100) 812,382 (29.7) 1,867,219 (68.2) 56,844 (2.1)
Age (yr, mean ± SD) 52.6 ± 9.8 53.9 ± 10.4 52.2 ± 9.6 52.2 ± 9.5 52.3 ± 9.7 53.5 ± 9.8 52.2 ± 9.6 53.7 ± 10.0 52.9 ± 10.0 54.7 ± 10.6 52.2 ± 9.6 51.4 ± 9.1
40-49, N (%) 2,554,534 (44.8) 500,666 (39.8) 2,013,148 (46.2) 40,720 (44.9) 1,378,657 (46.5) 202,147 (45.5) 1,162,895 (46.7) 13,615 (40.2) 1,175,877 (43.0) 298,519 (36.8) 850,253 (45.5) 27,105 (47.7)
50-59, N (%) 1,787,223 (31.3) 391,571 (31.1) 1,365,502 (31.3) 30,150 (33.2) 909,808 (30.7) 137,705 (31.0) 761,465 (30.6) 10,638 (31.4) 877,415 (32.1) 253,866 (31.3) 604,037 (32.4) 19,512 (34.3)
60-69, N (%) 940,227 (16.5) 240,100 (19.1) 686,038 (15.7) 14,089 (15.5) 478,065 (16.1) 72,033 (16.2) 399,174 (16.0) 6,858 (20.2) 462,162 (16.9) 168,067 (20.7) 286,864 (15.4) 7,231 (12.7)
70-79, N (%) 369,304 (6.5) 107,356 (8.5) 256,932 (5.9) 5,016 (5.5) 178,549 (6.0) 28,923 (6.5) 147,165 (5.9) 2,461 (7.3) 190,755 (7.0) 78,433 (9.7) 109,767 (5.9) 2,555 (4.5)
≥ 80, N (%) 52,609 (0.9) 17,379 (1.4) 34,484 (0.8) 746 (0.8) 22,373 (0.8) 3,882 (0.9) 18,186 (0.7) 305 (0.9) 30,236 (1.1) 13,497 (1.7) 16,298 (0.9) 441 (0.8)
BMI (kg/m2) 23.8 ± 3.2 24.4 ± 3.0 23.7 ± 3.0 22.5 ± 8.6 24.1 ± 2.9 24.9 ± 2.8 23.9 ± 2.9 22.5 ± 2.9 23.6 ± 3.4 24.2 ± 3.1 23.3 ± 3.1 22.5 ± 10.6
Obesity*, N (%) 1,820,717 (31.9) 494,192 (39.3) 1,310,289 (30.1) 16,236 (17.9) 1,044,494 (35.2) 206,081 (46.3) 832,164 (33.4) 6,249 (18.4) 776,223 (28.4) 288,111 (35.5) 478,125 (25.6) 9,987 (17.6)
Abd. obesity, N (%) 1,147,136 (20.1) 332,098 (26.4) 804,993 (18.5) 10,045 (11.1) 650,080 (21.9) 135,461 (30.5) 510,574 (20.5) 4,045 (11.9) 497,056 (18.2) 196,637 (24.2) 294,419 (15.8) 6,000 (10.6)
Smoking, N (%)
Never 3,493,447 (61.6) 900,245 (72.1) 2,530,014 (58.4) 63,188 (70.0) 894,553 (30.3) 128,575 (29.1) 755,887 (30.5) 10,091 (29.9) 2,598,894 (95.7) 771,670 (95.7) 1,774,127 (95.7) 53,097 (94.0)
Past 887,892 (15.7) 127,371 (10.2) 750,131 (17.4) 10,390 (11.5) 850,655 (28.8) 117,001 (26.5) 724,319 (29.3) 9,335 (27.7) 38,137 (1.4) 10,370 (1.3) 26,712 (1.4) 1,055 (1.9)
Current 1,285,914 (22.7) 220,844 (17.7) 1,048,396 (24.2) 16,674 (18.5) 1,206,288 (40.9) 196,600 (44.5) 995,359 (40.2) 14,329 (42.5) 79,626 (2.9) 24,244 (3.0) 53,037 (2.9) 2,345 (4.2)
Alcohol, N (%)
None 3,096,108 (55.0) 864,014 (69.8) 2,188,755 (50.9) 43,339 (48.2) 978,688 (33.3) 189,543 (43.2) 782,141 (31.7) 7,004 (20.8) 2,117,420 (78.6) 674,471 (84.5) 1,406,614 (76.5) 36,335 (64.6)
One time/week 1,037,853 (18.4) 192,426 (15.6) 830,175 (19.3) 15,252 (17.0) 675,267 (23.0) 107,529 (24.5) 562,385 (22.8) 5,353 (15.9) 362,586 (13.5) 84,897 (10.6) 267,790 (14.6) 9,899 (17.6)
Two times/week 667,238 (11.8) 90,599 (7.3) 565,254 (13.1) 11,385 (12.7) 547,510 (18.6) 68,103 (15.5) 473,047 (19.2) 6,360 (18.9) 119,728 (4.4) 22,496 (2.8) 92,207 (5.0) 5,025 (8.9)
≥ three times/week 831,110 (14.8) 90,576 (7.3) 720,535 (15.7) 19,999 (22.2) 735,947 (25.1) 73,830 (16.8) 647,127 (26.3) 14,990 (44.5) 95,163 (3.5) 16,746 (2.1) 73,408 (4.0) 5,009 (8.9)
SBP (mm Hg) 123.5 ± 15.4 123.7 ± 15.5 123.4 ± 15.3 123.5 ± 16.2 125.6 ± 14.7 125.4 ± 14.6 125.6 ± 14.8 128.1 ± 16.2 121.2 ± 15.7 122.7 ± 15.9 120.5 ± 15.5 120.7 ± 15.5
DBP (mm Hg) 77.0 ± 10.2 76.8 ± 10.2 77.0 ± 10.3 77.0 ± 10.7 78.7 ± 10.0 78.6 ± 9.9 78.8 ± 10.0 80.1 ± 10.6 75.1 ± 10.2 75.8 ± 10.2 74.7 ± 10.1 75.2 ± 10.3
Hypertension, N (%) 1,503,715 (26.4) 379,159 (30.2) 1,102,303 (25.3) 22,253 (24.5) 831,042 (28.0) 134,508 (30.2) 685,872 (27.6) 10,662 (31.5) 672,673 (24.6) 244,651 (30.1) 416,431 (22.3) 11,591 (20.4)
DM, N (%) 620,744 (10.9) 169,273 (13.5) 443,664 (10.2) 7,807 (8.6) 384,756 (13.0) 73,416 (16.5) 306,958 (12.3) 4,382 (12.9) 235,988 (8.6) 95,857 (11.8) 136,706 (7.3) 3,425 (6.0)
Blood test at baseline, mg/dL (mmol/L)
Glucose 94 [87-104] 95 [87-105] 94 [87-104] 94 [87-103] 96 [88-107] 97 [88-109] 96 [88-107] 97 [88-109] 93 [86-101] 93 [86-102] 92 [85-100] 92 [85-100]
5.2 [4.8-5.8] 5.3 [4.8-5.8] 5.2 [4.8-5.8] 5.2 [4.8-5.7] 5.3 [4.9-5.9] 5.4 [4.9-6.1] 5.3 [4.9-5.9] 5.4 [4.9-6.1] 5.2 [4.8-5.6] 5.2 [4.8-5.7] 5.1 [4.7-5.6] 5.1 [4.7-5.6]
sCr 0.9 [0.8-1.0] 0.8 [0.7-1.0] 0.9 [0.8-1.0] 0.9 [0.7-1.0] 1.0 [0.9-1.1] 1.0 [0.9-1.1] 1.0 [0.9-1.1] 1.0 [0.9-1.1] 0.8 [0.7-0.9] 0.8 [0.7-0.9] 0.8 [0.7-0.9] 0.8 [0.7-0.9]
79.6 [70.7-88.4] 70.7 [61.9-88.4] 79.6 [70.7-88.4] 79.6 [61.9-88.4] 88.4 [79.6-97.3] 88.4 [79.6-97.3] 88.4 [79.6-97.3] 88.4 [79.6-97.3] 70.7 [61.9-79.6] 70.7 [61.9-79.6] 70.7 [61.9-79.6] 70.7 [61.9-79.6]
TC 197 [174-222] 189 [166-214] 199 [176-223] 217 [194-242] 196 [173-220] 186 [163-210] 197 [175-222] 213 [190-238] 198 [175-224] 191 [167-217] 200 [178-226] 219 [196-244]
5.09 [4.5-5.74] 4.89 [4.29-5.53] 5.15 [4.55-5.77] 5.61 [5.01-6.26] 5.07 [4.47-5.69] 4.81 [4.22-5.43] 5.09 [4.53-5.74] 5.51 [4.91-6.16] 5.12 [4.53-5.79] 4.94 [4.32-5.61] 5.17 [4.60-5.84] 5.66 [5.07-6.31]
LDL-C 116 [94-138] 116 [94-139] 116 [95-138] 99 [75-123] 114 [92-136] 110 [88-133] 115 [93-137] 99 [75-123] 118 [97-141] 119 [97-142] 118 [97-141] 103 [80-127]
3.0 [2.43-3.57] 3.0 [2.43-3.59] 3.0 [2.46-3.57] 2.56 [1.94-3.18] 2.95 [2.38-3.52] 2.84 [2.28-3.44] 2.97 [2.41-3.54] 2.56 [1.94-3.18] 3.05 [2.51-3.65] 3.08 [2.51-3.67] 3.05 [2.51-3.65] 2.66 [2.07-3.28]
HDL-C 53 [45-63] 39 [36-45] 57 [50-65] 97 [93-104] 50 [43-60] 36 [33-38] 52 [46-61] 98 [94-106] 56 [48-66] 44 [40-47] 61 [55-69] 97 [93-104]
1.37 [1.16-1.63] 1.01 [0.93-1.16] 1.47 [1.29-1.68] 2.51 [2.41-2.69] 1.29 [1.11-1.55] 0.93 [0.85-0.98] 1.34 [1.19-1.58] 2.53 [2.43-2.74] 1.45 [1.24-1.71] 1.14 [1.03-1.22] 1.58 [1.42-1.78] 2.51 [2.41-2.69]
Triglycerides 113 [78-167] 142 [98-209] 107 [75-155] 77 [57-109] 129 [89-191] 179 [124-262] 123 [86-179] 87 [62-126] 98 [70-141] 126 [88-182] 90 [66-125] 73 [55-100]
1.28 [0.88-1.88] 1.6 [1.11-2.36] 1.21 [0.85-1.75] 0.87 [0.64-1.23] 1.46 [1.0-2.16] 2.02 [1.4-2.96] 1.39 [0.97-2.02] 0.98 [0.7-1.42] 1.11 [0.79-1.59] 1.42 [0.99-2.05] 1.02 [0.75-1.41] 0.82 [0.62-1.13]
Medications use at baseline, N (%)
Oral anti-thrombotic 336,867 (5.9) 93,526 (7.4) 239,320 (5.5) 4,021 (4.4) 178,847 (6.0) 32,479 (7.3) 144,665 (5.8) 1,703 (5.0) 158,020 (5.8) 61,047 (7.5) 94,655 (5.1) 2,318 (4.1)
Statins 326,127 (5.7) 81,053 (6.4) 239,562 (5.5) 5,512 (6.1) 145,254 (4.9) 22,194 (5.0) 121,340 (4.9) 1,720 (5.1) 180,873 (6.6) 58,859 (7.3) 118,222 (6.3) 3,792 (6.7)
Fenofibrate 10,129 (0.18) 2,962 (0.24) 7,102 (0.16) 65 (0.07) 6,414 (0.2) 1,357 (0.3) 5,026 (0.2) 31 (0.1) 3,715 (0.14) 1,605 (0.20) 2,076 (0.11) 34 (0.06)

Values are mean±SD, number (%), or median (interquartile range).

All baseline characteristics have P<0.0001 based on ANOVA or chi-square tests on the three groups (low, high, and extremely high HDL-C). In a post-hoc analysis, in all subjects, significant differences were found between all three classic subgroups, except for three variables (age, SBP, and DBP) between the high and extremely high groups. In a post-hoc analysis by sex, significant differences were found between all subgroups, except for use of alcohol twice per week in men (high vs. extremely high), use of statins in men (low vs. extremely high), never smoking in women (low vs. high), and sCr in women (high vs. extremely high).

*BMI >25 kg/m2; Abdominal obesity, waist circumference ≥90 cm in men, ≥85 cm in women.

Missing data are shown in Supplemental Data Table S1.

Abbreviations: SD, standard deviation; MACE, major adverse cardiovascular events; HDL-C, high-density lipoprotein cholesterol; n, number; BMI, body mass index; SBP, systolic blood pressure; DBP, diastolic blood pressure; DM, diabetes mellitus; sCr, serum creatinine; TC, total cholesterol; LDL-C, low-density lipoprotein cholesterol.

Table 2
Ten-year MACE and all-cause mortality: the three classic groups categorized by baseline HDL-C levels
Total (N=5,703,897) Low HDL-C (N=1,257,072) High HDL-C (N=4,356,104) Extremely high HDL-C (N=90,721) P
10-yr MACE
All cohorts, N (%) 1,341,669 (23.5) 333,011 (26.5) 988,579 (22.7) 20,079 (22.1) < 0.0001*
By sex, N (% of each sex)
Men 746,182 (25.2) 124,908 (28.1) 611,767 (24.6) 9,507 (28.1) < 0.0001
Women 595,487 (21.8) 208,103 (25.6) 376,812 (20.2) 10,572 (18.6) < 0.0001*
By age, N (% of each age subgroup)
40-49 yr 327,168 (12.8) 69,690 (13.9) 252,406 (12.5) 5,072 (12.5) < 0.0001
50-59 yr 413,224 (23.1) 97,000 (24.8) 309,759 (22.7) 6,465 (21.4) < 0.0001*
60-69 yr 355,175 (37.8) 93,092 (38.8) 256,890 (37.5) 5,193 (36.9) < 0.0001
70-79 yr 205,191 (55.6) 59,734 (55.6) 142,673 (55.5) 2,784 (55.5) 0.82
≥ 80 yr 40,911 (77.8) 13,495 (77.7) 26,851 (77.9) 565 (75.7) 0.35
All-cause mortality
All cohorts, N (%) 304,426 (5.3) 74,034 (5.9) 224,967 (5.2) 5,425 (6.0) < 0.0001
By sex, N (% of each sex)
Men 207,300 (7.0) 35,411 (8.0) 168,166 (6.8) 3,723 (11.0) < 0.0001*
Women 97,126 (3.6) 38,623 (4.8) 56,801 (3.0) 1,702 (3.0) < 0.0001
By age, N (% of each age subgroup)
40-49 yr 37,338 (1.5) 7,077 (1.4) 29,444 (1.5) 817 (2.0) < 0.0001*
50-59 yr 58,971 (3.3) 12,342 (3.2) 45,400 (3.3) 1,229 (4.1) < 0.0001*
60-69 yr 83,191 (8.9) 19,138 (8.0) 62,515 (9.1) 1,538 (10.9) < 0.0001*
70-79 yr 92,910 (25.2) 24,886 (23.2) 66,632 (25.9) 1,392 (27.8) < 0.0001*
≥ 80 yr 32,016 (60.9) 10,591 (60.9) 20,976 (60.8) 449 (60.2) 0.90

Values are number (%).

P values are from a chi-square test on the classic three groups. *low vs. high or extremely high, high vs. extremely high; high vs. low or extremely high; low vs. high or extremely high.

Abbreviations: HDL-C, high-density lipoprotein cholesterol; MACE, major adverse cardiovascular events.

Table 3
Hazard ratios of 10-year MACE by reference ranges in each sex
Reference range for HDL-C, mg/dL (mmol/L) Group variable Unadjusted HR (95% CI) P Adjusted HR* (95% CI) P*
Men
Classic 40-90 (1.03-2.33) Low 1.17 (1.16-1.17) < 0.0001 1.10 (1.09-1.10) < 0.0001
Extremely high 1.17 (1.14-1.19) < 0.0001 1.09 (1.07-1.11) < 0.0001
Model I 40-70 (1.03-1.81) Low 1.17 (1.16-1.18) < 0.0001 1.10 (1.09-1.10) < 0.0001
Extremely high 1.03 (1.03-1.04) < 0.0001 1.02 (1.01-1.02) 0.0003
Model II 40-90 (1.03-2.33) Low 1.17 (1.16-1.17) < 0.0001 1.10 (1.09-1.10) < 0.0001
Extremely high 1.17 (1.14-1.19) < 0.0001 1.09 (1.07-1.11) < 0.0001
Women
Classic 50-90 (1.29-2.33) Low 1.31 (1.30-1.31) < 0.0001 1.06 (1.05-1.06) < 0.0001
Extremely high 0.92 (0.90-0.94) < 0.0001 0.99 (0.97-1.01) 0.22
Model I 50-110 (1.29-2.84) Low 1.31 (1.30-1.32) < 0.0001 1.06 (1.05-1.07) < 0.0001
Extremely high 1.05 (1.00-1.11) 0.047 1.05 (1.00-1.10) 0.06
Model II 50-130 (1.29-3.36) Low 1.31 (1.30-1.32) < 0.0001 1.06 (1.05-1.07) < 0.0001
Extremely high 1.30 (1.18-1.42) < 0.0001 1.14 (1.04-1.25) 0.01

*Adjusted for age, BMI, LDL-C, triglycerides, hypertension, DM, smoking, and alcohol consumption; for variables, refer to Table 1.

Abbreviations: HR, hazard ratio; MACE, major adverse cardiovascular events; CI, confidence interval; BMI, body mass index; LDL-C, low-density lipoprotein-cholesterol; DM, diabetes mellitus; HDL-C, high-density lipoprotein cholesterol.

TOOLS
Similar articles