

 PDF
PDF Citation
 Print
Print


INTRODUCTION
Pain assessment is complex for a number of reasons. Pain is a subjective sensation and, as such, differs among individuals. This makes it difficult to measure pain in both clinical and research settings [12]. Since there is no medical test that can directly measure pain, health professionals must obtain self-reported data from patients, including information regarding pain sensation, intensity, and location, using validated questionnaires [3]. The use of body maps with highlighted body regions alongside a questionnaire can help in the identification and location of pain. Such methods have been used for many decades [4]. The ideal instrument should be easy to apply and rigorous in relation to psychometric properties [25].
Although a variety of instruments implement body maps for the precise identification of pain symptoms, no instrument has been validated for use in people with obesity or severe obesity. Pain location and extension have important implications for treatment, as these factors may indicate the cause of the pain [6]. The unique body fat composition patterns of these people mean that specific body maps are of vital importance [7]. Regardless of the target audience, the body map takes the same basic form: a silhouette representing a human body [48910]. However, body maps representing a lean body silhouette might not be adequate for use in people with obesity and could reduce the reliability of the data collected [11]. According to recent studies of body image and perception [1112], the evaluation of pain in people with obesity could be improved if the body map more closely resembles the body of a person with obesity [1113].
The Nordic Musculoskeletal Questionnaire (NMQ) is a reliable tool to assess pain with good internal consistency and validity [1415]. Moreover, NMQ is widely used by researchers because it is easy to apply and patients can understand it readily [110141516171819]. This instrument has been used in different populations, such as adolescents [20], adults, and older adults [21,222324]. The body map used in the NMQ is divided into nine anatomical regions that represent a lean body silhouette. Therefore, the aim this study was to adapt and validate body maps for the evaluation of musculoskeletal pain location in people with obesity.
Go to : 
MATERIALS AND METHODS
This study was approved by the Research Ethics Committee of the Clinical Hospital at the Federal University of Goiás (CEP - HC/UFG 1.641.281) and conducted in accordance with the Declaration of Helsinki [25]. All procedures were performed after obtaining written informed consent from all participants.
1. Study design
This study involved the adaptation and validation of two body maps (for men and women) specifically designed to assist in the location of pain in people with obesity using the NMQ.
2. Population
Eighty patients from the Alberto Rassi Hospital - HGG, Goiânia (Goiás, Brazil), were invited to participate in the study between August 2016 and January 2017. We included men and women between 18 and 65 years of age with a body mass index (BMI) of ≥ 30 kg/m2. The following people were excluded from the study: those with visual limitations that made it difficult to see body maps, previous bariatric surgery, as well as those who were pregnant or lactating.
3. Variables
Data on the following characteristics were collected: sex, age, ethnicity, marital status, education level, family income, number of residents per household, and musculoskeletal pain. Data regarding weight and height were collected at the time of assessment using a scale with a capacity of 300 kg. Height was measured in meters using a stadiometer. Patients were instructed to wear light clothing and keep their bodies erect with their feet together and without shoes. BMI was calculated by dividing weight (kg) by height (m2) [26].
4. Instrument
The NMQ was developed from a project funded by the Nordic Council of Ministers for the screening of musculoskeletal pain [141527]. The original NMQ utilizes body maps in conjunction with questions. The questions include 27 items exploring the presence of musculoskeletal symptoms during the last 12-month and the last 7 days which prevented normal activity.
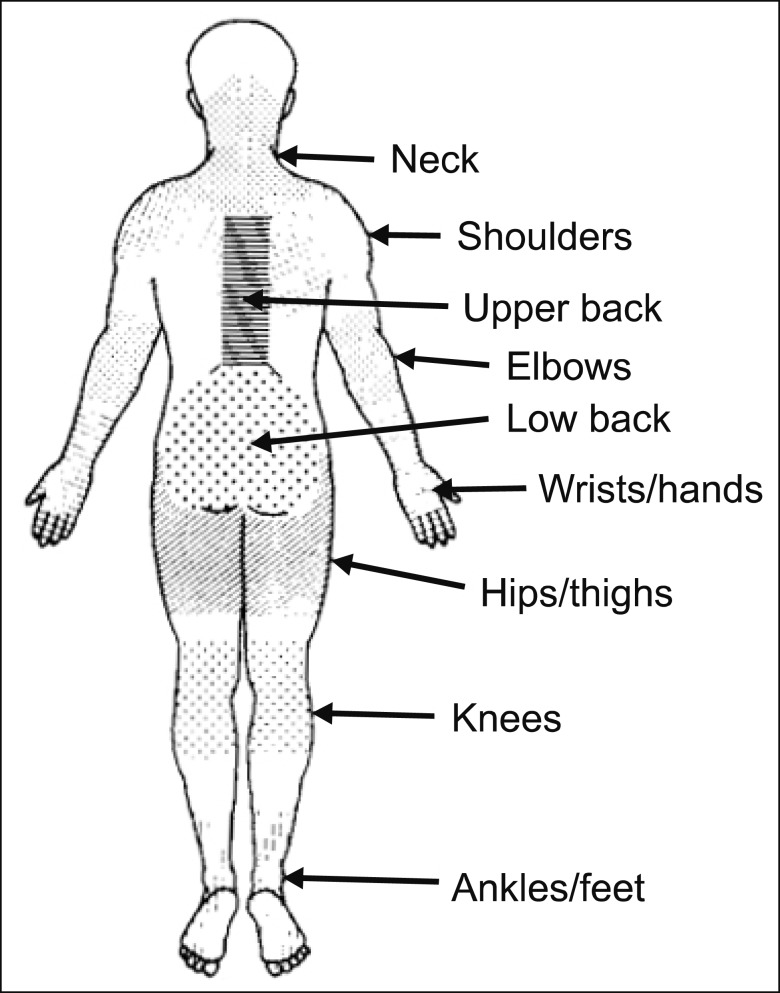
The original body map shows nine anatomical regions (frontal view of the frontal plane): neck, shoulders, upper back, elbows, lower back, wrists/hands, hips/thighs, knees, and ankles/feet [101415]. We retained this nine-region system in the modified body maps for men and women with obesity and the same questions as the original instrument.
5. Procedures
This study was conducted in eight steps: 1) initial contact; 2) development of obese female and male body maps; 3) pilot study; 4) discussion of the results from the pilot study; 5) validity; 6) approval of the final versions of the body maps; 7) reproducibility; and 8) statistical analyzes.
1) Step 1
Initial contact was made with the owners of the copyrights of the NMQ and the authors who performed the cultural adaptation and validation of the instrument for use in Brazil. They reported no objections to the adaptation of the images in the present study.
2) Step 2
The original body maps of the NMQ questionnaire were modified based on the body composition patterns of people with obesity. The dimensions of the arm, waist, hip width, thigh, and leg were adjusted using Adobe Photoshop and Adobe Illustrator. We took into account fat distribution patterns and body shapes of people with severe obesity. Women generally have a higher percentage of their body fat distributed around the hips and thighs, while men tend to have their body fat concentrated in the abdominal region. For this reason, it is important to develop two separate body maps to improve the accuracy of the system for the identification of pain in men and women [28]. We highlight the nine anatomical regions using different colors in order to improve the delimitation of each area investigated. We did not use red, as it is a highly stimulating color and could call attention to specific anatomical points or suggest the idea of pain [29]. However, other colors were chosen randomly and without a specific meaning.
3) Step 3
We performed a pilot study in 10 men and 12 women with obesity (BMI > 35 kg/m2) who were being treated at the Clinical Hospital of the Federal University of Goiás. The mean age was 37 years for the women and 42 years for the men. The new body maps with feminine and masculine silhouette were applied, and participants were interviewed using the Nordic questionnaire adapted to the Brazilian language. In addition to the NMQ questions, the participants were asked whether the new images met the goal of assessing pain and if the colored images help to better delineate the areas investigated and adequately replace the images of the original instrument. We also asked how the image could be improved.
4) Step 4
The results of the pilot study were discussed among the researchers of the Group of Studies on Severe Obesity. Participants reported that color images aided in the identification of body areas and that they adequately replace the images of the original instrument. After discussions, the final versions of the body maps were approved.
5) Step 5
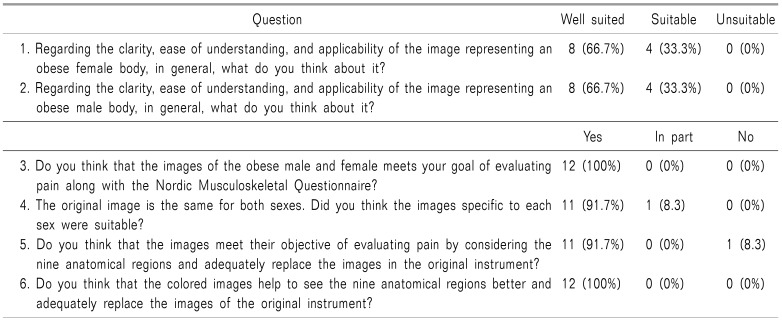
The validity of the maps was tested and analyzed by 12 professional pain specialists. After the invitation of the pain experts to evaluate the body maps development, a cover letter with instructions and a content review questionnaire with content validity information was provided. These specialists included orthopedists, physiotherapists, and nurses working at the General Hospital of Goiânia and Hospital das Clínicas in the state of Goiás. These professionals have experience in treating people with obesity and pain. The specialists answered six questions regarding the clarity and applicability of the body maps in both men and women. This step was performed according to the recommendations of Grant and Davis [3031]. These recommendations aim to content specialists to review the material to verify if it is valid and applicable or if it is not representative of the content. The content specialists are also required to judge the clarity and to suggest the inclusion or exclusion of building items. The content evaluation should be performed by 2 to 20 experts [30]. The results of the validity test are shown in Table 1.
6) Step 6
After the validity test and approval of the final versions by the Group of Studies on Severe Obesity, the reproducibility test was performed. Fifty-eight patients participated in a test of the reproducibility of the adapted body maps (Fig. 1).
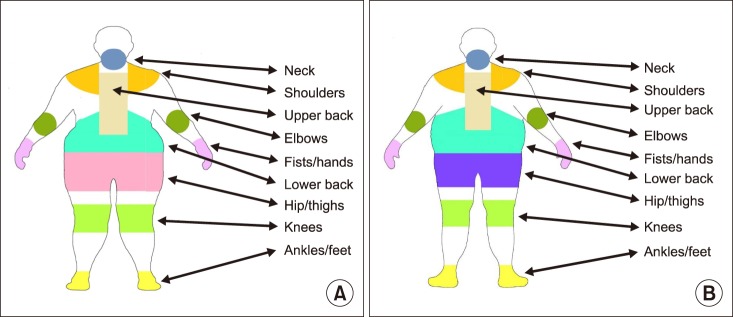
Fig. 2 represents the original Nordic Questionnaire image to identify the differences with the adapted versions.
7) Step 7
The reproducibility of the created body maps was tested in comparison with the original NMQ images (Fig. 2), and 58 patients were interviewed using the Brazilian version of the questionnaire (Table 2 and 3) [1415]. The sample size is, according Terwee et al., 2007 [31]. We performed the tests with a 1-hour interval between the two applications [32]: original image and adapted image. The order of application was randomized, and in 50% of the participants, the original image was applied first, followed by the adapted image, but the order was reversed in the other 50%. The time of completion of the questionnaire was evaluated by the researcher using a stopwatch. Data collection was standardized and performed by a trained physiotherapist.
8) Step 8
The database was built using the EPIDATA version 3.1 program. Statistical analyzes were performed using SPSS version 20.0 (SPSS Inc, Chicago, IL). The content validity of the body map was tested with percentage values. The reproducibility of the body maps were tested by sensitivity, specificity, agreement, and Cohen's kappa coefficient (κ) [33]. Sensitivity, specificity, and agreement data were represented by percentage. The P value and agreement measured by Kappa test were interpreted according to Landis and Koch's [34] criteria: slight agreement (κ 0.01–0.20), fair agreement (κ 0.21–0.40), moderate agreement (κ 0.41–0.60), substantial agreement (κ 0.61–0.80), and almost perfect agreement (κ 0.81–0.99).
Go to :
RESULTS
In the reproducibility step, the study sample consisted of 58 patients, and 82.8% were women. The mean age of the women was 45.02 ± 10.7 years, and the mean BMI was 48.9 ± 9.8 kg/m2. The mean age of the men was 42 ± 11.15 years, and the mean BMI was 60.1 ± 7.4 kg/m2. In terms of skin color, 16 (27.6%) reported having white, 30 (51.7%) brown, and 12 (20.7%) black skin.
Overall, 25.8% were single, and 63.8% were married. In terms of educational level, 45 (77.6%) had elementary-level education, 5 (8.6%) high-school level education, and 8 (13.8%) a higher-education level.
The mean time required for interview completion was approximately 15 m for the first questionnaire and 10 m for the second questionnaire.
1. Content validity
The specialists who performed the validation protocol observed that the body maps facilitated the evaluation of musculoskeletal pain. The body maps allowed the location of pain to be precisely indicated by the patients.
Regarding the clarity and applicability of the images (questions 1 and 2), 8 (66.7%) of the experts stated that the images were “very suitable” and all experts (100%) stated that they were at least “suitable.” Regarding questions 3 and 6, 12 (100%) of the experts considered that the images met their goal of allowing pain to be assessed using the NMQ and that the color images help to better visualize the nine anatomical regions. Regarding questions 4 and 5, 11 (91.7%) of the specialists considered the specific images for each sex adequate. These newly adapted images are appropriate replacements for the original images used in the NMQ with applicability in people with obesity (Table 1).
2. Reproducibility
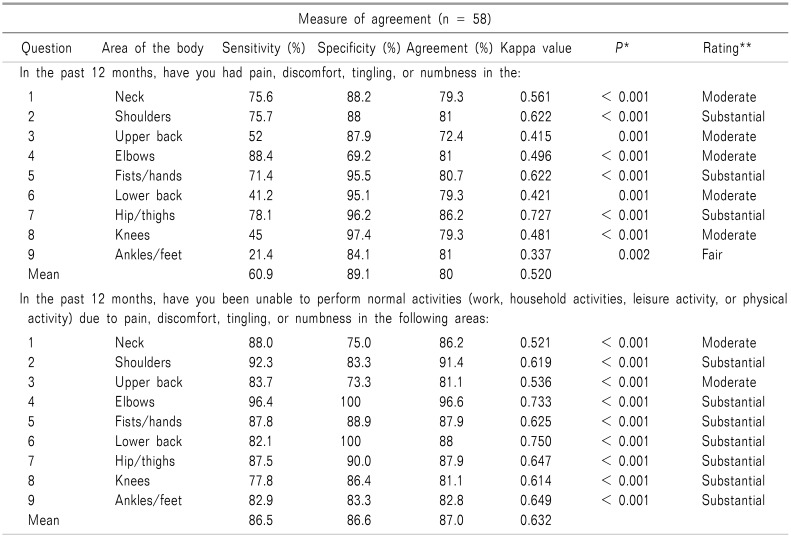
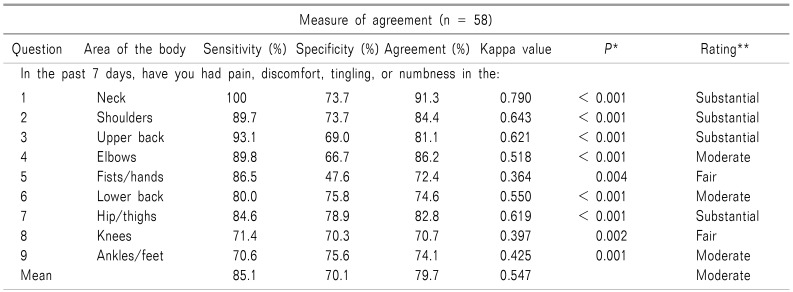
The reproducibility of the original and adapted body maps in the identification of different pain sites is shown in Tables 2 and 3. The reproducibility of both versions indicated good agreement, with a mean of 80% for all body areas in pain in the last 12 months (Table 2) and a mean of 79.7% for pain in the last 7 days (Table 3).
Considering the pain issues in the last 12 months, Cohen's kappa demonstrated that only the ankle/foot region provided fair agreement, whereas the other anatomical sites had “moderate” or “substantial” agreement. Considering lack of participation in routine activities in the last year, Cohen's kappa value for different pain sites demonstrated “moderate” and “substantial” agreement (Table 2).
Regarding pain issues in the last 7 days, Cohen's kappa demonstrated that both wrists/hands and knees had “fair” agreement, whereas the other anatomical regions presented “moderate” and “substantial” agreement (Table 3).
3. Sensitivity and specificity
Analyses of pain in the last 12 months indicated good or high sensitivity and specificity for most body areas. However, low sensitivity (< 50%) was obtained for the lower back, knees, and ankles/feet, whereas the specificity of these areas was > 84%.
Considering the participation in activities of daily living in the last 12 months, there was good or high sensitivity for all body areas (Table 2). Considering pain in the last 7 days, there was high sensitivity and specificity for all body areas, except for the wrist/hands, with specificity of < 50% (Table 3).
Go to :
DISCUSSION
This is the first study to present body maps for the location assessment of musculoskeletal pain in people with obesity. The validity and reproducibility indicated that the body maps produced are adequate for the location assessment of musculoskeletal pain in individuals with obesity and are a reliable and valid measure of painful symptomatology in combination with the NMQ [10]. These results are interesting because valid measurement systems are needed to satisfy the growing interest in the study of pain in both the clinical and research settings [4], primarily in patients with obesity.
It is important to highlight that there were high sensitivity and specificity for all body parts, considering the pain experienced in the past seven days, except for wrist/hands specificity, for which the result was lower than 50. Therefore, the results for wrist/hands must be carefully analyzed. However, this result does not invalidate our findings. Once there was no specific instrument for evaluating musculoskeletal pain in adults with obesity, so specific body maps of female and male bodies, evaluating nine anatomical regions, could be a relevant instrument for the identification of pain sites. Additionally, our instrument could be used along with other instruments of musculoskeletal pain to complement the patient's assessment.
Pain is a bodily experience [35], and the ability to locate or perceive the precise location of pain necessitates good mental and cortical perception of the body [35]. When a person's body image is distorted, the brain tends to rely on visual information rather than proprioceptive or tactile cues [13]. For this reason, we believe that these modified body maps, which take into account the different fat distribution patterns of men and women with obesity, provide a more realistic and accurate means of verifying the site of pain in this population.
In this study, significant effort was put into developing and validating the modified body maps. The main challenge was to ensure that the measurement system remained applicable in clinical practice. Body maps can be useful to health professionals and researchers performing epidemiological studies. In order to further assist both these endeavors, we have developed body maps specific for men and women on the basis that they have different fat distribution patterns. Another improvement was the use of different colors to highlight the nine main regions that may present painful symptoms.
We believe that these improvements will lead to more accurate assessment of pain in patients suffering from obesity. During the validation stage, one of the specialists suggested that the body maps should separate the ankle and foot regions and emphasize the regions of the anterior thorax and abdomen. However, we decided to maintain the features included in the original NMQ body map because these adjustments would change the original configurations of the questions on the questionnaire.
The present study had some limitations. First, the interval between data collection is critical in verifying the reproducibility of such assessment system. The interval must be sufficiently long so that the patient has no memory of the first measurement as this could influence the responses in the second session. Meanwhile, the interval should also be short enough that the underlying characteristic under investigation does not vary between the sessions [32]. Furthermore, a longer interval can reduce patient participation in the study. In addition, the patient's pain symptomatology could change during a 24-hour period or over a period of 7 days [36]. Thus, we opted for a measurement interval of 1 hour [37]. Another limitation was that fewer men than women participated in the study. However, this reflects the clinical situation in the studied population; women tend to seek treatment much more often than men [38].
We recommend that future studies should aim to enroll larger numbers of men. Furthermore, it may be interesting to develop body maps which include demarcated areas on the anterior region of the body.
In conclusion, the body maps developed in this study are reliable and valid to identify the location of pain in men and women with obesity. We believe that these adapted body maps will be useful in clinical practice for the identification of pain in people with obesity.
Go to :
 XML Download