Journal List > Korean J Gastroenterol > v.79(1) > 1159576

Nutritional Impact of Percutaneous Endoscopic Gastrostomy: A Retrospective Single-center Study

Abstract

Background/Aims

Several conditions may cause difficulties with oral feeding. Percutaneous endoscopic gastrostomy (PEG) is commonly performed on patients who require enteral feeding for >2-3 weeks. This study examined the nutritional state of patients who required enteral feeding and underwent PEG to quantify the benefits of the procedure.

Methods

This retrospective study included patients who underwent PEG at the Chungnam National University Hospital between January 2013 and December 2018. A gastroenterologist performed all PEG procedures using the pull technique, and all patients were followed up for >3 weeks postoperatively. The BMI and lymphocyte count, along with the levels of hemoglobin, total protein, albumin, total cholesterol, BUN, and creatinine pre-PEG and between 3 weeks and 6 months post-PEG were evaluated.

Results

Overall, 151 patients (116 males; mean age 64.92 years) were evaluated. Of these patients, 112 (74.2%), 34 (22.5%), and five (3.3%) underwent PEG tube insertion because of neurological diseases, malignancy, and other conditions, respectively. The BMI and the hemoglobin, total protein, albumin, and total cholesterol levels were significantly higher post-PEG than pre-PEG.

Conclusions

These findings highlight the usefulness of PEG in the management of nutritionally poor patients with difficulties in feeding orally.

INTRODUCTION

Difficulties with oral feeding can have various causes, and patients who experience difficulties feeding orally often require enteral feeding or parenteral nutrition. Furthermore, studies have reported that enteral feeding has many advantages over intravenous nutrition, such as reduced cost, preserved enteral function, and suppression of bacterial translocation.1 Although feeding through an L-tube is easy, it can lead to complications, including esophageal injury and a relatively high aspiration rate if used for long durations.2-4 Enteral nutrition using a percutaneous endoscopic gastrostomy (PEG) tube is a safe and well-tolerated method of artificial nutrition.5 Therefore, PEG should be considered for patients who require enteral feeding for >3-4 weeks.6
Gauderer et al.7 first performed PEG on 12 children and 19 adults in 1979 using a regular 16 French de Pezzer (mushroom) catheter. In 1988, Deitel et al.8 published a paper that described two methods of PEG, i.e., the pull method and introducer method, which is currently used in many hospitals. Multiple efforts have been made to improve the efficiency of the PEG procedure and reduce the complication rates since the first PEG surgery was performed 40 years ago. In 2001, a review paper discussing the 20th anniversary of PEG identified 836 PEG-related articles.9 According to that paper, by the year 2000, more than 216,000 PEG procedures were being performed annually in the United States, and the use of the de Pezzer (mushroom) catheter was no longer necessary because 12 major manufacturers have produced PEG or PEG-related enteral access devices. Nunes et al.10 reported that albumin and transferrin levels improved after PEG tube insertion in dementia patients. The results from a randomized 28-day trial showed that the amount of weight gained by the patients who underwent PEG was significantly higher than that gained by patients who underwent nasogastric intubation.11 Although few recent studies have evaluated the nutritional benefits of PEG, Silander et al.12 emphasized the importance of early PEG tube insertion in patients with head and neck cancers because it can prevent nutritional deficiency and increase the patient’s quality of life.
The demand for PEG tube insertion is increasing in many medical institutions, including the Chungnam National University Hospital. On the other hand, studies confirming the hematological and anthropometric improvement in a real clinical practice before and after PEG tube insertion are limited. Therefore, this study analyzed retrospectively the nutritional state of patients who underwent PEG for the first time and to quantify the benefits of PEG tube insertion in patients who require enteral feeding.

SUBJECTS AND METHODS

1. Study design and subjects

Two hundred and forty-five patients underwent PEG tube insertion at the Chungnam National University Hospital between January 2013 and December 2018. The medical records of all patients were reviewed retrospectively. The following demographic data were assessed: age, sex, height, weight, baseline disease that led to the need for PEG, history of smoking and alcohol consumption, medication history, hemodialyzer and ventilator usage, and baseline laboratory values. Eighteen patients were excluded because they had previously undergone PEG tube insertion. An additional 76 patients were excluded because they were lost to follow-up between three weeks and 6 months after PEG tube insertion (Fig. 1). Thus, 151 patients were finally enrolled in the study. The changes in nutritional markers before and after PEG tube insertion and the complications associated with the procedure were investigated. Not all the data was available for all items assessed, so few biomarkers and BMI had more patients excluded.
This was a retrospective study that used the medical records of patients. The Institutional Review Board (IRB) at the Chungnam National University Hospital approved the study (IRB No. 2020-01-024). The investigations were conducted in accordance with the principles of the Declaration of Helsinki. Measures to protect the personal information of the patients were established appropriately, and the need to obtain informed consent was waived.

2. PEG procedure

All patients in this study underwent the pull technique; a gastroenterologist performed all procedures. The PEG tube used was the PEG 24® Pull Method (Cook Medical., Bloomington, IN, USA), and the Olympus CV-260 with GIF-Q260 and CV-290 with GIF-H290 (Olympus Medical Systems Corp., Tokyo, Japan) were used for the endoscopy. Weight-adjusted midazolam and propofol were administered when sedation was required depending on the patient’s condition. If the patients were receiving antiplatelet medications, these drugs were discontinued for 2-5 days depending on the type of medication. The medication was restarted 1-2 days after the procedure. The patients were routinely administered cefazolin (2 g) 30 min before PEG tube insertion. Cefazolin was not administered if patients were already receiving an antibiotic with appropriate gram-positive coverage.
Careful dressing of the abdomen was performed before endoscope insertion. The gastroenterologist then inserted the endoscope to observe the anterior wall of the gastric body. Externally, the abdomen was palpated, and protrusions of the anterior wall were evaluated. After administering local anesthesia, a skin incision was made. The abdomen was punctured with a needle, and a guidewire was inserted through the puncture site. The guidewire was manipulated through the esophagus and brought out of the oral cavity using forceps. Subsequently, the PEG tube was connected to the guidewire, reinserted through the oral cavity, and pulled out via the puncture site (Fig. 2). The procedure was completed after the adequate position of the PEG tube was ensured, and the insertion site was carefully dressed. The dressing was performed 3 times daily for the first 7 days after the procedure, and water was administered through the PEG tube 24 hour after insertion. Initially, 100 mL of food was injected if there were no complications. If this was tolerated, an additional 50 mL of food was added to the previous volume. The regurgitation amount of food from the PEG tube was assessed, and injection of food was performed only if the volume of regurgitated gastric contents were <50 mL.

3. Nutritional follow-up

The changes in the following nutritional values were evaluated: changes in the lymphocyte count; hemoglobin, total protein, albumin, total cholesterol, BUN, and creatinine levels; body weight at 3 weeks (up to 6 months) postoperatively because an adequate amount of time is required for food to be injected steadily via the PEG tube.

4. Complications and mortality

The medical records of all patients were reviewed to identify the occurrence of complications, such as pneumoperitoneum, pancreatitis, peritonitis, pneumonia, infection, and surgical site infections, within 2 days after PEG tube insertion. Mortality within 6 months after PEG tube insertion and the causes of death were also reviewed.

5. Statistical analysis

Statistical analyses were performed using IBM SPSS statistics version 22.0 (IBM Co., Armonk, NY, USA) and Microsoft Office Excel Professional 2013 (Microsoft Co., Redmond, WA, USA). The continuous variables, including age and laboratory values, are presented as the mean±SD. The categorical variables, including complications and death, are described as the number and percentage of patients. A paired t-test was used to compare the pre- and post-PEG laboratory values. A p-value of <0.05 was considered significant. A Bland-Altman plot was also constructed.

RESULTS

1. Baseline characteristics

1) Duration of admission

The minimum and maximum pre-PEG admission durations were one and 232 days, respectively (37.29±43.82 days). The minimum and maximum admission durations post-PEG were one and 358 days, respectively (44.27±58.38 days). Finally, the minimum and maximum total admission durations were 3 and 469 days, respectively (81.56±81.98 days).

2) Patient demographic and clinical characteristics

The patient demographic data, including the age, sex, height, weight, and baseline disease that led to the need for PEG, history of smoking and alcohol consumption, medication history, and hemodialyzer and ventilator usage, are listed in Table 1. Of the 151 patients enrolled in this study, 116 patients (76.8%) were male, and the mean age of the patients was 64.92±12.67 years. Seventy-seven patients were >65 years old. One hundred and twelve (74.2%), 34 (22.5%), and five (3.3%) of the patients underwent PEG tube insertion because of neurological diseases, malignancy, and other conditions (e.g., recurrent pneumonia), respectively. Among those patients with neurological diseases, 34 patients (22.5%) had a brain hemorrhage, 28 (18.5%) had a stroke, 21 (13.9%) had amyotrophic lateral sclerosis (ALS), nine (6.0%) had Parkinson’s disease, seven (4.6%) had hypoxic brain damage, and 13 patients (8.6%) had other neurological diseases. At the time of admission, 126 (83.4%) patients did not consume alcohol, 13 (8.6%) currently consumed alcoholic beverages, five (3.3%) had previously consumed alcohol, and the drinking status of seven patients (4.7%) was unknown. Furthermore, 112 patients (74.2%) were non-smokers, 15 (9.9%) were current smokers, 16 (10.6%) were past smokers, and the smoking status of eight patients (5.3%) was unknown. In particular, 47 patients (31.7%) received antiplatelet and anticoagulation therapy. Twenty-eight patients (18.6%) were prescribed protein pump inhibitors, and 10 (6.6%) received steroid medications. Five patients (3.3%) used a hemodialyzer, and seven patients (4.6%) utilized a ventilator.
Table 2 lists the initial laboratory values and BMI. The initial mean and SDs of hemoglobin level, lymphocyte count, total protein level, albumin level, total cholesterol level, BUN, creatinine level, and BMI were 11.46±1.79 g/dL, 1.42±0.72×10³/μL, 6.31±0.75 g/dL, 3.14±0.53 g/dL, 144.34±39.84 mg/dL, 16.94±10.95 mg/dL, 0.70±0.68 mg/dL, and 19.08±3.36 kg/m2, respectively.

2. Nutritional benefits of PEG tube insertion, as assessed via comparisons of laboratory and BMI values

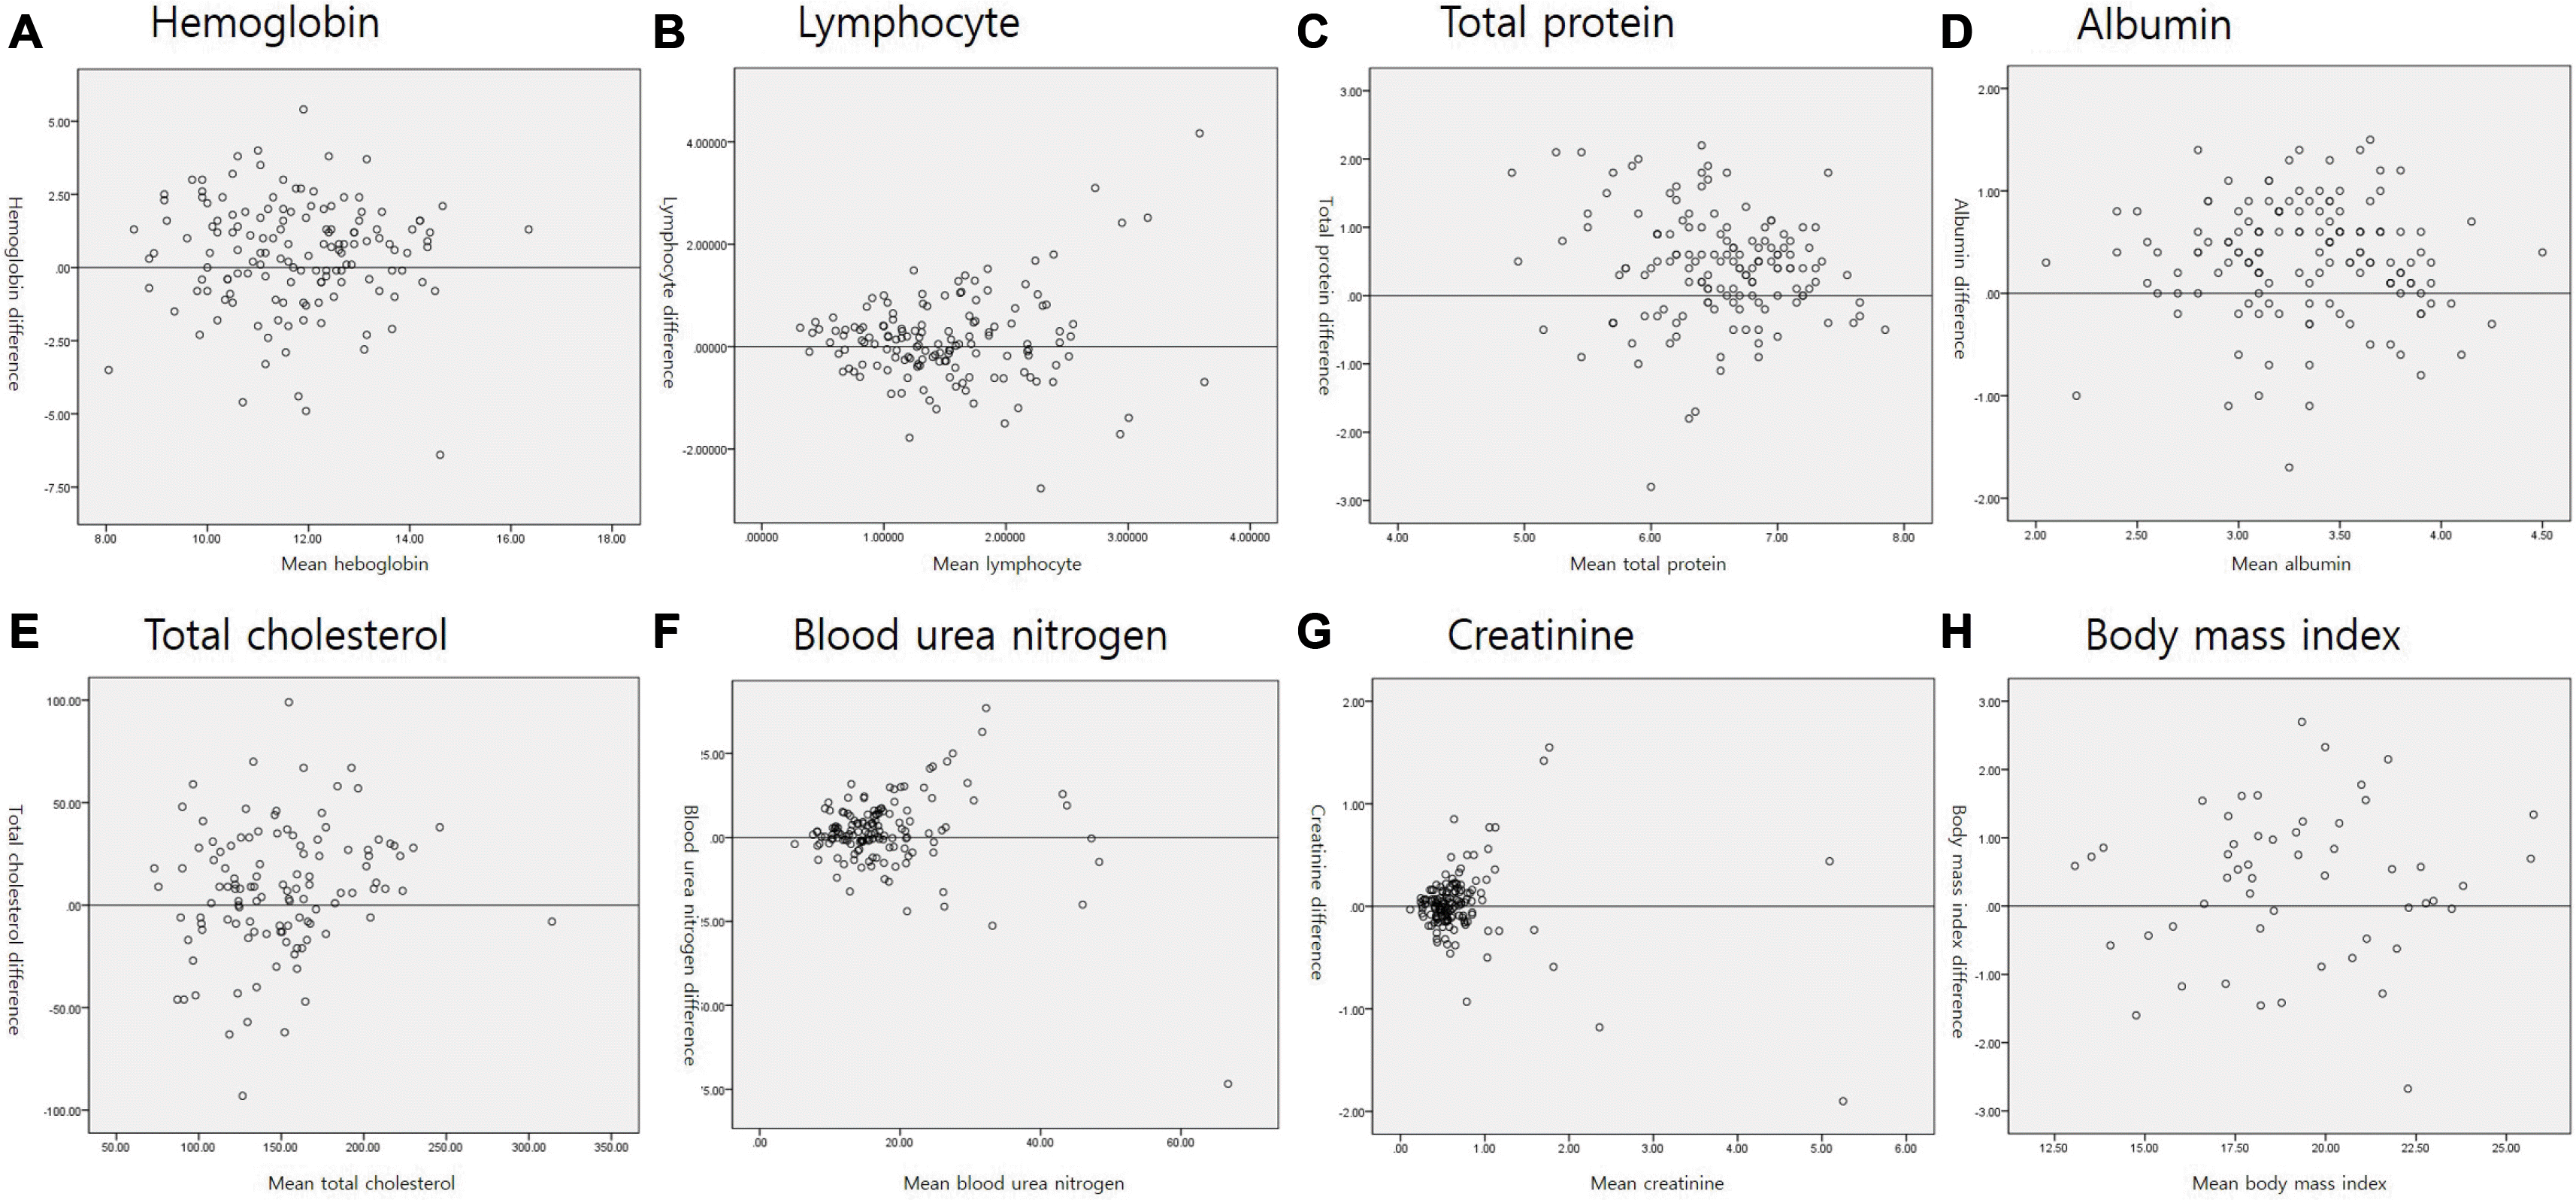
The pre- and post-PEG (between 3 weeks and 6 months postoperatively) laboratory values are summarized in Table 3. The values of all laboratory parameters and BMI increased from the pre- to post-PEG. On the other hand, only the mean hemoglobin level (p=0.005), total protein level (p<0.001), albumin level (p<0.001), total cholesterol level (p=0.009), and BMI (p=0.023) demonstrated statistically significant increases after PEG than before PEG. Fig. 3 shows the Bland-Altman plots of laboratory results and BMI.
Table 4 lists the changes in parameters according to the underlying disease (neurologic disease vs. malignant disease), and Table 5 presents the changes according to L-tube use before PEG insertion. All four groups showed an increase in the mean hemoglobin, total protein, albumin, and total cholesterol levels, as well as the BMI. As shown in Table 4, only the neurological disorder group showed significant increases in the mean hemoglobin (p=0.009) and total cholesterol levels (p=0.029), while only the malignancy group showed a significant increase in the mean BMI (p=0.012). As shown in Table 5, only patients with a history of L-tube insertion before PEG showed significant increases in the mean hemoglobin (p=0.003) and total cholesterol levels (p=0.003, while only the non-L-tube group showed a significant increase in the mean BMI (p=0.02). All groups showed significant increases in the mean total protein and albumin levels.

3. Complications and mortality

Table 6 lists the complications that occurred within 2 days after PEG tube insertion. Ten out of the 151 patients (7.3%) who were enrolled experienced the following complications after PEG tube insertion: postoperative pneumoperitoneum (four patients), aspiration pneumonia (four patients), postoperative pancreatitis with peritonitis (one patient), surgical site infection (one patient), and respiratory arrest (one patient). One patient experienced both aspiration pneumonia and pneumoperitoneum. All patients recovered without surgical intervention.
Twenty patients (13.2%) died within 180 days after PEG tube insertion. The overall time of death ranged from two to 165 days after PEG tube insertion, and the mean survival time was 49.75±41.72 days. Six patients died within 30 days, resulting in a 30-day mortality rate of 4.0%. Among the six patients who died within 30 days after PEG tube insertion, three patients died from pneumonia, and two patients died because of multi-organ failure due to aggravation of the baseline disease; one patient with ALS died because of respiratory failure. On the other hand, none of these causes of death were related to PEG tube insertion.

DISCUSSION

PEG is usually indicated when a period of inadequate nutritional intake exceeding 2-4 weeks is expected, such as in patients with malignancies (mainly head and neck) or neurological (e.g., cerebrovascular stroke, brain hemorrhage, and ALS).13 A previous study conducted at the Johns Hopkins Children’s Center from 1994 to 2005 on 760 children and young adults showed that failure to thrive (373 patients), dysphagia (277 patients), and insufficient oral intake (88 patients) were the most common indications for PEG tube placement.14 Another study that included 109 Korean patients (mean age was 68.2 years) reported that cerebral infarction (37 patients, 33.9%), brain hemorrhage (32 patients, 29.4%), and hypoxic brain damage (nine patients, 3.7%) were the most common indications for PEG.4 In the present study, the first and second most common indications for PEG were brain hemorrhage (34 patients, 22.5%) and stroke (28 patients, 13.9%), followed by ALS (21 patients, 13.9%), Parkinson’s disease (nine patients, 6%), and hypoxic brain damage (seven patients 4.6%). The different indications in the present study relative to the others may be because the Chungnam National University Hospital has a medical rehabilitation center.
Thus far, various anthropometric and biochemical markers have been used as indicators to objectively and intuitively check nutritional status. One anthropometric marker, the BMI, is easily applied in clinical practice and used widely in epidemiologic studies.15 Moreover, the BMI is significantly associated with the nutritional status and the presence of sarcopenia.16,17 Clinically, a low BMI is associated with complications, such as disability, morbidity, hospitalization rate, and mortality. Biochemical markers, including hemoglobin, albumin, cholesterol, and platelet counts, tend to reflect the nutritional status and are important in predicting survival.18-20 Prealbumin and transferrin also reflect the nutritional status.21,22 Unfortunately, this study could not analyze these biomarkers because prealbumin and transferrin are not routinely checked in the Chungnam National University Hospital. Nevertheless, of the markers assessed, the BMI and the hemoglobin, total protein, albumin, and total cholesterol levels increased post-PEG significantly compared to the pre-PEG values.
Reductions in many of these markers have been linked to poor patient outcomes. For example, randomized controlled trials have shown that reduced hemoglobin levels are associated with poor quality of life.23,24 Low hemoglobin levels are related to poor treatment responses, which reduces the survival rate of patients with terminal illnesses.25,26 The maker serum albumin is tied to the BMI and is generally used to evaluate the nutritional status and functionality of visceral protein synthesis.27,28 Furthermore, a low serum albumin level is an independent risk factor for survival in chronic malnourished patients.15,29 A low serum cholesterol level, a marker of poor nutritional status and cachexia, is also associated with poor prognosis. Indeed, a low serum cholesterol level is related to higher mortality in patients with chronic cardiovascular disease (“cholesterol paradox”).30,31 In contrast, the total lymphocyte count may be considered a nutritional marker, but there is little evidence to show that it is related to the nutritional outcome.20,32 Consistent with this, this study did not identify any statistically significant improvement in lymphocyte counts after PEG than before PEG. Although more thorough assessments will be required in the future, the increases in the hemoglobin, total protein, albumin, and total cholesterol levels along with BMI that we observed herein suggest that PEG offers nutritional benefits to patients who require enteral feeding.
Overall, 10 patients experienced short-term complications related to PEG tube insertion in this study. On the other hand, none of these complications were fatal and the patients recovered without surgical intervention. Patients can tolerate up to 10 days of partial fasting while receiving maintenance fluids if their nutritional status is adequate before commencing partial fasting.33 On the other hand, enteral feeding is required to maintain an adequate nutritional status for longer periods.33
In the present study, 20 patients died within 180 days after PEG tube insertion, and six patients died within 30 days after PEG tube insertion. The causes of patient deaths within 30 days after PEG were pneumonia, baseline disease aggravation, and respiratory failure. None of these causes of death were related to PEG tube insertion, and these issues could not be predicted at the time of PEG. The 30-day mortality rate was 4.0%, which is consistent with the previously reported 30-day mortality rates of 3.3-23.9% after PEG.34
These findings and previous research suggest that PEG should be considered for patients who require enteral feeding for >3-4 weeks.6 PEG is not recommended for patients with a short life expectancy, and physicians should carefully examine the life expectancy of patients.
Several limitations of this study should be noted. First, this was a retrospective study conducted at a single center and may have biases and limited generalizability. Although the number of enrolled patients was small (151 patients), it was relatively high compared to other PEG nutrition-related single-center studies. Second, adjustment for confounding factors was difficult. Third, the L-tube and IV nutritional supply before PEG tube insertion was difficult to evaluate. Moreover, a comparison between PEG and L-tube feeding was not possible because L-tube feeding can be used only for brief periods (up to 4 weeks).35 Furthermore, if maintained for long durations, it can cause complications, such as esophageal injury, and is associated with a relatively high rate of aspiration.2,3 Fourth, the daily caloric intake after PEG tube insertion differed according to the patient, and the injected nutritional components were not investigated. Finally, the long-term follow-up of patients was limited because many patients were transported to other hospitals after PEG tube insertion. Multicenter, prospective studies on the nutritional changes in patients after PEG should be conducted for each underlying disease to overcome these limitations.
Nevertheless, changes in the hematologic and anthropometric indicators, such as BMI, were observed. Given that laboratory data and BMI can be easily calculated, such values may provide more definitive prognostic information for clinicians before and after the procedure. In conclusion, these findings reflect the nutritional benefits of PEG tube insertion, when performed appropriately, for patients who have difficulties feeding orally.

Notes

Financial support

None.

Conflict of interest

None.

REFERENCES

1. Deitch EA, Winterton J, Li M, Berg R. 1987; The gut as a portal of entry for bacteremia. Role of protein malnutrition. Ann Surg. 205:681–692. DOI: 10.1097/00000658-198706000-00010. PMID: 3592811. PMCID: PMC1493085.
crossref
2. Baeten C, Hoefnagels J. 1992; Feeding via nasogastric tube or percutaneous endoscopic gastrostomy. A comparison. Scand J Gastroenterol Suppl. 194:95–98. DOI: 10.3109/00365529209096035. PMID: 1298056.
crossref
3. Mekhail TM, Adelstein DJ, Rybicki LA, Larto MA, Saxton JP, Lavertu P. 2001; Enteral nutrition during the treatment of head and neck carcinoma: is a percutaneous endoscopic gastrostomy tube preferable to a nasogastric tube? Cancer. 91:1785–1790. DOI: 10.1002/1097-0142(20010501)91:9<1785::AID-CNCR1197>3.0.CO;2-1. PMID: 11335904.
crossref
4. Sim JS, Kim SY, Lee YJ, et al. 2017; Indication and clinical outcomes of percutaneous endoscopic gastrostomy: a single-center retrospective analysis. Korean J Helicobacter Up Gastrointest Res. 17:138–143. DOI: 10.7704/kjhugr.2017.17.3.138.
crossref
5. Masaki S, Kawamoto T. 2019; Comparison of long-term outcomes between enteral nutrition via gastrostomy and total parenteral nutrition in older persons with dysphagia: a propensity-matched cohort study. PLoS One. 14:e0217120. DOI: 10.1371/journal.pone.0217120. PMID: 31577813. PMCID: PMC6774498.
crossref
6. Meier R. 2009; Basics in clinical nutrition: endoscopic access (PEG and PEJ). E Spen Eur E J Clin Nutr Metab. 5:e216–e218. DOI: 10.1016/j.eclnm.2009.05.010.
crossref
7. Gauderer MW, Ponsky JL, Izant RJ Jr. 1980; Gastrostomy without laparotomy: a percutaneous endoscopic technique. J Pediatr Surg. 15:872–875. DOI: 10.1016/S0022-3468(80)80296-X. PMID: 6780678.
crossref
8. Deitel M, Bendago M, Spratt EH, Burul CJ, To TB. 1988; Percutaneous endoscopic gastrostomy by the "pull" and "introducer" methods. Can J Surg. 31:102–104. PMID: 3349370.
9. Gauderer MW. 2001; Percutaneous endoscopic gastrostomy-20 years later: a historical perspective. J Pediatr Surg. 36:217–219. DOI: 10.1053/jpsu.2001.20058. PMID: 11150469.
crossref
10. Nunes G, Santos CA, Santos C, Fonseca J. 2016; Percutaneous endoscopic gastrostomy for nutritional support in dementia patients. Aging Clin Exp Res. 28:983–989. DOI: 10.1007/s40520-015-0485-2. PMID: 26582081.
crossref
11. Park RH, Allison MC, Lang J, et al. 1992; Randomised comparison of percutaneous endoscopic gastrostomy and nasogastric tube feeding in patients with persisting neurological dysphagia. BMJ. 304:1406–1409. DOI: 10.1136/bmj.304.6839.1406. PMID: 1628013. PMCID: PMC1882203.
crossref
12. Silander E, Nyman J, Bove M, Johansson L, Larsson S, Hammerlid E. 2012; Impact of prophylactic percutaneous endoscopic gastrostomy on malnutrition and quality of life in patients with head and neck cancer: a randomized study. Head Neck. 34:1–9. DOI: 10.1002/hed.21700. PMID: 21374756.
crossref
13. Löser C, Aschl G, Hébuterne X, et al. 2005; ESPEN guidelines on artificial enteral nutrition--percutaneous endoscopic gastrostomy (PEG). Clin Nutr. 24:848–861. DOI: 10.1016/j.clnu.2005.06.013. PMID: 16261664.
14. Fortunato JE, Troy AL, Cuffari C, et al. 2010; Outcome after percutaneous endoscopic gastrostomy in children and young adults. J Pediatr Gastroenterol Nutr. 50:390–393. DOI: 10.1097/MPG.0b013e3181aed6f1. PMID: 20179645.
crossref
15. Rondanelli M, Talluri J, Peroni G, et al. 2018; Beyond body mass index. Is the Body Cell Mass Index (BCMI) a useful prognostic factor to describe nutritional, inflammation and muscle mass status in hospitalized elderly?: Body Cell Mass Index links in elderly. Clin Nutr. 37:934–939. DOI: 10.1016/j.clnu.2017.03.021. PMID: 28408051.
crossref
16. Trevisan C, Crippa A, Ek S, et al. 2019; Nutritional status, body mass index, and the risk of falls in community-dwelling older adults: a systematic review and meta-analysis. J Am Med Dir Assoc. 20:569–582.e7. DOI: 10.1016/j.jamda.2018.10.027. PMID: 30554987.
crossref
17. Perna S, Guido D, Grassi M, Rondanelli M. 2015; Association between muscle mass and adipo-metabolic profile: a cross-sectional study in older subjects. Clin Interv Aging. 10:499–504. DOI: 10.2147/CIA.S67872. PMID: 25759569. PMCID: PMC4345994.
18. Araújo JP, Friões F, Azevedo A, et al. 2008; Cholesterol--a marker of nutritional status in mild to moderate heart failure. Int J Cardiol. 129:65–68. DOI: 10.1016/j.ijcard.2007.05.026. PMID: 17643521.
crossref
19. Xu SS, Li S, Xu HX, et al. 2020; Haemoglobin, albumin, lymphocyte and platelet predicts postoperative survival in pancreatic cancer. World J Gastroenterol. 26:828–838. DOI: 10.3748/wjg.v26.i8.828. PMID: 32148380. PMCID: PMC7052532.
crossref
20. O'Daly BJ, Walsh JC, Quinlan JF, et al. 2010; Serum albumin and total lymphocyte count as predictors of outcome in hip fractures. Clin Nutr. 29:89–93. DOI: 10.1016/j.clnu.2009.07.007. PMID: 19674819.
21. Fletcher JP, Little JM, Guest PK. 1987; A comparison of serum transferrin and serum prealbumin as nutritional parameters. JPEN J Parenter Enteral Nutr. 11:144–147. DOI: 10.1177/0148607187011002144. PMID: 3108533.
crossref
22. Beck FK, Rosenthal TC. 2002; Prealbumin: a marker for nutritional evaluation. Am Fam Physician. 65:1575–1578. PMID: 11989633.
23. Sjoquist KM, Renfro LA, Simes RJ, et al. 2018; Personalizing survival predictions in advanced colorectal cancer: the ARCAD nomogram project. J Natl Cancer Inst. 110:638–648. DOI: 10.1093/jnci/djx253. PMID: 29267900. PMCID: PMC6005015.
crossref
24. de Almeida JP, Vincent JL, Galas FR, et al. 2015; Transfusion requirements in surgical oncology patients: a prospective, randomized controlled trial. Anesthesiology. 122:29–38. DOI: 10.1097/ALN.0000000000000511. PMID: 25401417.
25. hindi B, Hermanns T, Wei Y, et al. 2016; Identification of the best complete blood count-based predictors for bladder cancer outcomes in patients undergoing radical cystectomy. Br J Cancer. 114:207–212. DOI: 10.1038/bjc.2015.432. PMID: 26657651. PMCID: PMC4815810.
crossref
26. McGrane JM, Humes DJ, Acheson AG, Minear F, Wheeler JMD, Walter CJ. 2017; Significance of anemia in outcomes after neoadjuvant chemoradiotherapy for locally advanced rectal cancer. Clin Colorectal Cancer. 16:381–385. DOI: 10.1016/j.clcc.2017.03.016. PMID: 28456481.
crossref
27. Thongprayoon C, Cheungpasitporn W, Chewcharat A, Mao MA, Thirunavukkarasu S, Kashani KB. 2020; Risk of acute respiratory failure among hospitalized patients with various admission serum albumin levels: a cohort study. Medicine (Baltimore). 99:e19352. DOI: 10.1097/MD.0000000000019352. PMID: 32118775. PMCID: PMC7478795.
28. Sergi G, Coin A, Enzi G, et al. 2006; Role of visceral proteins in detecting malnutrition in the elderly. Eur J Clin Nutr. 60:203–209. DOI: 10.1038/sj.ejcn.1602289. PMID: 16234837.
crossref
29. Vlassopoulos A, Combet E, Lean ME. 2014; Changing distributions of body size and adiposity with age. Int J Obes (Lond). 38:857–864. DOI: 10.1038/ijo.2013.216. PMID: 24247373.
crossref
30. Budzyński J, Tojek K, Wustrau B, et al. 2018; The "cholesterol paradox" among inpatients - retrospective analysis of medical documentation. Arch Med Sci Atheroscler Dis. 3:e46–e57. DOI: 10.5114/amsad.2018.74736. PMID: 30775589. PMCID: PMC6374572.
crossref
31. Reddy VS, Bui QT, Jacobs JR, et al. 2015; Relationship between serum low-density lipoprotein cholesterol and in-hospital mortality following acute myocardial infarction (the lipid paradox). Am J Cardiol. 115:557–562. DOI: 10.1016/j.amjcard.2014.12.006. PMID: 25727079.
crossref
32. Kuzuya M, Kanda S, Koike T, Suzuki Y, Iguchi A. 2005; Lack of correlation between total lymphocyte count and nutritional status in the elderly. Clin Nutr. 24:427–432. DOI: 10.1016/j.clnu.2005.01.003. PMID: 15896430.
crossref
33. Rahnemai-Azar AA, Rahnemaiazar AA, Naghshizadian R, Kurtz A, Farkas DT. 2014; Percutaneous endoscopic gastrostomy: indications, technique, complications and management. World J Gastroenterol. 20:7739–7751. DOI: 10.3748/wjg.v20.i24.7739. PMID: 24976711. PMCID: PMC4069302.
crossref
34. Pih GY, Na HK, Ahn JY, et al. 2018; Risk factors for complications and mortality of percutaneous endoscopic gastrostomy insertion. BMC Gastroenterol. 18:101. DOI: 10.1186/s12876-018-0825-8. PMID: 29954339. PMCID: PMC6025834.
crossref
35. Kähler G, Götz M, Senninger N. 2016. Therapeutic endoscopy in the Gastrointestinal Tract. 1st ed. Springer;New York:
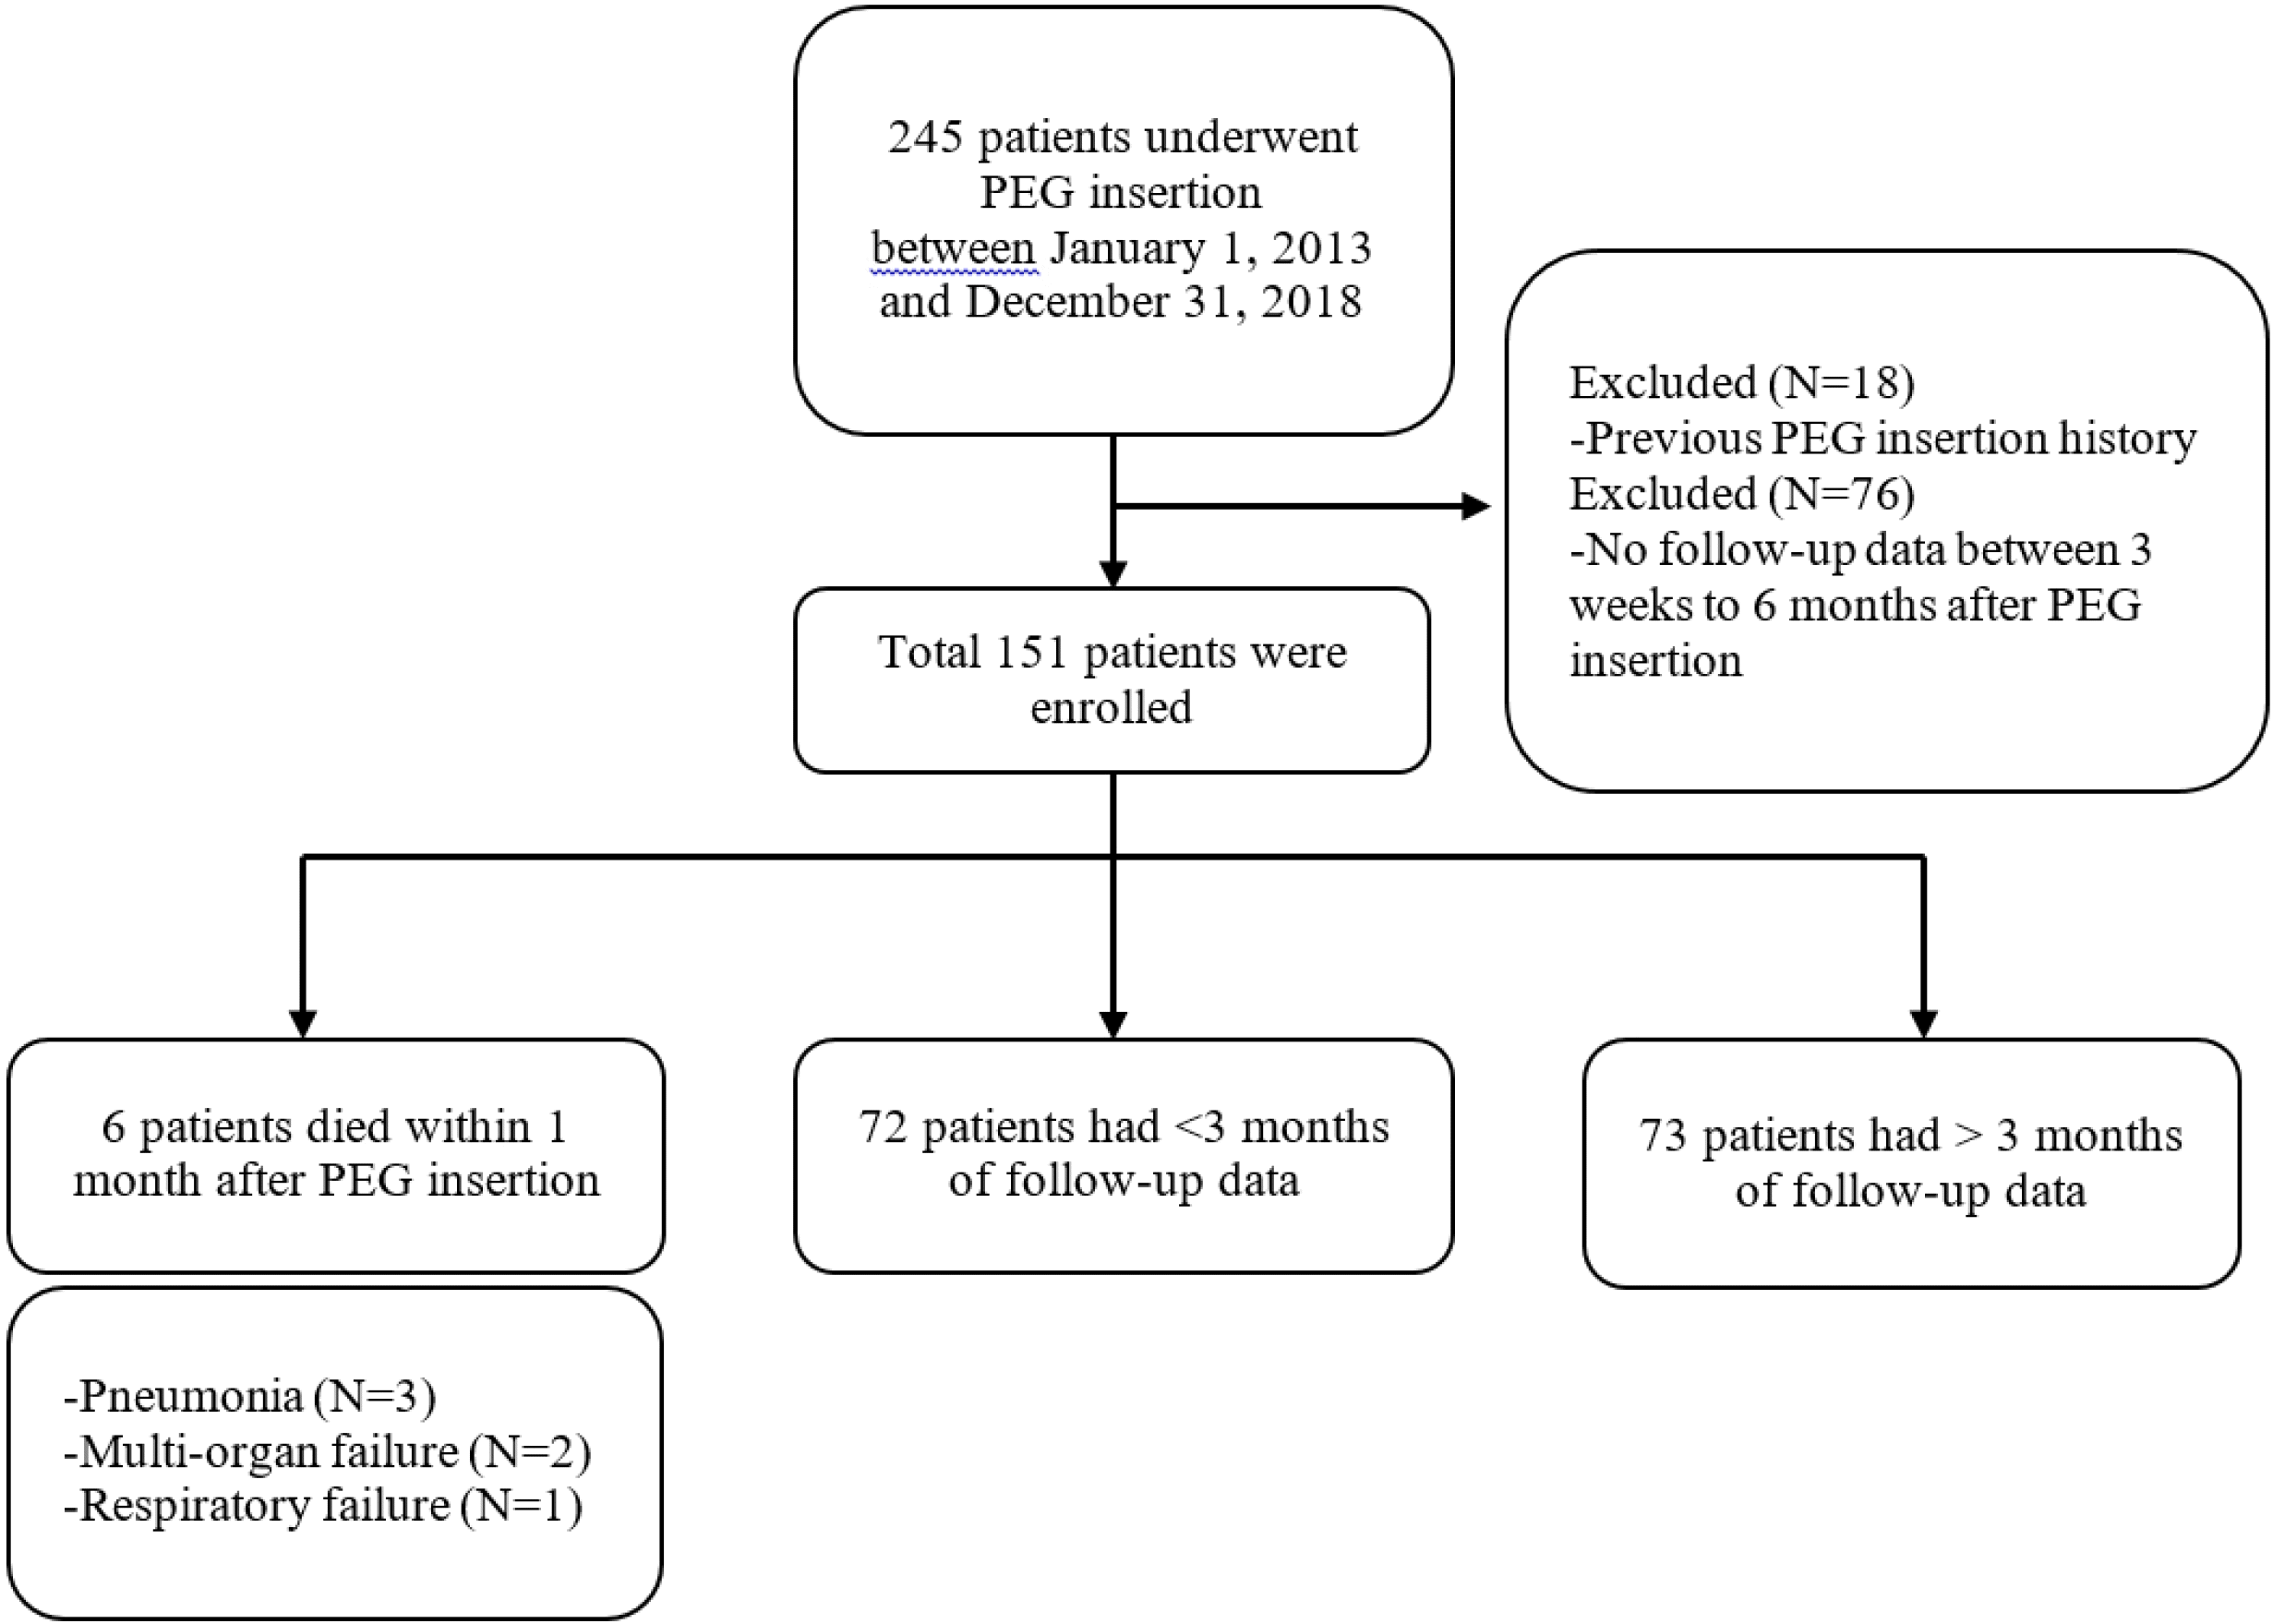
Fig. 1
Flow chart of patient enrollment. Between January 2013 and December 2018, 245 patients underwent percutaneous endoscopic gastrostomy (PEG). Eighteen patients were excluded because they had a previous history of PEG tube insertion, and 76 patients were excluded because they had no follow-up data between 3 weeks to 6 months after PEG tube insertion. One hundred fifty-one patients were enrolled as the final study group. PEG, percutaneous endoscopic gastrostomy.
kjg-79-1-12-f1.tif
Fig. 2
Percutaneous endoscopic gastrostomy (PEG) methods. (A) The transilluminated area on the abdominal wall was checked. (B) A protrusion on the abdominal wall was observed when the physician pressed the transilluminated area externally. (C) The abdomen was then punctured with a needle, and a guidewire was inserted through the puncture site. (D) The guidewire was then manipulated through the esophagus and brought out through the oral cavity using forceps. (E) Following this, adequate positioning of the PEG tube was observed by endoscopy. (F) Finally, an external bumper was fixed to the abdominal wall.
kjg-79-1-12-f2.tif
Fig. 3
Bland-Altman plots of laboratory test results and body mass index (BMI). (A) Hemoglobin level, (B) lymphocyte count, (C) total protein level, (D) albumin level, (E) total cholesterol level, (F) blood urea nitrogen level, (G) creatinine level, and (H) BMI. The levels of hemoglobin, total protein, albumin, and total cholesterol, as well as the BMI, were significantly higher post-percutaneous endoscopic gastrostomy (PEG) than pre-PEG.
kjg-79-1-12-f3.tif
Table 1
Baseline Characteristics of 151 Patients
Clinical characteristic Value (n=151)
Sex
Male 116 (76.8)
Female 35 (23.2)
Age
≤65 74 (49.0)
>65 77 (51.0)
Indications for PEG
Brain hemorrhage 34 (22.5)
Stroke 28 (18.5)
ALS 21 (13.9)
Parkinson disease 9 (6.0)
Hypoxic brain damage 7 (4.6)
Other neurologic disease 13 (8.6)
Malignancy 34 (22.5)
Othersa 5 (3.3)
Alcohol
None 126 (83.4)
Current 13 (8.6)
Past 5 (3.3)
Unknown 7 (4.7)
Smoking
None 112 (74.2)
Current 15 (9.9)
Past 16 (10.6)
Unknown 8 (5.3)
Concurrent medication
1 Antiplatelet and anticoagulant 32 (21.2)
2 Antiplatelet and anticoagulant 14 (9.3)
3 Antiplatelet and anticoagulant 1 (0.7)
Protein pump inhibitor 28 (18.5)
Steroid 10 (6.6)
Antilipidemic agent 111 (73.5)
Life support
None 139 (92.1)
Hemodialysis 5 (3.3)
Ventilator 7 (4.6)

Values are presented as number (%).

PEG, percutaneous endoscopic gastrostomy; ALS, amyotrophic lateral sclerosis.

aOthers include aspiration pneumonia and unknown dysphagia.

Table 2
Initial Lab Values
Laboratory value Total Minimum value Maximum value Average
Hemoglobin (g/dL) 151 7.9 17.8 11.46±1.79
Lymphocytes (×103/µL) 150 0.13 4 1.42±0.72
Total protein (g/dL) 151 4.0 8.1 6.31±0.75
Albumin (g/dL) 151 1.6 4.4 3.14±0.53
Total cholesterol (mg/dL) 130 62 318 144.34±39.84
BUN (mg/dL) 151 4.6 103.4 16.94±10.95
Creatinine (mg/dL) 151 0.13 6.20 0.70±0.68
BMI (kg/m2) 86 12.44 32.24 19.08±3.36

Values are presented as mean±standard deviation or number. The numbers are rounded up in the third decimal.

BUN, blood urea nitrogen; BMI, body mass index.

Table 3
Pre- and Post-PEG Changes in Laboratory Values
Laboratory value Total Intervala Pre-PEG Post-PEG p-value
Hemoglobin (g/dL) 144 99.58 11.52±1.78 11.96±1.74 0.005
Lymphocytes (×103/μL) 143 99.27 1.45±0.72 1.58±0.84 0.076
Total protein (g/dL) 145 99.15 6.31±0.74 6.72±0.65 <0.001
Albumin (g/dL) 145 99.15 3.16±0.52 3.50±0.50 <0.001
Total cholesterol (mg/dL) 114 99.26 145.57±40.13 153.21±45.68 0.009
BUN (mg/dL) 145 99.15 16.95±11.12 18.46±9.30 0.102
Creatinine (mg/dL) 145 99.15 0.68±0.67 0.70±0.61 0.508
BMI (kg/m2) 53 105.87 18.95±2.98 19.30±3.04 0.023

Values are presented as mean±standard deviation or number. The numbers are rounded up in the third decimal (Except, p-values are rounded off the fourth decimal place).

BUN, blood urea nitrogen; BMI, body mass index; PEG, percutaneous endoscopic gastrostomy.

aIntervals are presented as mean days between pre- and post-PEG laboratory dates.

Table 4
Pre- and Post-PEG Changes in Laboratory Values According to Underlying Disease
Baseline disease Total Pre-PEG Post-PEG p-value
Neurologic disorder
Hemoglobin (g/dL) 109 11.65±1.83 12.11±1.72 0.009
Lymphocytes (×103/µL) 108 1.56±0.73 1.70±0.75 0.088
Total protein (g/dL) 110 6.34±0.75 6.77±0.62 <0.001
Albumin (g/dL) 110 3.18±0.51 3.51±0.47 <0.001
Total cholesterol (mg/dL) 95 144.14±41.30 151.06±47.21 0.029
BUN (mg/dL) 110 17.79±12.07 18.94±9.86 0.301
Creatinine mg/dL 110 0.69±0.76 0.71±0.67 0.599
BMI (kg/m2) 27 18.87±3.54 18.97±3.56 0.621
Malignancy
Hemoglobin (g/dL) 32 11.03±1.61 11.51±1.65 0.153
Lymphocytes (×103/µL) 32 1.15±0.58 1.27±1.02 0.495
Total protein (g/dL) 32 6.22±0.68 6.63±0.67 0.003
Albumin (g/dL) 32 3.11±0.56 3.50±0.61 0.002
Total cholesterol (mg/dL) 17 155.41±33.61 167.53±36.16 0.108
BUN (mg/dL) 32 14.37±6.88 16.62±7.43 0.178
Creatinine (mg/dL) 32 0.67±0.21 0.66±0.40 0.952
BMI (kg/m2) 25 19.10±2.34 19.69±2.46 0.012

Values are presented as mean± standard deviation or number. The numbers are rounded up in the third decimal (Except, p-values are rounded off the fourth decimal place).

BUN, blood urea nitrogen; BMI, body mass index; PEG, percutaneous endoscopic gastrostomy.

Table 5
Pre- and Post-PEG Changes in Laboratory Values in Patients with and without L-tube Maintenance History
Baseline disease Total Pre-PEG Post-PEG p-value
L-tube
Hemoglobin (g/dL) 93 11.59±1.84 12.18±1.72 0.003
Lymphocytes (×103/µL) 92 1.55±0.74 1.64±0.76 0.296
Total protein (g/dL) 94 6.37±0.69 6.76±0.63 <0.001
Albumin (g/dL) 94 3.17±0.44 3.53±0.50 <0.001
Total cholesterol (mg/dL) 77 144.01±39.58 154.44±45.29 0.003
BUN (mg/dL) 94 16.48±8.62 19.07±9.90 0.007
Creatinine (mg/dL) 94 0.67±0.77 0.73±0.70 0.099
BMI (kg/m2)* 25 19.235±3.651 19.236±3.753 0.993
Without L-tube
Hemoglobin (g/dL) 51 11.38±1.67 11.56±1.70 0.502
Lymphocytes (×103/µL) 51 1.28±0.65 1.49±0.97 0.144
Total protein (g/dL) 51 6.21±0.82 6.65±0.68 0.001
Albumin (g/dL) 51 3.14±0.64 3.45±0.50 0.001
Total cholesterol (mg/dL) 37 148.81±41.59 150.65±47.00 0.731
BUN (mg/dL) 51 17.82±14.73 17.33±8.07 0.800
Creatinine (mg/dL) 51 0.70±0.44 0.65±0.41 0.331
BMI (kg/m2) 28 18.70±2.25 19.36±2.31 0.002

Values are presented as mean±standard deviation or number. The numbers are rounded up in the third decimal (Except, p-values are rounded off the fourth decimal place).

BUN, blood urea nitrogen; BMI, body mass index; PEG, percutaneous endoscopic gastrostomy.

*The numbers are rounded up in the fourth decimal place

Table 6
Acute Post-PEG Complications (within 2 Days)
Value (n=10)
Post pneumoperitoneum 3 (30.0)
Aspiration pneumonia 3 (30.0)
Post pneumoperitoneum & aspiration pneumonia 1 (10.0)
Post pancreatitis with peritonitis 1 (10.0)
Respiratory arrest 1 (10.0)
Surgical site infection 1 (10.0)

Values are presented as number (%).

PEG, percutaneous endoscopic gastrostomy.

TOOLS
Similar articles