

 PDF
PDF Citation
 Print
Print


INTRODUCTION
Esthetic improvement is one of the primary goals of orthodontic treatment. Esthetic aspects refer to the alignment of the teeth and the improvement of the facial soft tissue profile. Therefore, orthodontists prescribe force systems to move teeth, expecting that there will be corresponding soft tissue changes in response to the movement of the underlying hard tissue.1 For this reason, predicting these hard tissue-related overlying soft tissue changes is an essential consideration in treatment planning.
Retraction of the anterior teeth following premolar extraction causes changes in the anterior soft tissue profile. Previous studies have evaluated the relationship between retraction and soft tissue changes, with a particular interest in lip position.2,3 Caplan and Shivapuja4 reported that in adult patients with bimaxillary protrusions, the ratios of maxillary anterior teeth retraction to upper lip retraction and mandibular anterior teeth retraction to lower lip retraction were 1.75:1 and 1.2:1, respectively. Hayashida et al.1 reported that horizontal changes of the upper and lower lips were mostly correlated with the retraction of the upper incisor’s cervical point and the upper incisor’s tip, respectively. Other studies have found no definite correlation between changes in dentition and changes in soft tissue.5,6
Nevertheless, previous studies have focused on the tipping type of anterior tooth movement due to the known limitation regarding tooth movement against the alveolar wall. In contrast, the emergence of skeletal anchorage systems, such as miniscrews, made it possible to achieve significant anterior teeth retraction.7-9 Moreover, proper mechanics combined with miniscrews have enabled tooth movement close to bodily translations and even root movement of the incisors.10,11 However, to our knowledge, few studies have evaluated soft tissue changes according to the retraction of the incisor root apex.
This study aimed to compare the changes in hard and soft tissues after extraction of the four premolars followed by maximum retraction of the anterior teeth, depending on the type of anterior teeth movement, tipping, and translation. Our null hypothesis was that there would be no differences between the two groups regarding changes to the hard and soft tissues during treatment.
Go to : 
MATERIALS AND METHODS
Subjects
Patients presenting with lip protrusion who had undergone orthodontic treatment with extraction of four premolars followed by retraction of the anterior teeth at the Department of Orthodontics, Yonsei University Dental Hospital, Seoul, Korea, were retrospectively evaluated in this study.
The inclusion criteria were as follows: patients at cervical vertebrae maturation index (CVMI) stage 6 (cessation of growth), an initial lip protrusion with more than 0.5 standard deviations above the average value of lip position relative to Ricketts’ E-line,12 extraction of four premolars (one tooth per quadrant), > 5 mm retraction of the upper and lower incisor tips regardless of the horizontal skeletal pattern or amount of initial crowding, and the presence of pre- and post-treatment lateral cephalograms. The exclusion criteria were > 2° changes in the mandibular plane angle (Sn-GoMe) during treatment and severe craniofacial deformity.
The subjects that satisfied the inclusion and exclusion criteria were further divided into two subgroups: the tipping group with < 1 mm retraction of the upper and lower incisor root apex and more than 10° decrease in the upper and lower incisor axis (U1 to SN angle/incisor mandibular plane angle [IMPA]), and the translation group with > 3 mm retraction of the upper and lower incisor root apex and < 10° decrease in the upper and lower incisor axis. Group 1 (n = 27) contained six male and 21 female subjects, mean age of 24.89 ± 7.36 years at pre-treatment (minimum: 17 years, 8 months, maximum: 45 years, 4 months), and an average treatment time of 27.44 ± 5.46 months. Group 2 (n = 26) contained eight male and 18 female subjects, mean age of 23.92 ± 4.79 years at pre-treatment (minimum: 18 years, 3 months, maximum: 35 years, 1 month), and an average treatment time of 31.62 ± 9.33 months (Table 1).
All patients were treated with pre-adjusted 0.018-inch slot edgewise brackets in the Roth prescription (Tomy, Tokyo, Japan). After the initial leveling and alignment, miniscrews were placed between the maxillary and mandibular second premolars and first molars for anchorage reinforcement. Then, 0.016 × 0.022-inch stainless steel rectangular archwires were placed on both arches. In Group 2 (the translation group), an additional 10° labial crown torque on the incisor area was added to the archwires if needed. Approximately 150 cN of retraction force was provided by placing elastic chains (Ormco, Glendora, CA, USA), replaced at 4-week interval until the space was closed.
This study conformed to the tenets of the Declaration of Helsinki and was approved by the Institutional Review Board of Yonsei Dental Hospital (IRB number: 2-2018-0008).
Methods and landmarks
Lateral cephalograms were taken using a Cranex 3+ (Soredex, Helsinki, Finland) with a centric occlusion in the natural head position before (T1) and after (T2) treatment. Cephalometric tracing was digitized using the V-ceph program (Osstem Inc., Seoul, Korea). The horizontal reference plane (HRP) was set on the sella and oriented 7° below the sella-nasion line. The vertical reference plane (VRP) was set to the plane that passed the sella and was perpendicular to the HRP. The center of resistance of the upper and lower incisors was estimated to be one-third of the distance from the alveolar crest to the root apex in a lateral cephalogram. Cephalometric landmarks, reference planes, and measurements are shown in Table 2, Figures 1 and 2.
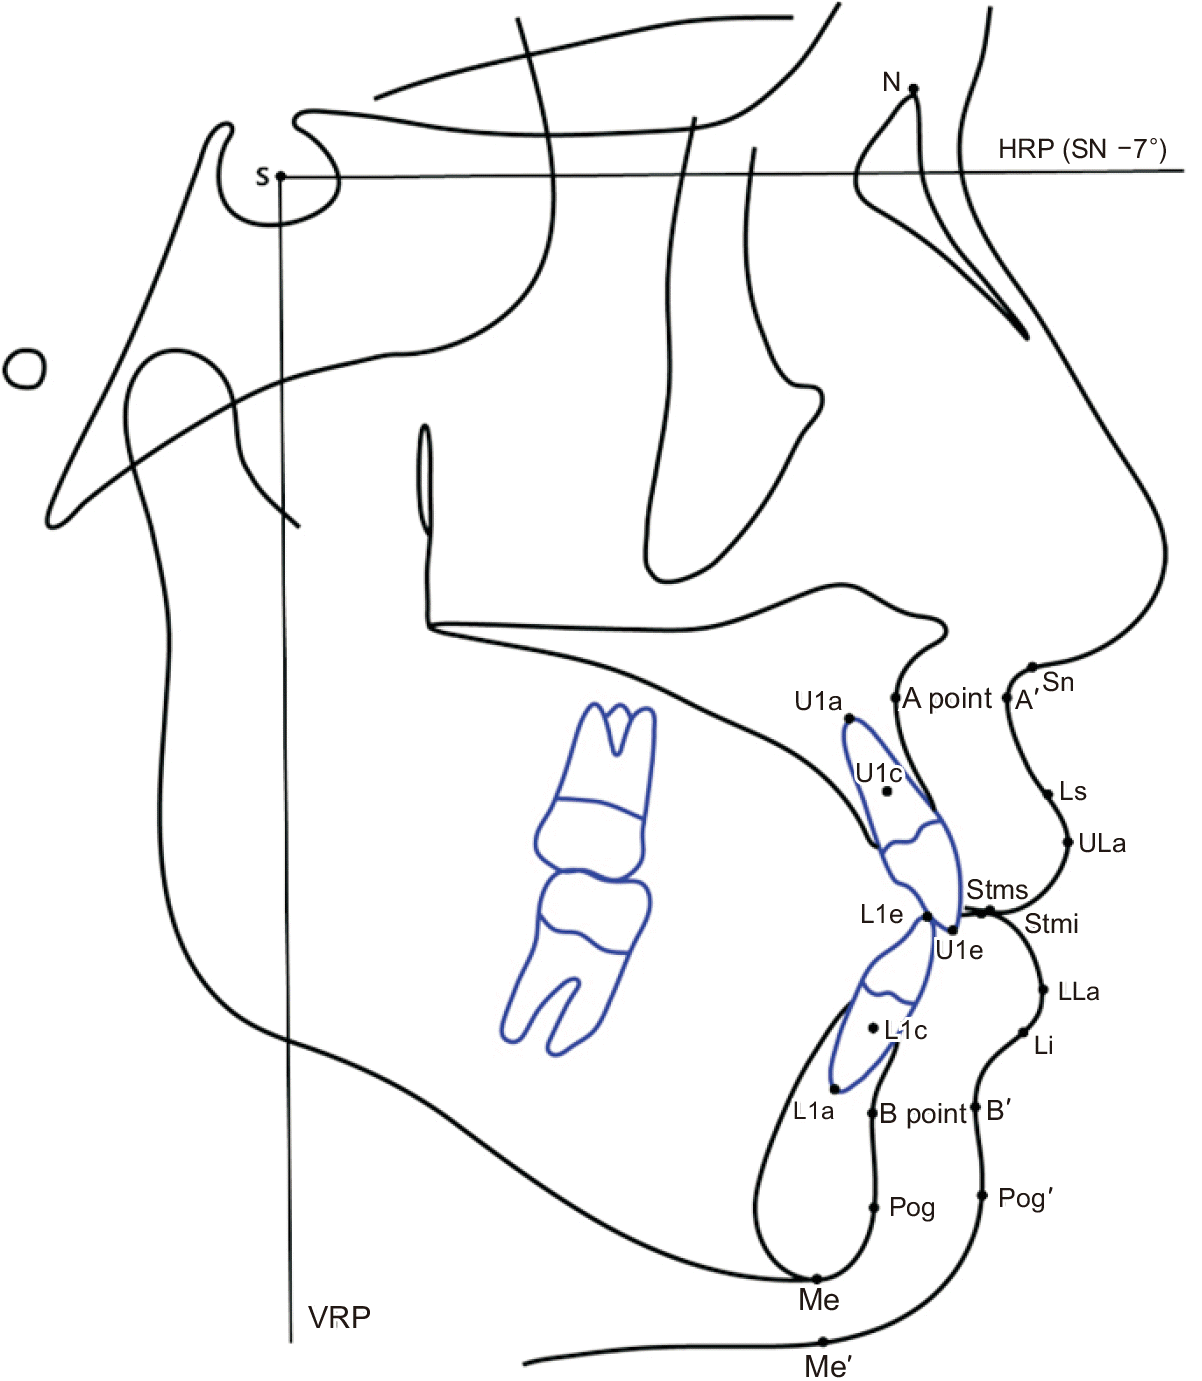 | Figure 1Cephalometric landmarks and reference planes.
S, sella; N, nasion; A, point A; B, point B; Pog, pogonion; Me, menton; U1e, upper central incisor edge; U1c, the center of resistance of the upper central incisor; U1a, root apex of the upper central incisor; L1e, lower central incisor edge; L1c, the center of resistance of the lower central incisor; L1a, root apex of the lower central incisor; Sn, subnasale; A’, soft tissue point A; Ls, labrale superioris; ULa, the most anterior point of upper lip; Stms, stomion superioris; Stmi, stomion inferioris; LLa, the most anterior point of lower lip; Li, labrale inferioris; B’, soft tissue point B; Pog’, soft tissue pogonion; Me’, soft tissue menton; HRP, horizontal reference plane; VRP, vertical reference plane.
|
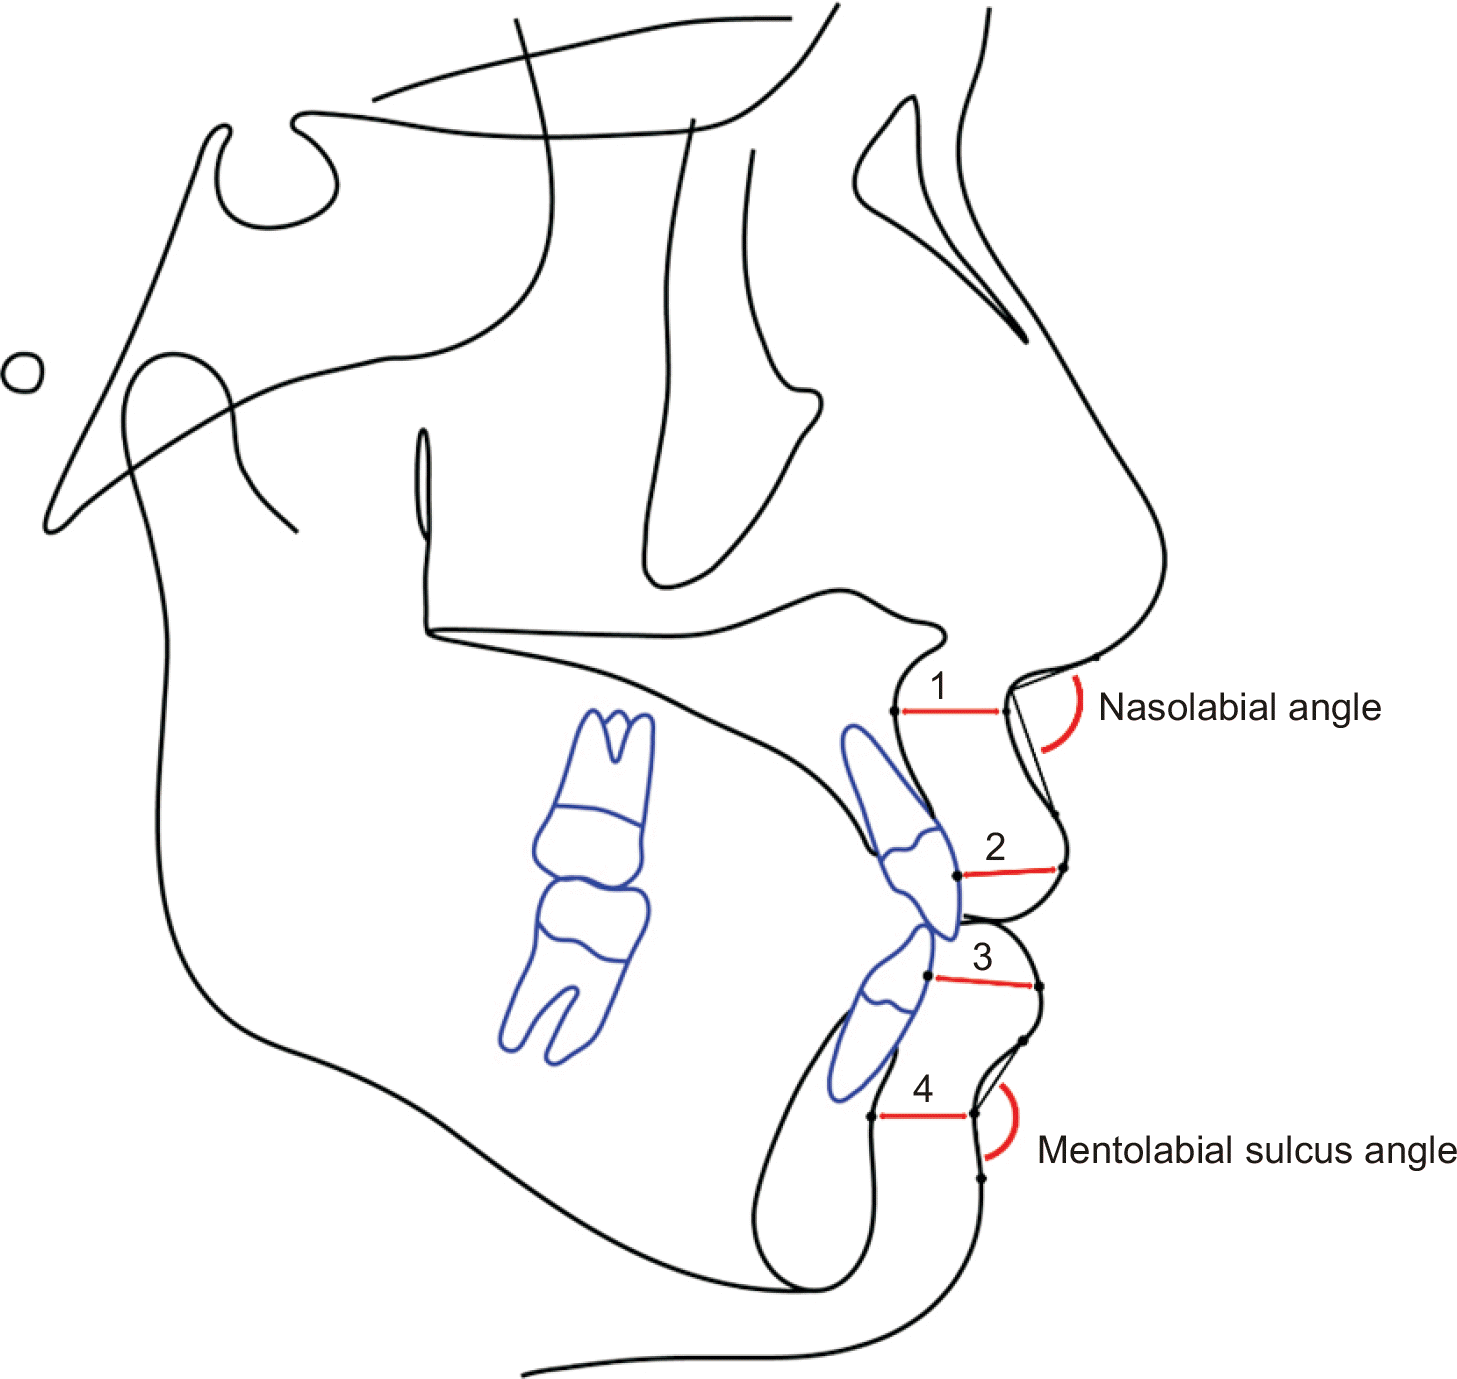 | Figure 2Additional cephalometric measurements.
1, basal upper lip thickness (distance between the A point and soft tissue point A); 2, upper lip thickness (the shortest distance between the labial surface of the upper central incisor and ULa); 3, lower lip thickness (the shortest distance between the labial surface of the lower central incisor and LLa); 4, basal lower lip thickness (the distance between point B and soft tissue point B).
|
Table 2
Definitions of cephalometric reference planes and measurements
![]()
Reliability
All lateral cephalometric tracings and measurements were performed by the same investigator. One week after the first tracing, 10 samples were randomly selected and retraced. The intra-class correlation coefficients of each variable were ≥ 0.93, showing a high degree of reliability.
Statistical analysis
All statistical analyses were performed using IBM SPSS Statistics software for Windows, version 20.0 (IBM Corp., Armonk, NY, USA). Based on a preliminary study, a minimum sample size of 26 per group was required (G*power 3, Dusseldorf, Germany) at a significance level of p < 0.05, a power of 80%, and an effect size of 0.80 to detect differences in treatment changes between the two groups using an independent t-test. The Shapiro–Wilk test was used to confirm the normality of the data’s distribution. The differences in demographic features concerning gender between the two groups were analyzed with the χ2 test. Independent t-tests were used to compare the difference between variables in T1 and T2 and changes during treatment (T1–T2) between the two groups. Pearson’s correlation coefficients were calculated to verify the association between lip profile changes and other variables.
Go to :
RESULTS
There were no significant differences in demographic features of the subjects between the two groups, including sex, age, and treatment duration (Table 1). There were no differences in the pre-treatment skeletal and soft tissue variables between the tipping and translation groups (Table 3). However, there were significant differences in some pre-treatment dental variables, such as the U1 to SN and interincisal angle (p < 0.001).
Table 3
Comparison of pre-treatment cephalometric variables between tipping and translation groups
| Variable | Tipping group (n = 27) | Translation group (n = 26) | p-value |
|---|---|---|---|
| SNA (°) | 81.42 ± 3.49 | 81.25 ± 3.38 | 0.861 |
| SNB (°) | 77.46 ± 3.55 | 77.21 ± 4.02 | 0.807 |
| ANB difference (°) | 3.95 ± 2.19 | 4.04 ± 2.34 | 0.886 |
| Wits (mm) | −0.86 ± 3.00 | −1.47 ± 3.27 | 0.480 |
| SN-GoMe (°) | 37.45 ± 6.33 | 38.49 ± 6.52 | 0.560 |
| U1 to SN (°) | 110.99 ± 6.17 | 104.79 ± 6.46 | 0.001** |
| IMPA (°) | 103.69 ± 7.00 | 99.52 ± 6.01 | 0.024* |
| Interincisal angle (°) | 107.89 ± 7.54 | 117.22 ± 7.51 | 0.000*** |
| Upper lip to E-line (mm) | 2.49 ± 2.11 | 2.50 ± 2.08 | 0.994 |
| Lowe lip to E-line (mm) | 4.75 ± 2.17 | 5.15 ± 2.49 | 0.541 |
| Nasolabial angle (°) | 96.70 ± 10.04 | 99.35 ± 11.99 | 0.385 |
| Mentolabial sulcus angle (°) | 134.40 ± 11.31 | 135.95 ± 13.99 | 0.659 |
![]()
Retraction amounts of the upper and lower incisal edges were near 7 mm in both groups, with no significant differences between the two groups (Table 4). However, there were significant between-group differences in most of the other dental variables. The U1 to SN and IMPA decreased significantly by 16.20 ± 3.64 and 18.21 ± 4.80°, respectively, in the tipping group, and 3.42 ± 4.13 and 4.50 ± 3.23°, respectively, in the translation group (p < 0.001). The retraction of the root apex of the upper and lower incisors were 0.33 ± 0.38 and 0.26 ± 0.45 mm, respectively, in the tipping group, and 5.02 ± 1.32 and 5.31 ± 1.46 mm, respectively, in the translation group, which were significantly different (p < 0.001). There were also significant differences in the vertical movement of the root apex of the upper and lower incisors. The root apex of the upper incisor moved 1.18 ± 1.23 mm upward in the tipping group and –0.08 ± 1.35 mm downward in the translation group (p < 0.01). The root apex of the lower incisor moved 0.54 ± 1.28 mm downward in the tipping group and 1.48 ± 1.62 mm upward in the translation group (p < 0.001).
Table 4
Comparison of the dental changes during the treatment period
| Dental variable | T1 | T1−T2 | p-value | |||
|---|---|---|---|---|---|---|
|
Tipping group (n = 27) |
Translation group (n = 26) |
Tipping group (n = 27) |
Translation group (n = 26) |
|||
| U1 to SN (°) | 110.99 ± 6.17 | 104.79 ± 6.46 | 16.20 ± 3.64 | 3.42 ± 4.13 | 0.000*** | |
| IMPA (°) | 103.69 ± 7.00 | 99.52 ± 6.01 | 18.21 ± 4.80 | 4.50 ± 3.23 | 0.000*** | |
| Interincisal angle (°) | 107.89 ± 7.54 | 117.22 ± 7.51 | −34.53 ± 6.50 | −7.94 ± 5.11 | 0.000*** | |
| Overjet (mm) | 3.74 ± 1.70 | 3.46 ± 1.67 | −0.12 ± 1.58 | −0.25 ± 1.67 | 0.775 | |
| Overbite (mm) | 0.80 ± 1.86 | 1.28 ± 1.87 | −1.72 ± 1.65 | −1.11 ± 1.83 | 0.212 | |
| VRP-U1e (mm) | 76.29 ± 5.67 | 75.69 ± 8.20 | 7.44 ± 1.66 | 7.06 ± 1.45 | 0.390 | |
| VRP-U1c (mm) | 68.62 ± 4.81 | 69.33 ± 7.04 | 2.76 ± 1.05 | 5.73 ± 1.08 | 0.000*** | |
| VRP-U1a (mm) | 64.16 ± 4.44 | 65.70 ± 6.67 | 0.33 ± 0.38 | 5.02 ± 1.32 | 0.000*** | |
| VRP-L1e (mm) | 72.33 ± 6.17 | 72.65 ± 8.44 | 6.71 ± 1.18 | 7.03 ± 1.40 | 0.367 | |
| VRP-L1c (mm) | 63.03 ± 6.38 | 63.69 ± 9.12 | 2.71 ± 0.88 | 5.75 ± 1.37 | 0.000*** | |
| VRP-L1a (mm) | 56.94 ± 6.87 | 58.39 ± 9.66 | 0.26 ± 0.45 | 5.31 ± 1.46 | 0.000*** | |
| HRP-U1e (mm) | 82.58 ± 4.90 | 84.10 ± 5.74 | −0.10 ± 1.70 | 0.89 ± 1.61 | 0.035* | |
| HRP-U1c (mm) | 67.26 ± 3.94 | 67.73 ± 5.07 | 0.61 ± 1.07 | 0.36 ± 1.08 | 0.393 | |
| HRP-U1a (mm) | 59.69 ± 3.66 | 59.32 ± 4.56 | 1.18 ± 1.23 | −0.08 ± 1.35 | 0.001** | |
| HRP-L1e (mm) | 81.48 ± 4.86 | 82.01 ± 5.91 | 2.14 ± 1.65 | 2.04 ± 1.48 | 0.829 | |
| HRP-L1c (mm) | 91.57 ± 4.69 | 92.46 ± 5.84 | 0.48 ± 1.14 | 1.73 ± 1.37 | 0.001** | |
| HRP-L1a (mm) | 97.36 ± 4.90 | 98.30 ± 5.97 | −0.54 ± 1.28 | 1.48 ± 1.62 | 0.000*** | |
![]()
Comparing the between-group differences in skeletal changes during the treatment period, showed were significant differences in SNB (p < 0.001), ANB (p < 0.001), Wits appraisal (p < 0.01), VRP-A (p < 0.001), and VRP-B (p < 0.001; Table 5). SNB increased by 0.02 ± 0.35° in the tipping group and decreased by 0.83 ± 0.63° in the translation group. ANB increased by 0.06 ± 0.37° in the tipping group and increased by 0.81 ± 0.63° in the translation group. Wits appraisal decreased by 0.60 ± 1.56° in the tipping group and increased by 1.06 ± 1.81° in the translation group. Points A and B moved posteriorly 0.06 ± 0.37 and 0.05 ± 0.75 mm, respectively, in the tipping group, and 0.61 ± 0.49 and 1.98 ± 1.18 mm, respectively, in the translation group. There were no other significant differences in skeletal changes between the two groups.
Table 5
Comparison of the skeletal changes during the treatment period
| Skeletal variable | T1 | T1–T2 | p-value | |||
|---|---|---|---|---|---|---|
|
Tipping group (n = 27) |
Translation group (n = 26) |
Tipping group (n = 27) |
Translation group (n = 26) |
|||
| SNA (°) | 81.42 ± 3.49 | 81.25 ± 3.38 | −0.08 ± 0.18 | 0.02 ± 0.31 | 0.161 | |
| SNB (°) | 77.46 ± 3.55 | 77.21 ± 4.02 | −0.02 ± 0.35 | 0.83 ± 0.63 | 0.000*** | |
| ANB difference (°) | 3.95 ± 2.19 | 4.04 ± 2.34 | −0.06 ± 0.37 | −0.81 ± 0.63 | 0.000*** | |
| Wits (mm) | −0.86 ± 3.00 | −1.47 ± 3.27 | 0.60 ± 1.56 | −1.06 ± 1.81 | 0.001** | |
| SN-GoMe (°) | 37.45 ± 6.33 | 38.49 ± 6.52 | 0.11 ± 0.76 | 0.02 ± 1.00 | 0.705 | |
| VRP-A (mm) | 67.99 ± 4.04 | 69.49 ± 6.37 | 0.06 ± 0.37 | 0.61 ± 0.49 | 0.000*** | |
| VRP-B (mm) | 59.20 ± 7.19 | 60.38 ± 9.66 | 0.05 ± 0.75 | 1.98 ± 1.18 | 0.000*** | |
| VRP-Pog (mm) | 57.54 ± 8.35 | 57.93 ± 10.96 | −0.26 ± 1.09 | 0.11 ± 1.35 | 0.275 | |
| HRP-A (mm) | 56.46 ± 3.53 | 56.93 ± 4.33 | 0.01 ± 0.33 | 0.03 ± 0.55 | 0.865 | |
| HRP-B (mm) | 100.86 ± 5.35 | 100.54 ± 6.11 | 0.38 ± 0.90 | 0.96 ± 1.52 | 0.095 | |
| HRP-Pog (mm) | 115.73 ± 6.79 | 116.60 ± 6.97 | 0.17 ± 1.01 | 0.25 ± 1.07 | 0.791 | |
![]()
The posterior movement of soft tissue points A and B were 0.61 ± 0.59 and 1.25 ± 1.46 mm, respectively, in the tipping group, and 1.10 ± 0.70 and 3.25 ± 1.92 mm, respectively, in the translation group, with both showing significant differences (p < 0.01; Table 6). There was also a significant difference in the mentolabial sulcus angle between the two groups; in the tipping group, the mentolabial sulcus angle increased by 5.89 ± 5.88°, whereas in the translation group, it decreased by 8.13 ± 6.32° (p < 0.001).
Table 6
Comparison of the soft tissue changes during the treatment period
| Soft tissue variable | T1 | T1–T2 | p-value | |||
|---|---|---|---|---|---|---|
|
Tipping group (n = 27) |
Translation group (n = 26) |
Tipping group (n = 27) |
Translation group (n = 26) |
|||
| VRP-Sn (mm) | 83.08 ± 4.05 | 83.58 ± 7.25 | 0.25 ± 0.29 | 0.39 ± 0.47 | 0.170 | |
| VRP-A' (mm) | 81.76 ± 4.06 | 82.65 ± 7.28 | 0.61 ± 0.59 | 1.10 ± 0.70 | 0.008** | |
| VRP-Ls (mm) | 85.82 ± 4.78 | 86.21 ± 8.46 | 2.59 ± 0.98 | 2.92 ± 1.29 | 0.308 | |
| VRP-ULa (mm) | 87.53 ± 4.78 | 87.73 ± 8.46 | 2.62 ± 1.27 | 3.15 ± 1.42 | 0.157 | |
| VRP-Stms (mm) | 80.54 ± 5.37 | 80.48 ± 8.11 | 5.25 ± 1.37 | 5.37 ± 2.16 | 0.800 | |
| VRP-Stmi (mm) | 79.25 ± 5.23 | 79.46 ± 8.56 | 5.79 ± 1.56 | 6.37 ± 2.22 | 0.276 | |
| VRP-LLa (mm) | 84.44 ± 5.46 | 84.77 ± 9.48 | 3.96 ± 1.27 | 5.07 ± 2.34 | 0.036* | |
| VRP-Li (mm) | 79.32 ± 5.86 | 79.39 ± 9.77 | 2.81 ± 1.71 | 4.04 ± 2.10 | 0.024* | |
| VRP-B' (mm) | 74.02 ± 6.25 | 74.88 ± 9.35 | 1.25 ± 1.46 | 3.25 ± 1.92 | 0.000*** | |
| VRP-Pog' (mm) | 69.75 ± 8.29 | 70.03 ± 10.76 | −0.32 ± 0.92 | 0.06 ± 1.32 | 0.232 | |
| HRP-Sn (mm) | 54.53 ± 3.97 | 54.99 ± 4.02 | −0.12 ± 0.51 | 0.04 ± 0.73 | 0.369 | |
| HRP-A' (mm) | 56.50 ± 3.93 | 56.66 ± 4.21 | −0.11 ± 0.52 | −0.05 ± 0.45 | 0.659 | |
| HRP-Ls (mm) | 68.26 ± 5.08 | 68.53 ± 5.39 | −0.83 ± 1.16 | −1.31 ± 1.37 | 0.182 | |
| HRP-upper lip (mm) | 74.83 ± 4.83 | 74.64 ± 5.52 | 0.15 ± 0.80 | −0.46 ± 1.14 | 0.028* | |
| HRP-Stms (mm) | 80.58 ± 4.99 | 81.30 ± 5.81 | 0.25 ± 1.50 | 0.13 ± 1.12 | 0.733 | |
| HRP-Stmi (mm) | 81.23 ± 4.73 | 82.05 ± 5.62 | 0.88 ± 1.54 | 0.99 ± 1.11 | 0.764 | |
| HRP-lower lip (mm) | 89.76 ± 5.63 | 90.66 ± 6.68 | 1.17 ± 2.33 | 1.00 ± 1.42 | 0.759 | |
| HRP-Li (mm) | 94.82 ± 4.73 | 95.90 ± 7.11 | 1.72 ± 1.96 | 2.00 ± 1.56 | 0.567 | |
| HRP-B' (mm) | 100.93 ± 5.72 | 101.32 ± 7.88 | 0.88 ± 1.48 | 2.15 ± 2.12 | 0.015* | |
| HRP-Pog' (mm) | 115.74 ± 6.74 | 116.87 ± 7.14 | −0.17 ± 1.08 | 0.39 ± 1.54 | 0.133 | |
| Basal upper lip thickness (mm) | 13.80 ± 1.49 | 13.29 ± 2.03 | 0.53 ± 0.55 | 0.62 ± 0.56 | 0.548 | |
| Upper lip thickness (mm) | 11.11 ± 1.98 | 11.34 ± 2.34 | −2.91 ± 1.66 | −3.40 ± 1.42 | 0.253 | |
| Lower lip thickness (mm) | 14.19 ± 2.29 | 14.10 ± 2.28 | −1.37 ± 1.55 | −1.63 ± 1.89 | 0.576 | |
| Basal lower lip thickness (mm) | 15.23 ± 2.41 | 14.92 ± 2.10 | 1.51 ± 1.63 | 1.07 ± 1.66 | 0.339 | |
| Nasolabial angle (°) | 96.70 ± 10.04 | 99.35 ± 11.99 | −9.19 ± 4.61 | −7.31 ± 5.06 | 0.164 | |
| Mentolabial sulcus angle (°) | 134.40 ± 11.31 | 135.95 ± 13.99 | −5.89 ± 5.88 | 8.13 ± 6.32 | 0.000*** | |
![]()
In Pearson's correlation coefficients test, posterior movement of the most anterior point of the upper lip (ULa) was significantly positively correlated with the movement of the upper central incisor edge (U1e; r = 0.30; p < 0.05), the posterior movement of soft tissue point A showed a strong positive correlation with the movement of point A (r = 0.59; p < 0.001) and the movement of the root apex of the upper central incisor (U1a; r = 0.47; p < 0.001; Table 7). The posterior movement of the most anterior point of the lower lip (LLa) was significantly positively correlated with the movement of the lower central incisor’s edge (L1e; r = 0.40; p < 0.01), and the posterior movement of soft tissue point B showed a strong positive correlation with the movement of point B (r = 0.69; p < 0.001) and the movement of the root apex of the lower central incisor (L1a; r = 0.57; p < 0.001).
Table 7
Pearson's correlation coefficients between lip profile changes and other variables
| Lip profile changes | Other variables | ||
|---|---|---|---|
| VRP-A' |
VRP-A 0.592*** |
VRP-U1a 0.474*** |
|
| VRP-ULa |
VRP-U1e 0.302* |
VRP-U1a 0.280* |
|
| VRP-LLa |
VRP-L1e 0.397** |
VRP-L1a 0.387** |
VRP-U1e 0.355** |
| VRP-B' |
VRP-B 0.692*** |
VRP-L1a 0.571*** |
|
![]()
Go to :
DISCUSSION
Many previous studies have examined the associated soft tissue changes, especially in the lips, after the extraction of four premolars. However, most of these studies used the conventional anchorage system rather than a maximum anchorage system, such as the skeletal anchorage system.2,13 A few previous studies reported the use of maximum anchorage systems during the retraction of anterior teeth; however, they mainly focused on the amount and not the type of retraction.1,3 In this study, we evaluated the changes in hard and soft tissues after maximum retraction of the anterior teeth depending on the type of anterior teeth retraction, tipping or translation. We found significant differences in the hard and soft tissue changes between the two groups, especially in the region near the root apex of the upper and lower incisors.
In this study, we included only patients at CVMI stage 6 to exclude the influence of growth on the soft tissue profile during treatment.14 All subjects had initial lip protrusions with more than 0.5 standard deviations above the average Korean value of lip position relative to Ricketts’ E-line,12 and there was no significant difference between the two groups. We excluded patients with > 2° of change in the mandibular plane angle during treatment to rule out vertical influence. Vertical changes, such as mandibular jaw rotation, could affect the anteroposterior relationships,15 making data interpretation difficult.
In both groups, the average retraction amounts of the upper and lower incisor edges were near 7 mm, with no significant differences. In the tipping group, the changes in U1 to SN and IMPA were 16.20 and 18.21°, respectively, and retraction amounts of the root apex of the upper and lower incisors were 0.33 and 0.26 mm, respectively, implying that controlled tipping occurred. In the translation group, the changes in U1 to SN and IMPA were 3.42 and 4.50°, respectively, and retraction amounts of the root apex of the upper and lower incisors were 5.02 and 5.31 mm, respectively, implying that a movement close to bodily translation of the anterior teeth was achieved (Table 4). In two previous studies, retraction amounts of the root apex of the upper and lower incisors were 1.20 and 1.10 mm, respectively,16 and 2.59 and 4.11 mm, respectively.3 Compared to these previous studies, much more retraction of the root apex of the incisors was observed in this study.
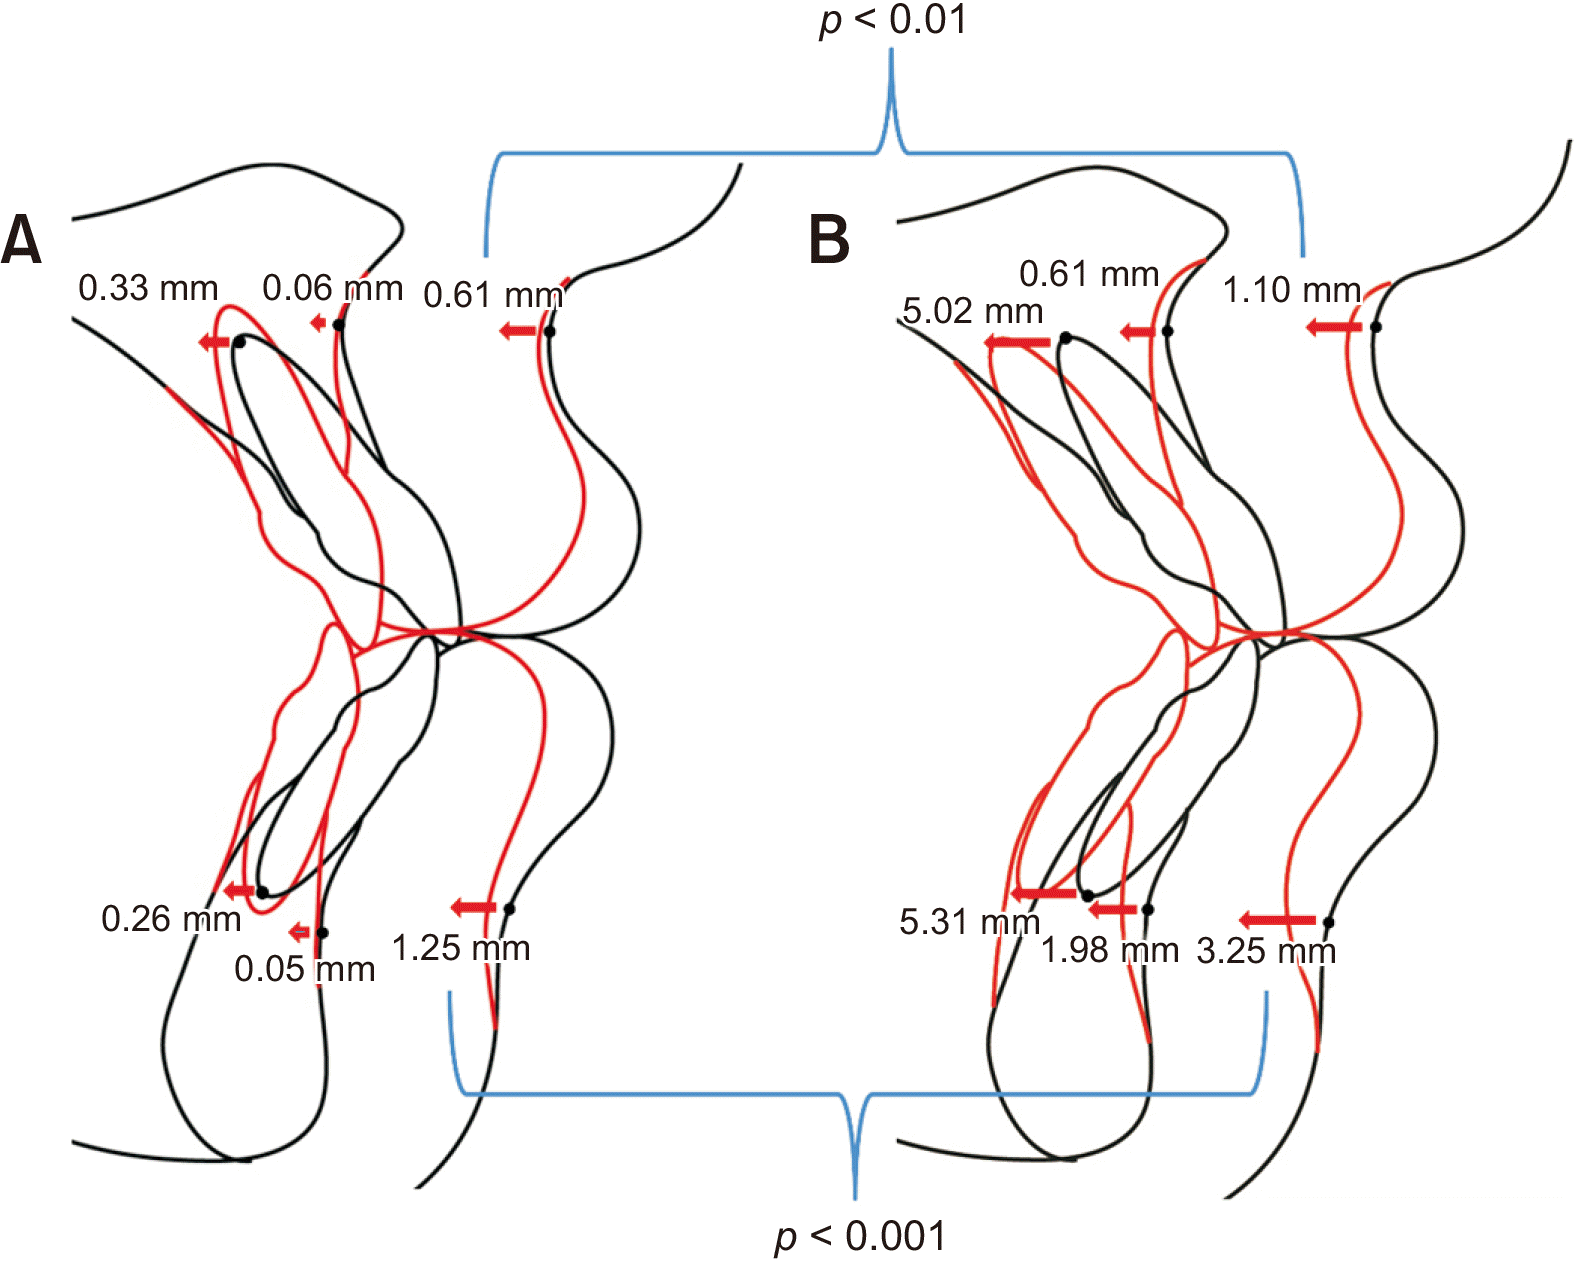
Horizontal changes in points A and B during treatment showed significant between-group differences (p < 0.001); point A moved more posteriorly in the translation group (0.61 mm) than in the tipping group (0.06 mm), and point B moved much more posteriorly in the translation group (1.98 mm) than in the tipping group (0.05 mm). This led to a decrease in SNB and an increase in ANB and Wits appraisal in the translation group, assumed to be derived from a more posterior movement of the root apex of the upper and lower incisors observed in the translation group.
This implies that points A and B can be changed by the root movement of the upper and lower incisors. This finding corresponds to a previous study using cone-beam computed tomography, which found that point B could be remodeled during orthodontic treatment.17 However, the amount of posterior movement by point B was significantly larger than that of point A despite almost the same retraction amount of the root apex of the upper and lower incisors. One possible explanation for this difference in the behavior of points A and B is the difference in the initial horizontal distance from the root apex of the upper incisor to point A and from the root apex of the lower incisor to point B. There was a significant difference between points A and B in the initial horizontal distance regarding initial horizontal bone thickness (p < 0.001). The horizontal bone thickness at point A to the root apex of the upper incisor was 3.79 ± 2.09 mm, and at B point to the root apex of the lower incisor was 1.99 ± 1.65 mm. Due to the small distance from the root apex of the lower incisor to point B, remodeling of point B could have occurred much easier than at point A.
There was a significant difference in the horizontal movement of soft tissue point A and soft tissue point B between the two groups (p < 0.001). Soft tissue points A and B moved more posteriorly in the translation group (1.10 and 3.25 mm, respectively) than in the tipping group (0.61 and 1.25 mm, respectively; Figure 3). Since the retraction amounts of the upper and lower incisor edges were almost the same in both groups, the behaviors of soft tissue points A and B are assumed to result from the more posterior movement of the root apex of the upper and lower incisors in the translation group. In addition, comparing the response of soft tissue points A and B in the translation group, the proportional ratio of the upper incisor root apex retraction to soft tissue point A was 4.56:1 and the lower incisor root apex retraction to soft tissue point B was 1.63:1, showing that soft tissue point B is more sensitive to changes in the root’s position.
Different movement amounts of the soft tissue point B between the two groups also led to a significant difference in the change of the mentolabial sulcus angle. In the tipping group, the mentolabial sulcus angle increased by 5.89°. In contrast, in the translation group, the mentolabial sulcus angle decreased by 8.13°, caused by the more posterior movement of soft tissue point B. The mentolabial sulcus and the position of soft tissue point B are considered essential factors in assessing soft tissue profiles because they affect the esthetic features of both the lower lip and chin. Huang and Li18 reported that both orthodontists and laypersons consider the relative position of soft tissue point B and the mentolabial sulcus angle the most significant factors affecting facial esthetics in a study evaluating post-treatment facial esthetics after extraction of the first four premolars. They found that the formation of the mentolabial sulcus improved the evaluation of soft tissue esthetics rather than the flat sulcus. From this perspective, translational anterior teeth retraction may lead to more esthetic outcomes in some instances.
The posterior movement of ULa and LLa was mostly correlated with the horizontal movement of U1e and L1e, respectively. This finding is different from that of a previous study that showed that horizontal movement of the lower lip was mostly correlated with the horizontal movement of the incisal edge of the upper incisor.1 This different outcome is presumably due to the difference in the initial overjet value in the study sample, which was 3.60 mm in this study, in contrast to 8.17 mm in the study by Hayashida et al.,1 which should have had a greater influence on the upper incisor tip on the lower lip position.
The posterior movement of soft tissue point A was highly correlated with the movement of point A, followed by the movement of U1a. Similarly, the movement of soft tissue point B was highly correlated with the movement of point B, followed by the movement of L1a. These findings suggest that we can intentionally retract soft tissue points A and B by controlling the amount of root movement of the upper and lower incisors to induce the bone modeling of points A and B.
The findings of this study can be applied to the treatment strategies of Class III camouflage treatment. In the case of camouflage treatment of Class III patients, the retraction of the lower incisors is often included in treatment planning. However, several previous studies on Class III camouflage treatment showed that the retroclination of the lower incisors is typically accompanied during retraction, with an average degree between 6.5 and 8.1°, making a more retrusive and flat lower lip profile.19-21 Therefore, considering the results of this study, the translational retraction of the lower incisor along with the posterior movement of the root apex is recommended, especially in Class III camouflage treatment for the establishment of the esthetic lower lip contour line.
A few limitations to this study should be considered when applying these findings to clinical situations. First, the prediction of soft tissue changes after tooth movement can vary considerably depending on age, sex, dentofacial morphology, and ethnicity.5,22,23 Second, this study was designed retrospectively, and therefore, temporal soft tissue changes within the patients, such as body mass index, were not controlled.24 In addition, since the retention period was not included, there might have been some considerable post-treatment changes. These points should be considered in future studies.
Go to :
CONCLUSION
Our null hypothesis was rejected because the soft tissue response was different depending on the retraction type of the anterior teeth. The more the incisor root apex is retracted, the more posterior movement is experienced by points A and B, leading to more posterior movement of the soft tissue points A and B. This movement appears to be more distinct in cases involving the lower incisor and lower lip. These results may provide guidelines for deciding upon the type of tooth movement during anterior teeth retraction according to specific soft tissue goals.
Go to :
 XML Download