This article has been
cited by other articles in ScienceCentral.
Abstract
Background
The common causes of lower back pain with or without leg pain includes disk disease and spinal stenosis. A definitive diagnosis is usually made by means of magnetic resonance imaging (MRI), but treatment is often difficult because the MRI findings are not consistent with the symptoms of the patient in many cases. The objective of this study was to observe the correlation between the patterns of epidurography performed in patients having lower back pain with or without leg pain and the position or severity of the pain as subjectively described by the patients.
Methods
The subjects of this study were 69 outpatients with lower back pain with or without leg pain who visited our clinic and complained of predominant pain on one side. We performed caudal epidural block using an image intensifier. A mixture of the therapeutic drug and the contrast agent (10 ml) was injected to observe the contrast flow pattern. The patients who complained of predominant pain on one side were divided into the left side group and the right side group. A judgment of inconsistency was made if the contrast agent flowed to the side of the pain, while a judgment of consistency was made if the contrast agent flowed to the opposite side of the pain. The degree of the drug distribution was evaluated by counting the number of cells to which the contrast agent's flowed for evaluating the correlation between the contrasted cell and the severity of pain (one group ≤ VAS 7, the other group ≥ VAS 8) the degree of the contrast agent's contrast was evaluated by dividing and counting an image into 15 cells (the left, right, and middle sections at each level of L4, L5, S1, S2, and S3).
Results
Thirty out of the 69 patients who had laterality in pain, that is, those who complained of predominant pain on one side, showed that the laterality of the pain and the contrast agent flow was consistent, while 39 patients showed that the laterality was inconsistent (P: 0.137). The evaluation of the correlation between the pain and the contrast agent flow showed that the mean number of contrasted cells was 9.0 ± 2.2 for the 46 patients in the group with a VAS of 7 or lower and 6.5 ± 2.0 for the 23 patients in the group with a VAS of 8 or higher, indicating that the former group showed a significantly greater number of contrasted cells (P < 0.001).
Conclusions
This study, conducted with patients having lower back pain with or without leg pain, showed that the contrast flow pattern of caudal epidurography had a significant correlation with the severity of the pain but not with the laterality of the pain.
Go to :

Keywords: caudal block, contrast flow pattern, epidurography
INTRODUCTION
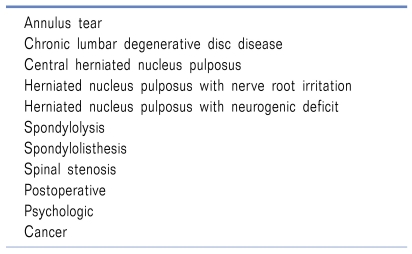
There are various causes of lower back pain with or without leg pain (
Table 1) [
1]. When lower back pain accompanies leg pain, disc disease or spinal stenosis is suspected. However, it is often difficult to accurately diagnose since the symptoms of the patient are inconsistent with the image findings. Despite the various causes, one of the maneuvers that are most frequently undergone by patients with lower back pain with or without leg pain is caudal epidural block. However, there are various responses from the patients who have undergone caudal epidural block. Some patients are satisfied since they do not experience any pain for a considerable period of time after the procedure, but the pain often resumes before long in other patients. Considering the differences among patients, it may be assumed that the result may be dependent on a certain difference in the pathological structural defect inside the epidural space. Takeshima et al. [
2] reported that epidural adhesion may occur by physical obstruction of the peripheral nerves and nerve root damage following lumbar surgery although the conditions for the occurrence of epidural adhesion are not certain. Hence, it could be considered that the lower back pain in patients with or without leg pain may be caused by epidural adhesion, which stimulates the nerve root rather than by such diseases as disk disease or spinal stenosis. Epidurography may be used to determine the degree of epidural adhesion.
Table 1
Eleven Diagnosis of Low-back Pain

As the patients' age increases, anatomical deformation or compression may occur in the patients who have degenerative disc disease, deformed joints, spinal stenosis, or a history of past lumbar surgery [
3]. For these reasons, the flow patterns of a contrast agent may be different and the efficiency of the administered drug may decrease as the injected drug fails to reach the desired target. In particular, the conventional epidural block has been performed by the interlaminar or caudal approach based on a blind method without the aid of an image intensifier, but the accuracy of the procedure is not known [
4] and the effect of the procedure is hard to predict. Studies have shown that the needle is located at an inappropriate position in more than 25% of the epidural insertion cases based on a blind method even though the procedure is performed by very skillful clinicians [
1,
5].
In this study, we performed caudal epidural blocks in patients with lower back pain with or without leg pain using an image intensifier and observed the correlation between the contrast flow pattern in the epidural space and the position or severity of the pain subjectively reported by the patients.
Go to :

MATERIALS AND METHODS
The caudal epidural block subjects of this study were 69 outpatients with lower back pain with or without leg pain who visited our clinic and complained of predominant pain on one side caused by a herniated disc, spinal stenosis, degenerative disk deformation, or post-lumbar surgery syndrome. The diagnosis was made based on the clinical findings of the patients, physical examination, computed tomography (CT), and magnetic resonance imaging (MRI). For the study, an explanation was given to all the patients, and consents were received from all of them before the procedure. The patients were asked to lie stomach side down on a fluoroscopic table, and the iliac crest was supported with a pillar. The region to be operated was examined, guided by the fluoroscope, and then disinfected with 10% povidone. The anteroposterior view was adjusted so that the sacral hiatus could be viewed well. The region through which the needle was to be inserted was infiltrated with 1% mepivacaine, and a 20 G Tuohy needle 9 cm in length was located in the epidural space with the image intensifier. Then, to check if the needle was accurately located in the epidural space in the lateral view, the loss of resistance technique was done and 1 ml of contrast agent (Omnipaque) was injected to examine the epidural space once again. When the findings of the contrast agent flow were fine, the image intensifier was returned to the anteroposterior view. A mixture of 2% mepivacaine 2 ml, triamcinolone 20 mg, hyaluronidase 1,500 u, saline solution, and contrast agent 5 ml was injected (total volume of 10 ml), and the acquired images were saved. The saved epidurographic images of the anteroposterior view were analyzed after the procedure.
To analyze the contrast pattern, the L4, L5, S1, S2, and S3 levels were divided into 15 cells by sectioning each level into the left, right, and middle parts. For the L4 and L5 levels, the lateral contrast flow on the anteroposterior views of the epidurographic images with reference to the medial side of the left or right pedicle was judged as the contrast to the left or the right. The middle contrast flow with reference to the medial side of the left or right pedicle was judged if the contrast agent's contrast was found in the middle [
6]. For the S1, S2 and S3 levels, the contrast flow to the left or the right was judged if the contrast was found outside the left or right neural foramen. The middle contrast flow was judged if the contrast was found in between the left and right neural foramina. The prior direction was determined by the number of cells contrasted to the left or to the right. If the number of cells to the left or to the right was the same, the direction was determined to the side where the quantity of the contrast agent outside the neural foramen was greater, and the total number of contrasted cells was written together (
Fig. 1).
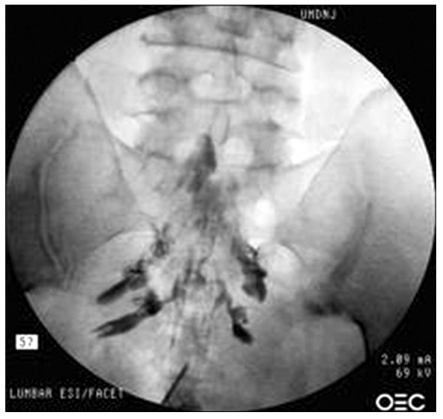 | Fig. 1The contrast agent flow to the left side. The number of cells to which the contrast agent flowed was eight (The result is judged as the flow to the left side because the quantity of the contrast agent that flowed to the left side was greater even though the number of cells to which the contrast agent flowed was the same as the two on the left and the right sides. A total of eight cells were contrasted: L5 middle, S1 middle, S2 left, right, and middle, S3 left, right, and middle.). 
|
Assuming that the contrast agent may not flow well to the region where there is pain because of the adhesion, we did an analysis of the results as follows: first, the contrast flow pattern was compared between the group of patients who complained of pain on the left side and the group on the right side (
Table 2). The cases where the painful region was on the same side of the contrast flow were judged as inconsistent, while the cases where it was different were judged as consistent (
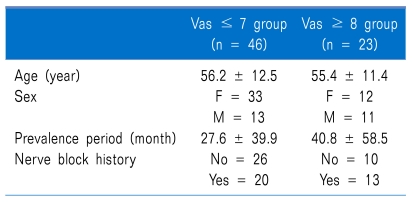
Table 3). Second, the contrast flow pattern was compared between the group with a VAS of 7 or lower and the group with a VAS of 8 or higher (
Table 4). The contrast pattern was analyzed by dividing the L4, L5, S1, S2, and S3 levels into 15 cells by sectioning each level into the left, right, and middle parts (
Fig. 1). The number of contrasted cells in each group was counted and compared by drawing a dispersion diagram (
Fig. 2). The age and prevalence period were expressed as the means ± standard deviation. We also investigated the sex and nerve block history of the patients.
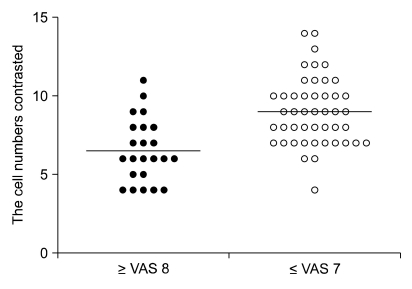 | Fig. 2Correlation between the severity of the pain and the caudal epidurography (P < 0.001). 
|
Table 2
Subject Groups Complaining of Pain on the Left or Right Side
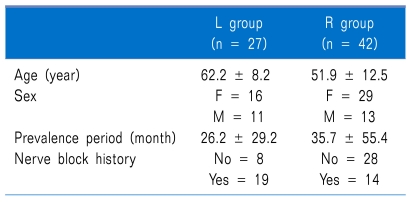

Table 3
Correlation Between the Pain Laterality and the Caudal Epidurography


Table 4
Subject Groups With a VAS of 8 or Higher and With a VAS of 7 or Lower

For the statistical analysis of the respective measurements, a chi-square test was done with respect to the correlation between the laterality of the pain and the contrast flow pattern. A Student's t-test was done with respect to the correlation between the severity of the pain and the contrast flow pattern. The cases in which the P value was 0.05 or less were significant.
Go to :

RESULTS
Among the 69 patients having lower back pain with or without leg pain and had pain laterality, the contrast agent flowed into the opposite side of the pain side in 30 patients (15 patients who complained of a predominant pain on the right side and 15 patients on the left side), and the findings were in good agreement with our assumption that the contrast agent would flow to the opposite direction of the pain side. On the contrary, the contrast agent flowed into the same side of the pain side in 39 patients (27 patients who complained of a predominant pain on the right side and 12 patients on the left side), showing the finding that was not in harmony with our assumption (
Table 3). The
P value was 0.137, indicating that the laterality of the pain was not significantly correlated with the contrast findings. However, the mean number of contrasted cells was 6.5 ± 2.0 in the 23 patients with very severe pain whose VAS was 8 or higher, while the value was 9.0 ± 2.2 in the 46 patients who did not have very severe pain with a VAS of 7 or lower, indicating that there was a significant correlation between the severity of the symptom and the overall contrast flow pattern (
P < 0.001)(
Fig. 2).
Go to :

DISCUSSION
Although there are various causes of lower back pain, the explanation of the causes is yet to be considered insufficient. Many diagnostic tools including plain film, CT, and MRI have been developed, but they are not powerful enough to accurately show the abnormalities in the micro soft tissues [
7]. In addition, it is even more difficult to find the causes of pain generated not by structural defects that can be investigated with various tools but due to functional abnormalities. Studies have shown that lower back pain may be caused as the nerve passing through the epidural space is stimulated by inflammation or adhesion inside the epidural space [
2,
8]. However, studies have not been actively done on that subject.
Epidural steroid injection (ESI) is one of the therapeutic methods that are most frequently done in patients with lower back or leg radiculopathy. The purpose of doing an ESI is to restrict the general effect of the steroid by directly injecting the drug to the target nerve root and epidural space [
9]. Although ESI has been used for decades for therapeutic purposes, its usefulness depends on the reports [
10-
12]. The main problem of the previous studies on the usefulness of ESI is that a blind method was used instead of CT or an image intensifier [
13,
14]. Thus, in terms of safety as well as identifying the therapeutic effect, it is important to use a contrast agent and an image intensifier to check if the needle is correctly located inside the epidural space, if the intravascular or intrathecal injection was done or if the contrast agent arrived at the lesion.
The epidural space is divided into the anterior and posterior epidural spaces. The anterior boundary of the anterior epidural space includes the vertebral body, intervertebral disc, and posterior longitudinal ligament, and the posterior boundary is the spinal cord [
3]. The posterior longitudinal ligament has abundant dolorific substances such as substance P that has been indentified immunologically. Since there are neuroterminals that dominate the intervertebral discs in the posterior longitudinal ligament, injection of the drug to it may yield particularly good therapeutic effects [
15]. The contrast agent injected to the epidural space flows to the region that has the least resistance, and the flow is also affected by intrinsic and extrinsic factors of the patient [
4,
16]. Takahashi et al. [
17] compared the change in the pressure inside the epidural spaces of patients with spinal stenosis while they were walking and reported that it was higher in patients with spinal stenosis than in normal subjects. Manchikanti et al. [
18] stated that the intravascular needle was placed unrecognizably in 5% of the patients whose blood was not aspirated or who did not show a flashback during fluoroscopic guided transforaminal epidurogram [
18].
The observation of a relationship between pain and the caudal epidurography in this study that we conducted with patients having lower back pain with or without leg pain was significant in various aspects. However, our study was limited because various causes of lower back pain were not taken into account, including not only the lesions inside the epidural space but also the referred pain that may be caused by problems in other structures rather than the spine including the facet joint as well as the surrounding ligaments and muscles and the hip muscles. Nevertheless, it can be assumed that lower back pain may be caused by the neurotransmission process from the terminal nerves when influenced by some factors. In particular, the investigation of the relationship between the epidurographic findings and the severity of the patients' symptoms showed a significant correlation, which needs to be studied further by means of continuous follow-up. Better results may be required by carrying out a more minute observation with respect to the pain caused only by the lesions in the spinal cavity, excluding the pains caused by other structures rather than the spine, or by investigating the correlations with the image findings of plain film, CT, and MRI.
In the epidurography that we suggested, if L5 is not contrasted or if the total number of contrasted cells is less than six, other positive therapeutic methods may need to be used including a more precise intervention or MRI examination since the result may indicate that the disease is severe. Additionally, decreased symptoms in a patient compared to previous epidurographic findings and recent findings can provide objective data. In addition, if the pain is not considered to originate from the joints, ligaments, or muscles in a patient with lower back pain with or without leg pain, caudal epidurography may be taken into consideration as a method for the diagnosis and treatment.
In conclusion, valuable objective evidence of the therapeutic effect could be provided on the state of the epidural space that cannot be known in detail with the MRI by examining the consistency between the patient's symptom and the contrast agent's flow pattern and comparing the results before and after the injection of the drug. This method seems to be superior to other therapeutic methods and tests as well as being cost-effective. We did not take into account the pressure of the injected contrast agent, the height, weight, and past history of nerve block of the patients. Observation of the correlations with greater details may provide better results. For this, a prospective study may need to be conducted with a greater number of patients.
Go to :


 PDF
PDF Citation
 Print
Print


 XML Download