

 PDF
PDF Citation
 Print
Print


INTRODUCTION
A form of chronic neuropathic pain, complex regional pain syndrome (CRPS) presents some defining features [1-3], such as severe, radiating, and non-dermatomal pain accompanied by pain triggered by stimuli that are not painful (allodynia) and abnormally increased sensitivity to pain (hyperalgesia) [3-5]. However, there are several aspects related to this condition that remain contentious [6,7].
What defines CRPS is a chronic neurological disorder affecting the upper or lower extremities following injury or surgical operations of all types and emerging in a spontaneous manner in a few cases. The condition manifests primarily as sensory and autonomic disruptions, such as allodynia/hyperalgesia, edema, skin blood flow alterations, and aberrant sudomotor activity, which is not proportional to the triggering event. There is also variation in intensity and duration, and the condition does not evolve in the same way in all patients [8,9].
CRPS is commonly distinguished according to trauma into CRPS I, without apparent nerve lesions, and CRPS II with apparent nerve lesions [10]. However, this classification relies on standard electrophysiology, which cannot evaluate partial nerve lesions, small fiber lesions, or deep somatic nerves. Therefore, the classification may not be genuine. Furthermore, it is important not to mistake CRPS II with post-traumatic neuralgia, which is associated with sensory loss, paresis, pain, hyperalgesia, and autonomic symptoms, including temperature or color alterations before nerve root lesion, exclusively in the nerve-nerve root innervation area [11,12].
Knowledge of the natural history of CRPS is largely limited, with no systematic research having been carried out. There is no evidentiary support for the common assumption that CRPS causes severe disability and devastation. The pathologic model most broadly adopted portrays CRPS as a complex mixture of various factors that start emerging during the original injury, such as sensitisation of the nervous system, autonomic impairment, and transformations of an inflammatory nature. Furthermore, the condition is thought to be promoted by certain genetic and psychological factors [13]. Diagnosis of CRPS does not rely on a particular assessment, but rather takes into account patient history, clinical examination, and symptoms [9].
CRPS is a disease that requires a great deal of social attention, not only due to its difficulty of treatment, but the patients’ high suicide rate [14]. However, the social burden of CRPS is largely unknown because not many large population-based studies have been conducted [5,15]. Therefore, the present study sought to investigate and update the CRPS incidence within Korea at a nation-wide level, and to assess that incidence according to changes in the structural demography of age in that country.
Go to : 
MATERIALS AND METHODS
1. Data collection
The National Health Insurance Service, the Korean Statistical Information Service (KOSIS), and the Health Insurance Review and Assessment Service (HIRA) in Korea were the sources from which data for the period 2009-2016 were derived. In particular, HIRA supplied data after de-identification, which encompassed age, sex, diagnosis, hospital visit dates, medication prescribed in both inpatient and outpatient visits, hospitalisation, medical interventions, and visits to the emergency department. For the purposes of research sample identification, a number of codes were employed for CRPS type 1 (M8900-M8909) and type 2 (G5880-G5881, G5780, and G564). Meanwhile, the data obtained from KOSIS included information on age, sex, hospital, and region. The study was approved by the Institutional Review Board of Soonchunhyang Bucheon Hospital (2021-02-005).
2. Statistical analysis
An annual estimation of cumulative patients was conducted and all results were approximated based on the formula number of patients (for the year) × 100,000/total population (for the year). As a primary outcome, the study aimed to establish the prevalence trend per year, and whether the factors of age, sex, hospital, and region were associated with distinct patterns. To that end, patients were separated into six age groups, namely, younger than 20, 20s, 30s, 40s, 50s, and older than 60. Regarding hospitals, they were divided into tertiary hospital, general hospitals, clinics, and others. Regarding areas, two groups were differentiated, namely, Seoul and Gyeonggi, and others.
The data were processed via Poisson regression analysis alongside two models. Model 1 involved calculation of the effect sizes of the general time trend, while Model 2 involved investigation of potential inter-group discrepancies, in time trend estimates, based on integration of the interaction effect to Model 1. Expression of the results took the form of an estimated value (standard error) and 95% confidence interval, with the variables of age, sex, hospital, and region being used to characterize the patient rate per 100,000 population. Furthermore, Spearman correlation analysis was performed to quantify and analyse how the patient rate per 100,000 of population was correlated with the proportion of the population. A two-sided test was carried out, with statistical significance being reflected in a P value of less than 0.05. R software Version 3.6.3 (R Foundation, Vienna, Austria) was employed for the entirety of data analysis.
Go to :
RESULTS
1. CRPS type 1 yearly trend
Over the 2009-2016 research period, there was a rise in the cumulative patient number from 8,815 to 9,162 but a reduction in the rate of patients per 100,000 people from 18.7 to 18.4, irrespective of population (Fig. 1). Thus, on the whole, there was a declining trend, with the exception of the period 2010-2014, when there was an increasing pattern. An explanation for these observations is provided in Table 1 and Fig. 2. The Age × Year of model 2 revealed no significant pattern differences between the age groups and the general trend (time trend = –0.2 [–1.086 to 0.686], P = 0.610), apart from the 20s age group, which showed an increase in the number of patients per 100,000 people from 8.92 to 9.85, but this was not statistically different from the under-20s group (time trend = 0.171 [-1.585 to 1.927], P = 0.850). Furthermore, the number of patients per 100,000 people rose slightly from 10.51 to 10.94 for the 30s age group as well, although the difference in slope was not statistically significant (time trend = 0.273 [–1.482 to 2.029], P = 0.762).
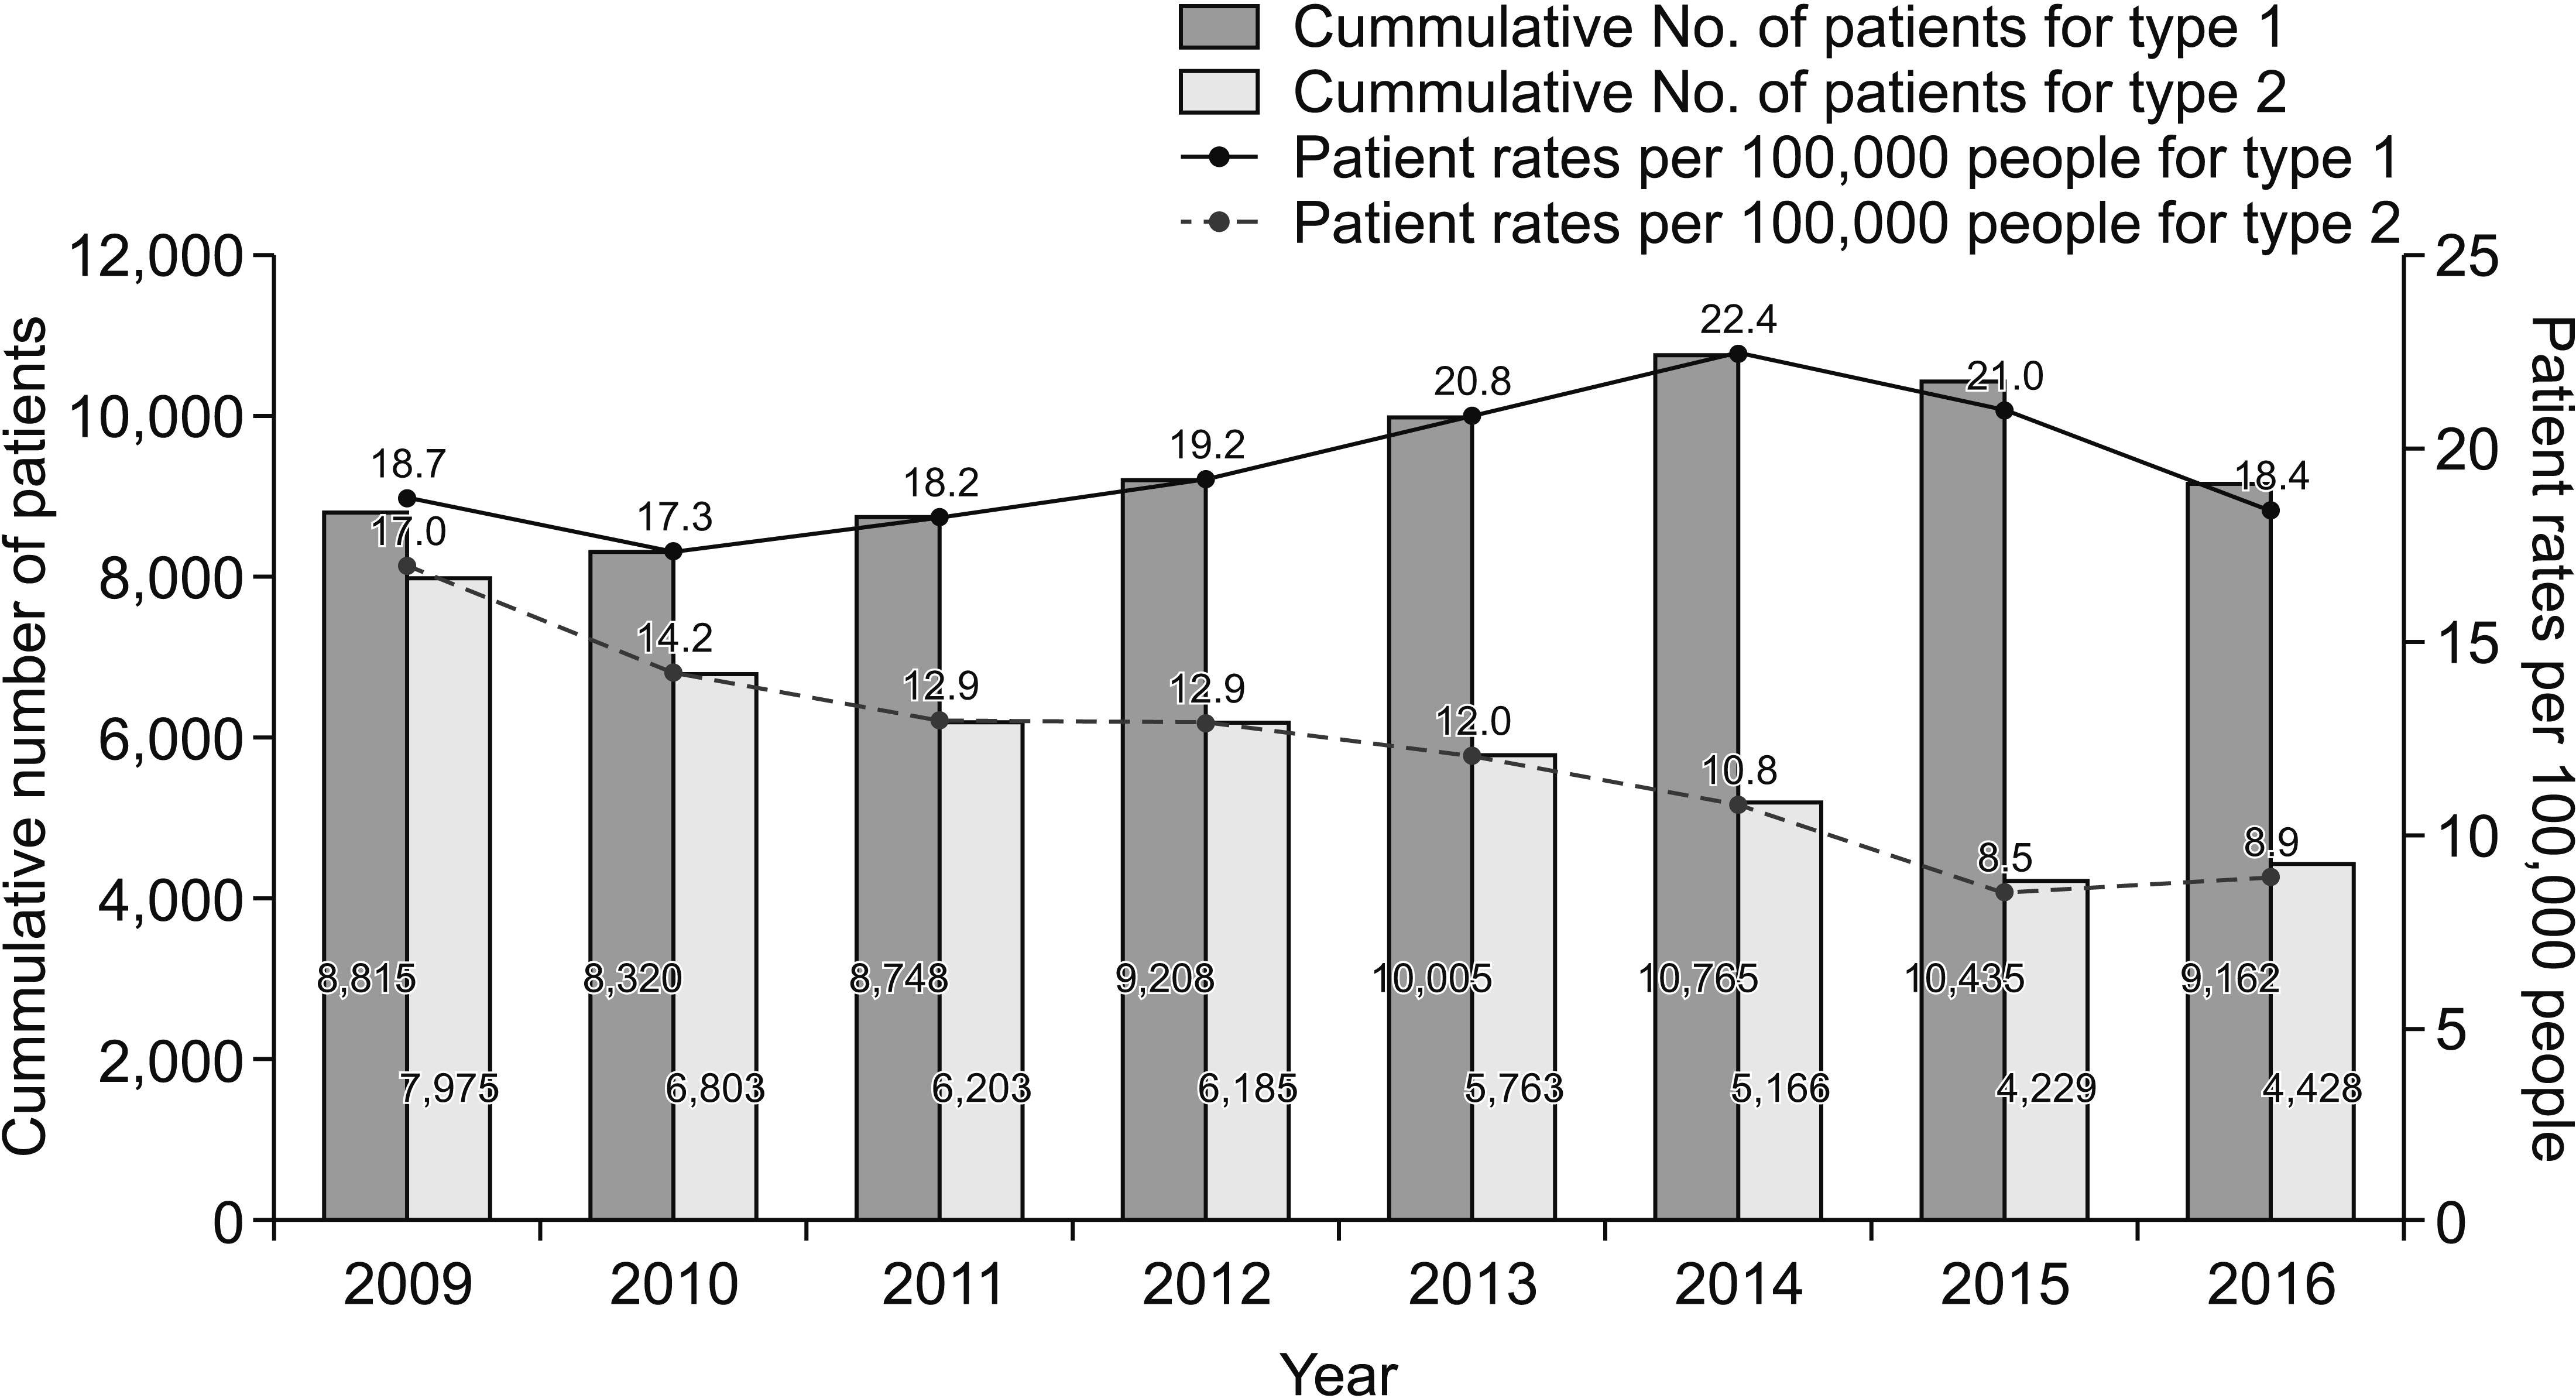 | Fig. 1Overall patient trends for complex regional pain syndrome type 1 and type 2 incidences between 2009 and 2016.
|
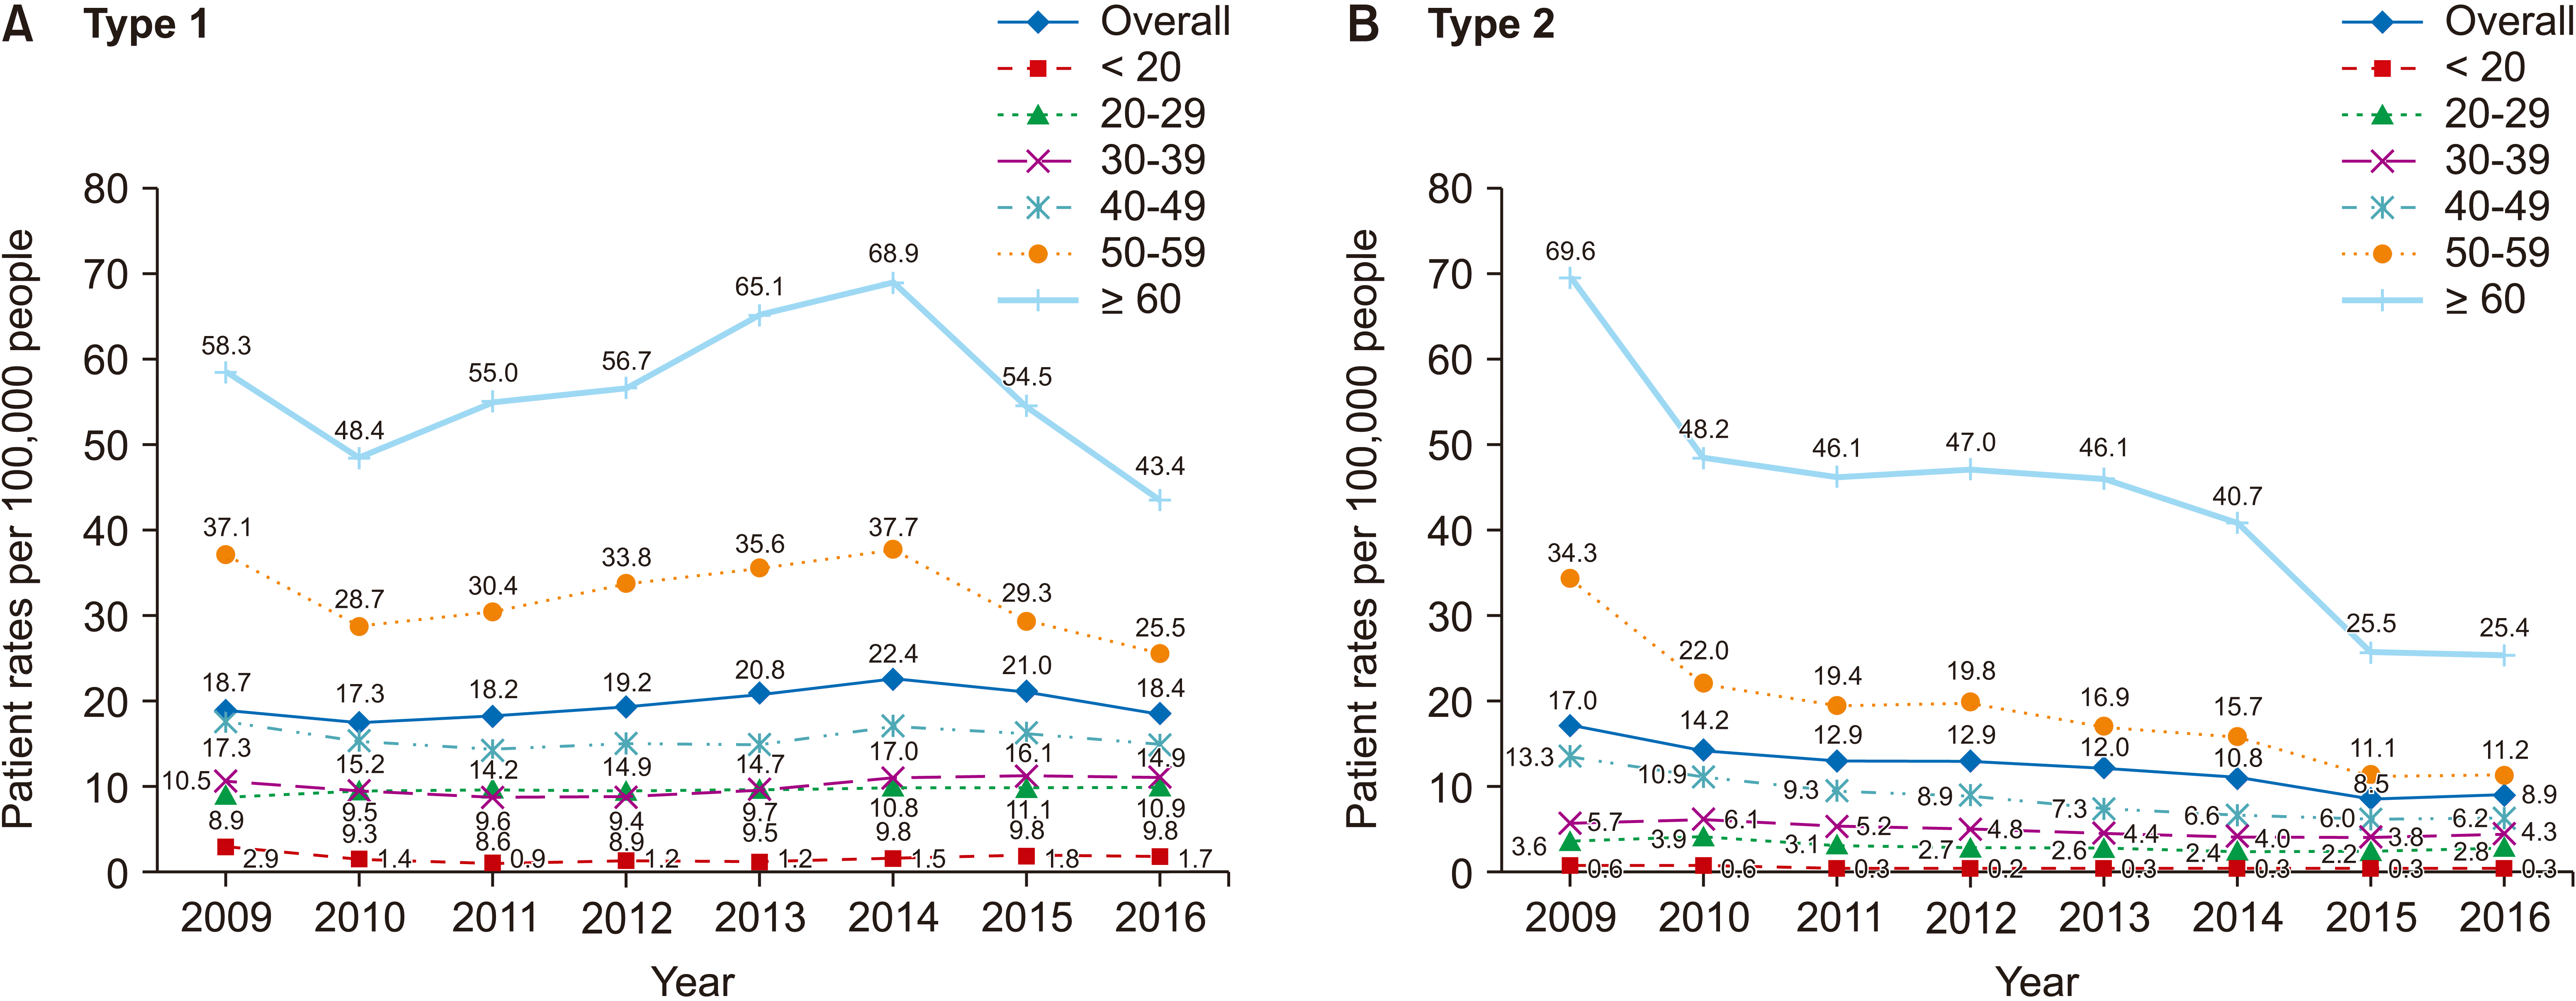 | Fig. 2Overall trends of the complex regional pain syndrome type 1 and type 2 incidences in patients: (A) overall trend between 2009 and 2016 showed a decreasing pattern; (B) the patient rate per 100,000 population showed a decrease in all age groups, except for the 20-29 and 30-39 patient groups.
|
Table 1
The trend for diagnosis of CRPS type 1 according to each group
![]()
Model 1 was associated with a time trend of –0.264 to 0.284, with a different direction, particularly with regard to area (time trend = 0.284 [–0.076 to 0.643], P = 0.138). Medical services for rare diseases are found mainly in Seoul, which is reflected in the fact that the number of patients rose quickly in Seoul but declined in other areas. Area-based adjustment is possible for this result. Meanwhile, the findings for Model 2 indicated a decrease in the percentage of patients per 100,000 people for both sexes, from 21.01 to 19.68 for females and from 16.46 to 17.06 for males. Nevertheless, the groups did not differ significantly with respect to time trends (time trend = –0.197 [–1.261 to 0.866], P = 0.722). The Model 2 findings also revealed reduction in the percentage of patients per 100,000 people for all types of medical centers considered, namely, from 2.15 to 1.42 for tertiary hospital, from 3.75 to 1.88 for general hospitals, from 1.45 to 0.89 for clinics, and from 9.61 to 4.69 for others. Comparison between the time trend and tertiary hospital showed no discrepancies of significance for clinics (time trend = –0.007 [–0.138 to 0.123], P = 0.912); in fact, there was a reduction of statistical significance observed for the general hospitals (time trend = –0.159 [–0.290 to 0.029], P = 0.024) and others (time trend = –0.606 [–0.736 to –0.475], P < 0.001). In terms of region, results were not statistically significant, with Model 2 yielding identical outcomes to Model 1, with a rise from 16.11 to 18.08 in Seoul, a reduction from 16.03 to 13.88 in Gyeonggi, and from 20.73 to 20.42 in others.
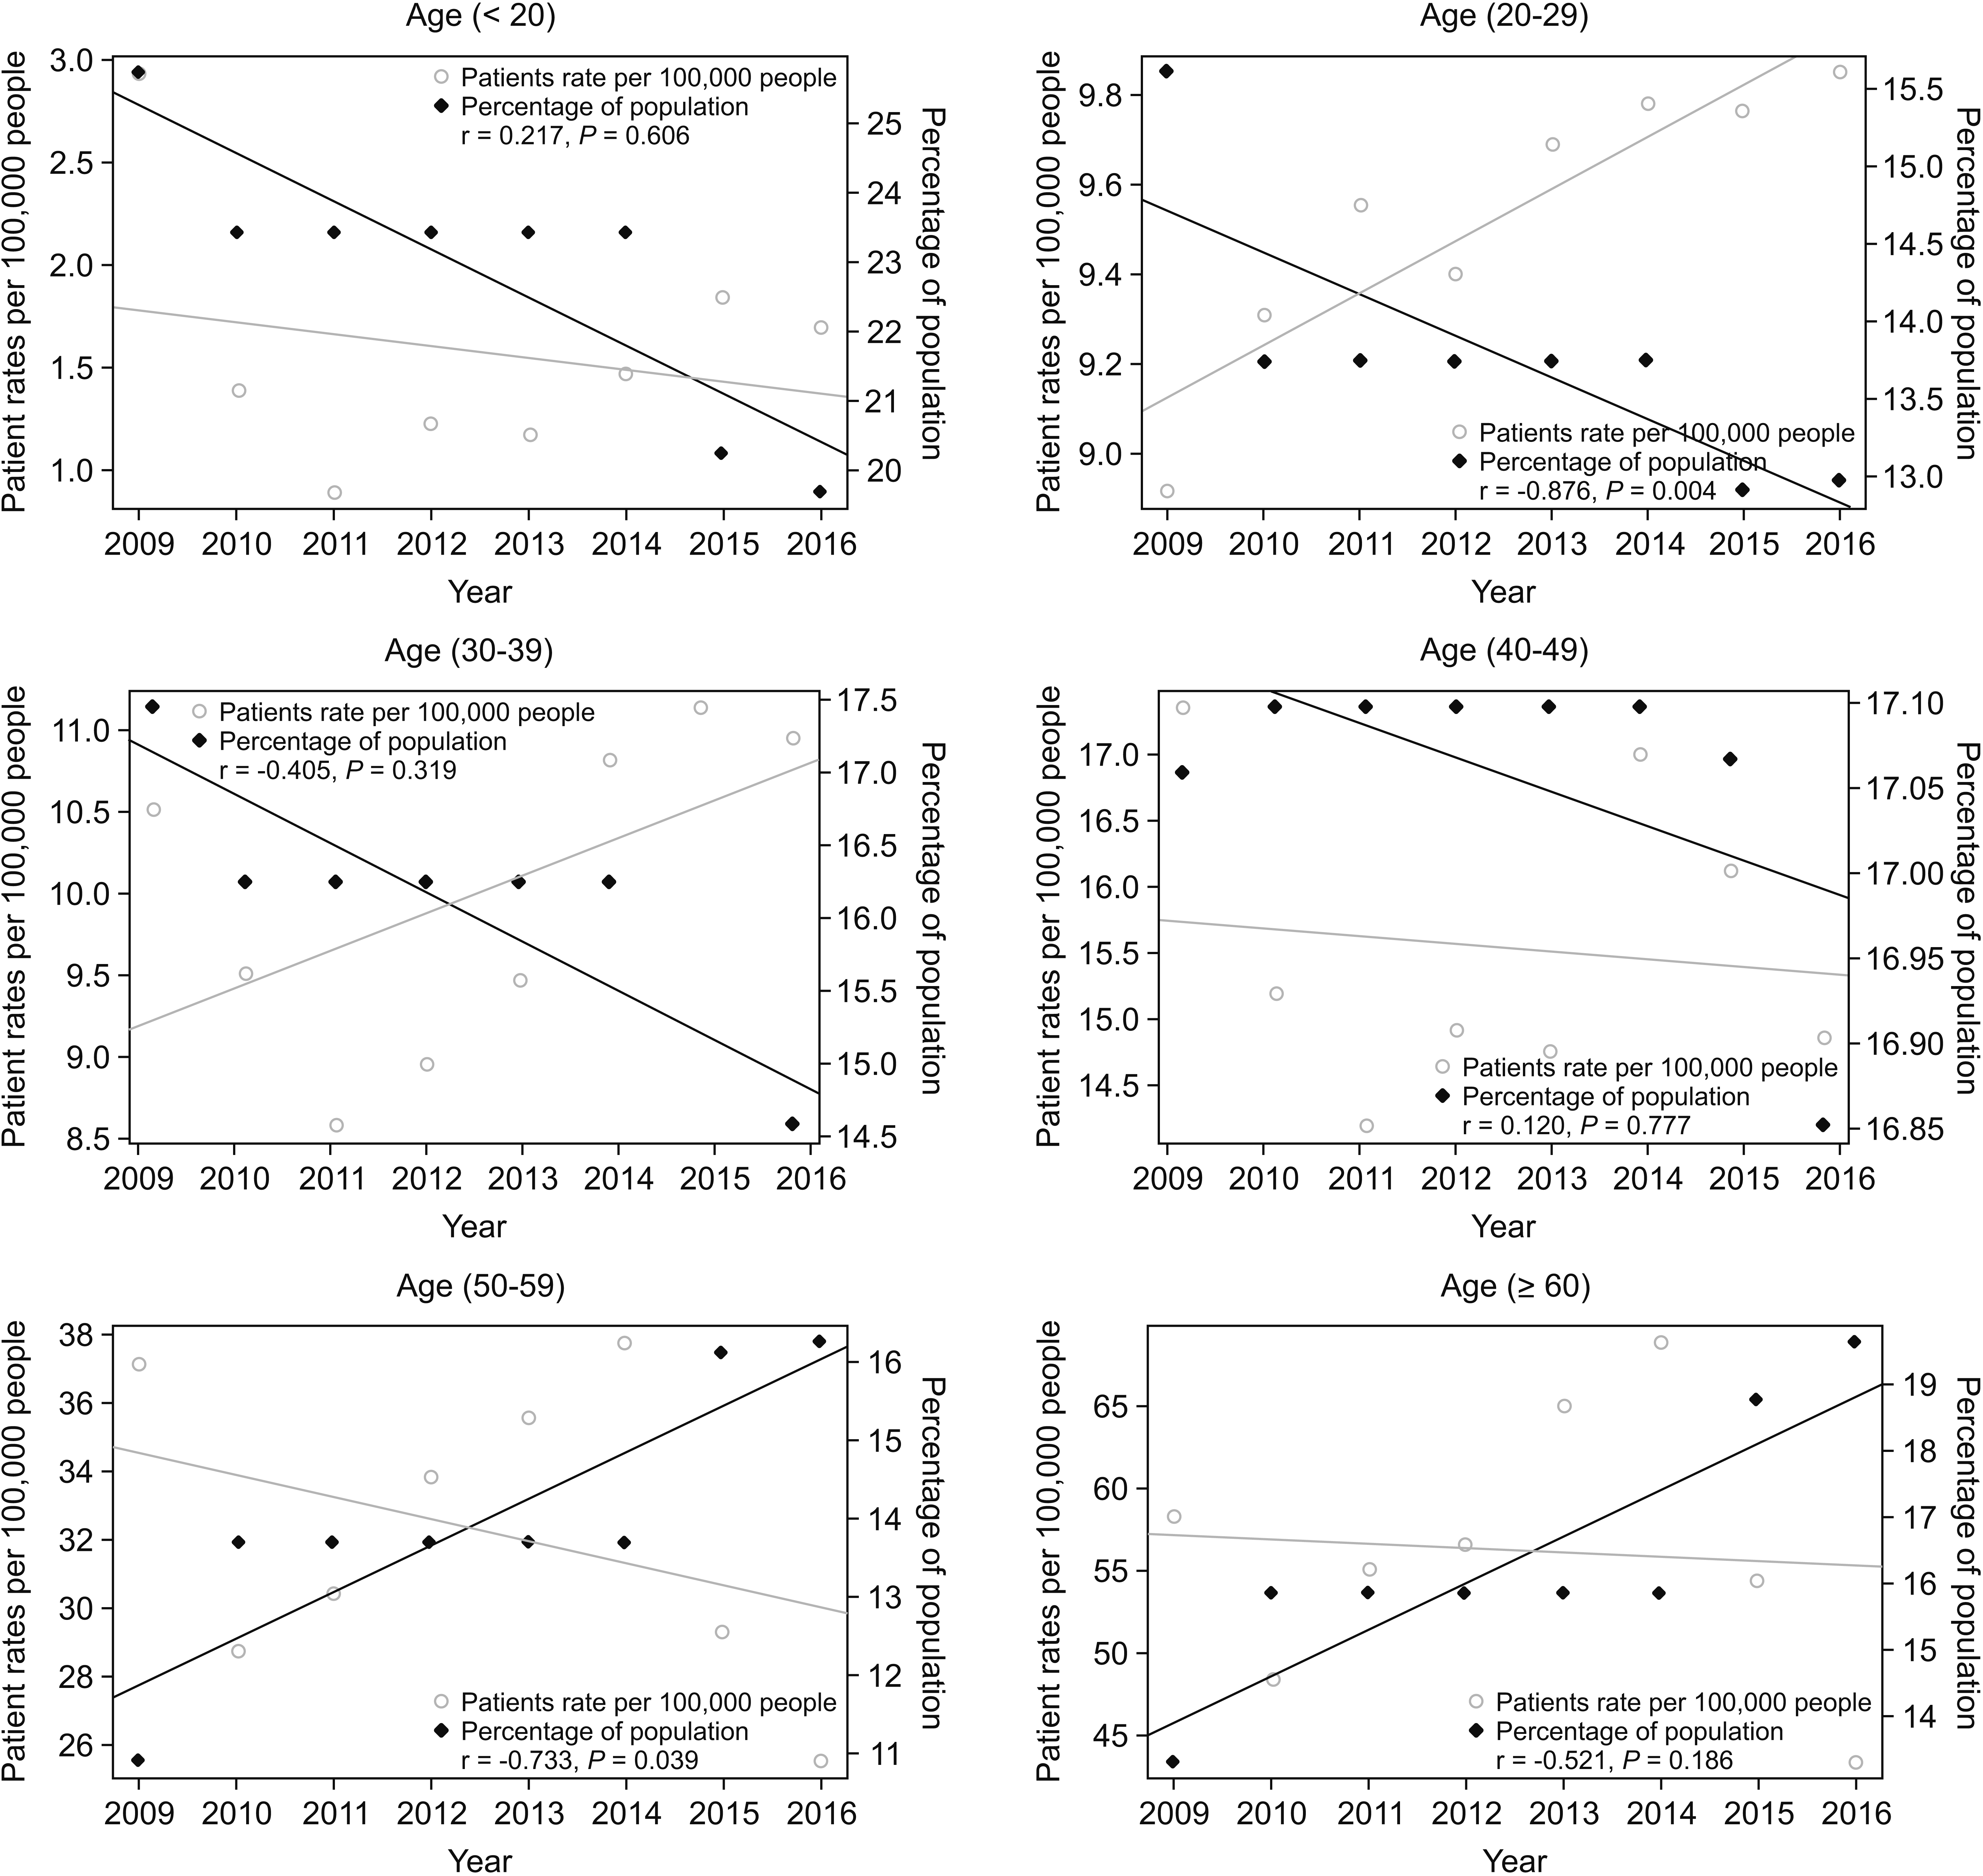
The association between the proportion of patients per 100,000 people and the proportion of population by year for every age group is illustrated in Fig. 3. The purpose of this comparison was to establish how the patient ratio was correlated to population ratio rise and fall for each age group and year. Apart from the 20s and 30s groups, there was a reduction in the patient rate per 100,000 people for any age group. Furthermore, for the 50s age group, there was an increase in the population proportion according to age group and year, whereas for the younger age groups, this proportion declined. This observation can be attributed to aging. Moreover, regarding the association between patient rate and population proportion by year, the under-20s and 40s age groups (r = 0.217, P = 0.606; r = 0.120, P = 0.777) showed a negative association, while the other age groups showed a positive association (r = –0.876, P = 0.004 in 20-29; r = –0.405, P = 0.319 in 30-39; r = –0.733, P = 0.039 in 50-59; and r = –0.521, P = 0.186 in over 60s).
2. CRPS type 2 yearly trend
Over the 2009-2016 research period, there was a decline in the cumulative patient number from 7,975 to 4,428 as well as in the patient rate per 100,000 people from 17.0 to 8.9, irrespective of population (Fig. 1).
Model 1 was associated with a time trend of –0.055 to –1.587, which was of statistical significance aside from the hospital adjustment (time trend = –0.055 [–0.200 to 0.091], P = 0.468). Regarding age, Model 2 indicated a reduction in the proportion of patients per 100,000 people in all age groups (0.57 to 0.25 for under 20; 3.57 to 2.77 for 20s; 5.66 to 4.27 for 30s; 13.32 to 6.2 for 40s; 34.28 to 11.21 for 50s; 69.55 to 25.38 for over 60). Similarly, comparison of the time trend against the under-20s group revealed no discrepancies of statistical significance in the 20s, 30s, and 40s groups (time trend = –0.151 [–1.401 to 1.098], P = 0.814; time trend = –0.255 [–1.505 to 0.994], P = 0.691; time trend = –0.958 [–2.208 to 0.291], P = 0.142, respectively). On the other hand, there was a decline of statistical significance in the 50s and over-60s groups (time trend = –2.695 [–3.945 to –1.446], P < 0.001; time trend = –5.195 [–6.445 to –3.946], P < 0.001). Regarding age, Model 2 revealed a decline in the proportion of patients per 100,00 people for both males and females, from 16.34 to 8.85 and from 17.56 to 8.91, respectively, but the groups showed no time trend discrepancies of statistical significance (time trend = –0.178 [–0.462 to 0.105], P = 0.238). Regarding medical institutions, the findings produced by Model 2 were identical to those of Model 1. There was a decline in the proportion of patients per 100,000 people for all medical institutions considered (from 3.61 to 3.54 in tertiary hospital; from 2.23 to 3.13 in general hospitals; from 2.46 to 1.43 in clinics, and from 10.44 to 10.28 in others). Furthermore, no discrepancy of significance was found among the groups when the time trend was compared with the tertiary hospital. Meanwhile, discrepancies of statistical significance were uncovered by Model 2 as a result of the comparison of time trends by region. More specifically, there was a reduction from 10.41 to 4.59 for Seoul, from 15.92 to 9.57 for Gyeonggi (time trend = –0.631 [–1.244 to –0.017], P = 0.059), and from 19.72 to 10.03 for others (time trend = –0.985 [–1.599 to –0.371], P = 0.006) (Table 2).
Table 2
The trend for diagnosis of CRPS type 2 according to each group
![]()
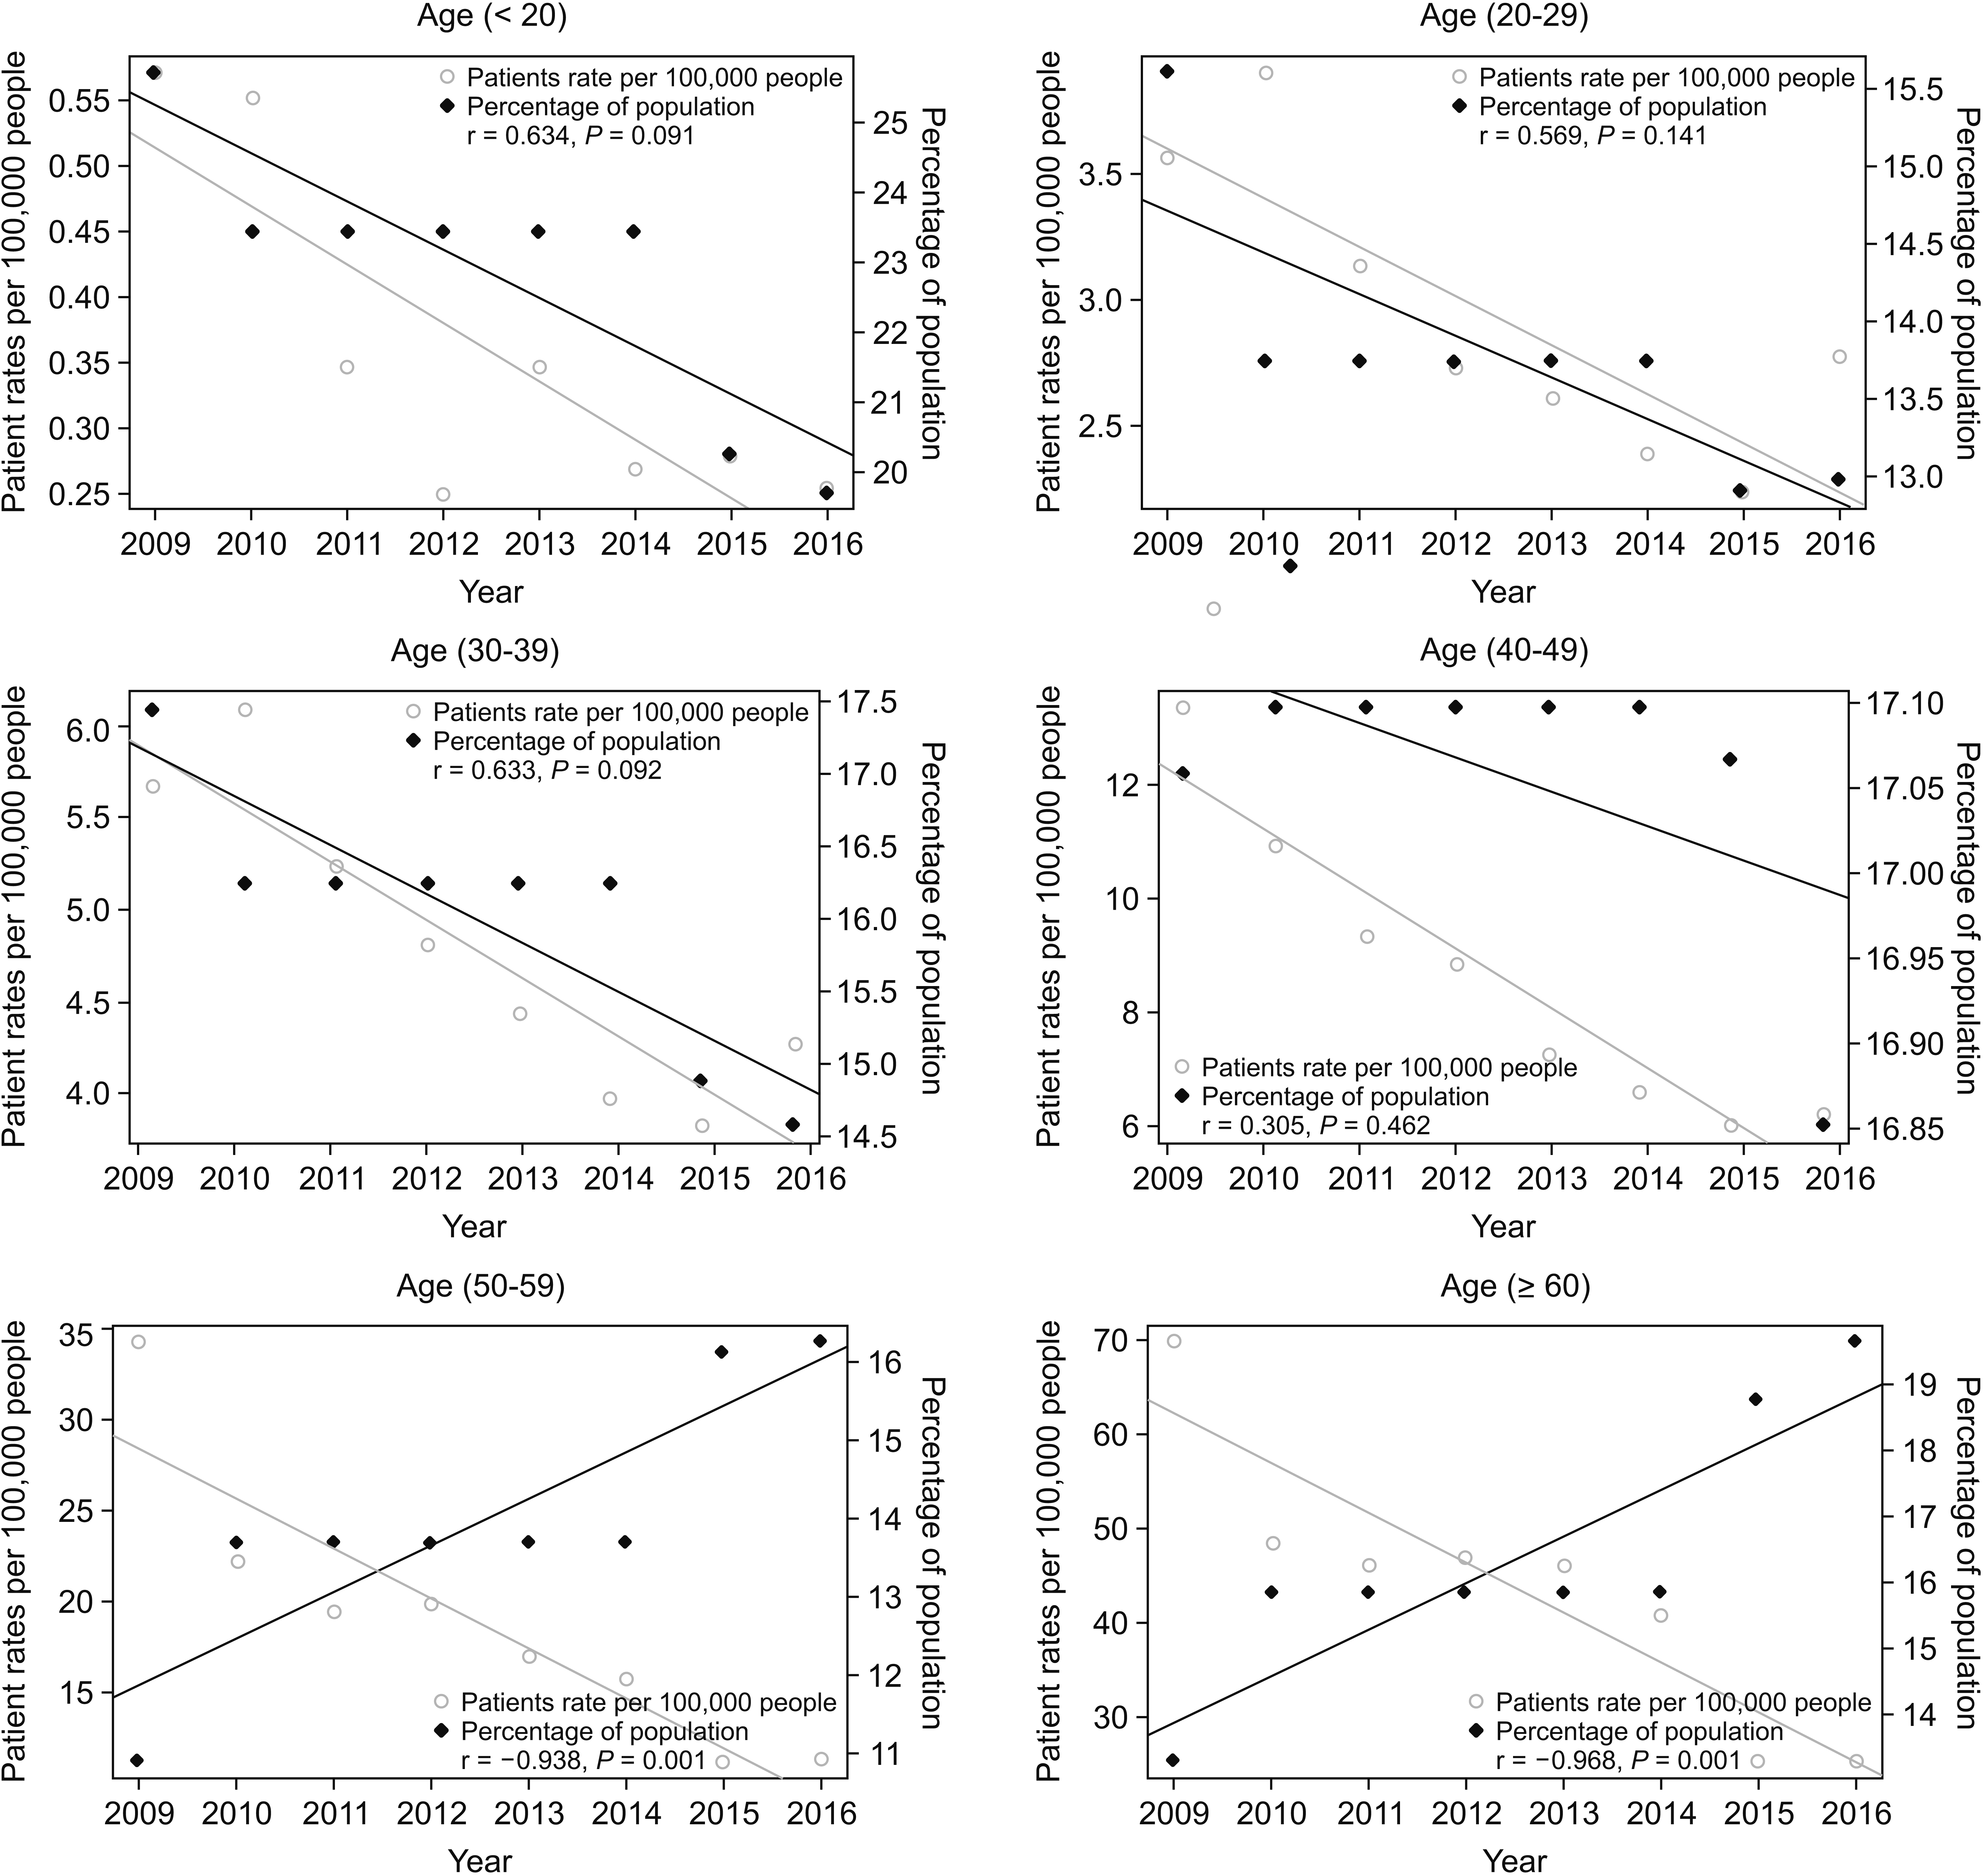
The patterns related to the association between the rate of patients per 100,000 people and the proportion of the population by year, by every age group, are presented in Fig. 4. The purpose of this comparison was to establish how the patient ratio was correlated to population ratio rise and fall for each age group and year. There was a reduction in the patient rate per 100,000 people for every age group. Furthermore, for the 50s age group, there was an increase in the population proportion according to age group and year, whereas for the younger age groups, this proportion declined. This observation can be attributed to aging. Moreover, regarding the association between patient rate and population proportion by year, the under-50s age groups showed a positive association, while the over-50s age groups showed a negative association (r = 0.634, P = 0.091 in under 20; r = 0.569, P = 0.141 in 20-29; r = 0.633, P = 0.092 in 30-39; r = 0.305, P = 0.462 in 40-49; r = –0.938, P = 0.001 in 50-59; and r = –0.968, P = 0.001 in over 60).
Go to :
DISCUSSION
The knowledge of CRPS epidemiology in Korea has so far been suboptimal. The latest available data were either derived from hospital settings or overlooked structural transformations at the population level. Therefore, as far as the author is aware, the present work is the first to employ a purified dataset to understand CRPS epidemiology in Korea, which showed an overall incidence of CRPS as 15.83 per 100,000 in Korea and a declining trend for every age group.
The epidemiology of CRPS has not been extensively researched. Not only is there a lack of knowledge about CRPS pathophysiology, but the characteristics of individuals prone to this condition and the medical interventions available for treatment are also poorly understood. Although there is some sparse data about demographics, little is known about types of patient employment and available condition management strategies. However, there was one study conducted in the United States (US) that addressed such aspects on a sample of 134 consecutive CRPS patients who had received referral to a tertiary hospital pain clinic [16].
As previously mentioned, it seems that the present study is the first to draw on the most extensive electronic population data to investigate CRPS epidemiology in Korea. There was an earlier retrospective study conducted in a single center involving a chart review of 150 CRPS patients, but the findings lacked representativeness of CRPS features in the particular context of Korea [17]. Although the current study does not differ much from previous research [5,8] regarding the gathered epidemiological data, it contradicts earlier results that suggested greater prevalence of CRPS in female individuals [5,9,10]. With a female-to-male ratio of 0.8:1, this study indicates that males are more prone to CRPS than females, especially those in their 20s [18].
Korea is among the countries with accelerated increase in the aging population, which should be taken into account in epidemiological research conducted in this country. Indeed, population aging is an issue worldwide rather than being restricted to Korea, and therefore requires attention to generate more accurate estimates of medical and healthcare costs in the future. Given the singular features of demographics nowadays, the fast aging of the population calls for investigations into how aging is correlated with use and delivery of medical and healthcare services [8]. Furthermore, as the number of aging people grows, so does the costs of healthcare provision [9].
On the one hand, the Korean population is aging fast, while on the other hand, the country’s population growth and birth rate are lower than those of other countries, and there is also accelerated aging of the economic entity. Therefore, Korea constitutes a suitable context for trying to understand what trends of healthcare use will look like in the future [19].
Regarding the incidence rate, the findings of the present study are inconsistent with those of other studies that reported population-based incidence rates for other countries. For instance, studies conducted in the US and the Netherlands obtained an incidence rate of 5.46 and 26.2 per 100,000 person years, respectively [1,2]. By contrast, this study obtained a general incidence rate for CRPS of 16.83 per 100,000 person years, which is comparable to that reported by Kim et al. [17]. It is not completely clear why the data from Korea differs from those in other countries, but it can be suggested that it may be related to the use of distinct diagnostic criteria, which could distort results. However, there is no information about the criteria applied to diagnose CRPS in every case in Korea. Other possible reasons could be differences in the risk factors and socio-economic aspects impacting CRPS development in Korea as well as discrepancies among healthcare systems and the extent and quality of gathered data.
The common consensus is that CRPS is more prevalent among females than males and its incidence rise with age [2,3]. Despite certain proportional discrepancies, this study supports the notion of greater prevalence among females. On the other hand, the results obtained indicated that incidence increased with age, although a notable discrepancy emerged when demographic changes were considered. More specifically, it was found that the 20s age group was associated with the highest incidence rate rise, an observation that no other study has made. Only one small retrospective study was done among young Korean patients [20]. Unfortunately, the absence of comparative analyses prevents the formulation of a precise explanation, so further research is needed. Nevertheless, it can be stated with certainty that earlier studies failed to take into consideration age structure transformations.
This study corroborates the fact that CRPS type 1 is predominant, as reported by the majority of earlier studies, but the proportion discrepancies found by this study were not as pronounced as those from studies conducted in other countries. For example, the proportion of CRPS type 1 was over six times higher in the US, while the proportion of CRPS type 2 was just 2.9% in the Netherlands. Comparable findings were reported by a previous study undertaken in Korea [17].
No definitive conclusion about CRPS incidence can be drawn, as reported results vary significantly, from 5.5 to 26.2 per 100,000 person years in the US [15] and the Netherlands, respectively [5]. Such figures would suggest that 20,000-80,000 people are diagnosed with CRPS annually in the US. Furthermore, there is a linear rise in incidence with age up to 70 years of age, and the condition is 3-4 times more prevalent in females compared to males [5,15].
There are a few shortcomings in the present study. One shortcoming is that, owing to the variability of signs and symptoms, healthcare professionals did not agree on a standard approach to CRPS treatment in Korea. The negative outcomes of the impartial tests notwithstanding, CRPS diagnosis was frequently informed only by healthcare professionals’ interpretation of the subjective symptoms reported by patients. Another shortcoming is that the study adopted a retrospective research design based on the HIRA database. Since systems were not connected over the whole range of medical services, it could have been possible to include follow-up losses and diagnoses from more than one medical resource. However, the study did not include more than one claim from each patient. An additional shortcoming is that the study disregarded precedent, psychological factors, and comorbidities due to the imprecise nature of the information reported by the patients. Thus, more epidemiological research must be conducted to overcome such shortcomings.
The author believes that the general CRPS incidence rate in this study could, in reality, be lower than estimated. As previously indicated, CRPS diagnosis is often based on physicians’ clinical experience rather than qualified criteria, which could yield a higher number of “rare disease” patients than is actually the case. Furthermore, individuals diagnosed with a “rare disease” can access extra assistance via the singular system of national insurance in Korea. Consequently, major social issues like inequality and misuse of capital could arise.
In spite of the observations outlined above, the author considers that the incidence rate has not been overestimated due to the lack of homogeneous patient classification. The author requested that every case be confirmed again by general practitioners to ensure the accuracy of the original diagnosis. Furthermore, nearly three-quarters of patients received referral to a medical specialist to validate the diagnosis once alternative diagnoses were eliminated. There was variation in the real incidence rates according to whether the CRPS diagnosis was confirmed by general practitioners or by specialists, but the incidence rate trend in terms of sex and age distribution did not differ much. It is actually contended that the real incidence rate is higher than the one found in this study because, despite applying a sensitive search algorithm to identify CRPS cases, cases with undiagnosed signs, due to lack of general practitioner awareness, might have been overlooked. It is likely that the study left out relatively mild and self-limiting CRPS cases that were not documented.
To summarize, the CRPS incidence rate in Korea was investigated in this study over a period of eight years based on data from a national registry, taking into account population structure transformations. It was found that CRPS incidence was 15.83 per 100,000 population out of the overall number of 122,210 patients, with type 1 having an incidence of 19.5 and type 2 having an incidence of 12.1. Both types of CRPS were more prevalent in patients older than 60 years of age, regardless of sex, which showed a negative association with aging shift phenomenon. However, it is necessary to conduct more research that can include data overlooked in this study, and that can explore underpinning causes and discrepancies related to social and economic factors. At the same time, future research should seek to integrate criteria for diagnosis at a national level.
Go to :
 XML Download