Journal List > Korean J Pain > v.34(3) > 1159275

You, Qin, Li, Li, Zhao, and Li: A meta-analysis on advantages of peripheral nerve block post-total knee arthroplasty

Abstract

Background

Postoperative pain management is crucial for patients undergoing total knee arthroplasty (TKA). There have been many recent clinical trials on post-TKA peripheral nerve block; however, they have reported inconsistent findings. In this meta-analysis, we aimed to comprehensively analyze studies on post-TKA analgesia to provide evidence-based clinical suggestions.

Methods

We performed a computer-based query of PubMed, Embase, the Cochrane Library, and the Web of Science to retrieve related articles using neurothe following search terms nerve block, nerve blockade, chemodenervation, chemical neurolysis, peridural block, epidural anesthesia, extradural anesthesia, total knee arthroplasty, total knee replacement, partial knee replacement, and others. After quality evaluation and data extraction, we analyzed the complications, visual analogue scale (VAS) score, patient satisfaction, perioperative opioid dosage, and rehabilitation indices. Evidence was rated using the Grading of Recommendations Assessment, Development, and Evaluation approach.

Results

We included 16 randomized controlled trials involving 981 patients (511 receiving peripheral nerve block and 470 receiving epidural block) in the final analysis. Compared with an epidural block, a peripheral nerve block significantly reduced complications. There were no significant between-group differences in the postoperative VAS score, patient satisfaction, perioperative opioid dosage, and rehabilitation indices.

Conclusions

Our findings demonstrate that the peripheral nerve block is superior to the epidural block in reducing complications without compromising the analgesic effect and patient satisfaction. Therefore, a peripheral nerve block is a safe and effective postoperative analgesic method with encouraging clinical prospects.

INTRODUCTION

Total knee arthroplasty (TKA) is the most effective treatment for end-stage knee osteoarthritis and rheumatoid arthritis [1]. During the early post-TKA period, 60% and 30% of patients experience severe and moderate pain, respectively [2]. Postoperative pain affects the patient’s physiological state, rest and sleep, triggers anxiety, increases the risk of complications (including venous thrombosis and pneumonia), affects postoperative efficacy and functional recovery, prolongs hospital stays, increases medical costs, and reduces patient satisfaction and early-stage quality of life [3-5].
Increasing attention is being paid to post-TKA pain relief. The traditional patient-controlled analgesia, using morphine, often involves many opioid-related side effects. Epidural analgesia and peripheral nerve block are two additional commonly used methods for post-TKA analgesia. An epidural block effectively reduces the intraoperative use of analgesic and opioid drugs. However, the drugs used for such block have a high incidence of complications, including nausea/vomiting, dizziness, itching, and urinary retention. Moreover, they have a high risk of inducing severe neurological complications [6]. Zinkus et al. [7] proposed that the femoral nerve block has a good post-TKA analgesic effect, and is helpful to patients in achieving early functional recovery. Runge et al. [8] showed that the obturator nerve block could significantly relieve postoperative chronic knee pain. Some studies have shown that the adductor nerve block could be used to relieve pain in patients after TKA. Its analgesic effect is similar to that of the femoral nerve block, but it does not affect the quadriceps femoris muscle strength as much as the femoral nerve block does [9,10].
Previous studies have reported that the epidural block is clinically superior to the peripheral nerve block in reducing pain [11]. Contrastingly, other studies have demonstrated that the peripheral nerve block had superior clinical efficacy compared to the epidural block [12,13]. We accumulated data from the included 16 randomized controlled trials, and compared the clinical outcomes between the peripheral nerve block and epidural block for post-TKA, aiming for a more comprehensive understanding of the differences in efficacy between them. The clinical outcomes included complications, visual analogue scale (VAS) score, patient satisfaction, perioperative opioid dosage, and rehabilitation indices.

MATERIALS AND METHODS

This meta-analysis was performed following the Preferred Reporting Items for Systematic Reviews and Meta-Analyses (PRISMA) statement [14]. We registered our study in the International Prospective Register of Systematic Reviews (CRD42020163406) on April 28, 2020. All analyses were based on previous published studies; thus, no ethical approval and patient consent are required.

1. Search methods for study identification

The search strategy was formulated following the standards of the Cochrane collaboration. We performed a manual online search through PubMed, Embase, Cochrane, and the Web of Science databases, to retrieve related studies, using the following search terms: nerve block, nerve blockade, chemodenervation, chemical neurolysis, peridural block, epidural anesthesia, extradural anesthesia, total knee arthroplasty, total knee replacement, partial knee replacement, and others. The search also used Boolean operators.

2. Eligibility criteria

1) Inclusion criteria

We used the following inclusion criteria:
  • Studies involving patients with post-TKA in American Society of Anesthesiologists (ASA) categories I-III, without restrictions for age, race, or nationality.

  • Studies involving an experimental group that underwent peripheral nerve blocks (femoral, femoral + tibial, adductor canal, and so on) and a control group that underwent epidural blocks. The primary anesthesia could be simple general, simple spinal, or general + spinal.

  • Randomized controlled trials with no language limitations.

  • Studies reporting at least one of the following indicators: postoperative complications (nausea and vomiting, hypotension, urinary retention, pruritus, and sedation), pain score, patient satisfaction, perioperative opioid dosage, and rehabilitation indices.

  • Studies reporting accurate and reliable data that could be transformed into binary or continuous variables to represent each index.

2) Exclusion criteria

We employed the following exclusion criteria:
  • Studies that assessed animals or corpses

  • TKA studies that included knee arthroscopy or hip joint operation and data on the TKA that could not be extracted independently.

  • Case reports, reviews, retrospective studies, or conference papers without full text.

  • Reports with data that could not be extracted or converted into valid data for meta-analysis.

3. Measurement index

1) Primary outcome measures

  • Pain score: Postoperative pain control is the most important outcome indicator. Mild pain allows limited physiotherapy, which in turn contributes to a faster recovery of knee function [15,16]. Severe postoperative pain can induce other complications, including thrombosis, infection, poor activity, and prolonged hospital stay, which increases medical costs [17]. We compared the post-TKA VAS pain score at three postoperative time slots, i.e., 0-12, 12-24, and 24-48 hours. Moreover, pain intensity assessed on a 10-mm VAS.

2) Secondary outcome measures

  • Complications: This is a paramount factor affecting clinical postoperative analgesia, quality of life, and acceptance of the analgesia. Common severe complications include nausea and vomiting, hypotension, urinary retention, pruritus, and sedation.

  • Patient satisfaction: Postoperative patient satisfaction is a major subjective index for measuring the analgesic effect.

  • Perioperative opioid dosage: Opioids are the main drugs used for surgical analgesia, including fentanyl, oxycodone, piritramide, and morphine. However, their serious complications are a concern for clinicians [18,19]. We analyzed the opioids used during and after surgery.

  • Rehabilitation indices: Good analgesic treatment allows patients who undergo TKA, to experience more active rehabilitation treatment. Mistimed functional rehabilitation could influence its eventual clinical efficacy, with some patients having to undergo a secondary release surgery. This causes a heavy burden on the patients and their families. Therefore, rehabilitation indices are major indirect indicators for the effect of analgesia. We analyzed the length of hospital stay and range of active knee flexion.

4. Assessment of the methodological quality

Two researchers (DY and LQ) independently assessed the methodological quality of the included studies and used the Cochrane’s tool [20] to assess their bias risk. Disagreements between the two researchers were resolved by consulting a third researcher (GQZ) to reach a consensus.

5. Data collection

Two researchers (DY and LQ) independently extracted relevant data, using pre-designed standard data extraction forms. Any disagreements were resolved, as mentioned above. In the case of incomplete data in an article, the corresponding author was contacted via e-mail or other means; however, we did not receive any replies. When the standard deviation (SD) was missing and the corresponding author could not be reached, we referred to the article by Hou et al. [21], we used the method described for range or median estimation, or the method described in the Cochrane Handbook for Systematic Reviews of Interventions [22]. The possible SD was estimated from the confidence interval (CI).

6. Statistical analysis

RevMan 5.3 (Cochrane, London, UK) and STATA 14.0 (StataCorp., College Station, TX) software were used for the statistical analysis. This program, by the International Cochrane Collaboration Network, is used to produce and store Cochrane systematic reviews. It is produced and updated by the Nordic Cochrane Center. The I2 test was used to quantify the degree of heterogeneity. The random-effect model was employed when I2 was > 50%, which indicates significant heterogeneity; otherwise, the fixed-effect model was used. The risk ratio (RR) and standardized mean difference (SMD) were used to analyze binary and continuous variables, respectively [23]. The 95% CI estimates and hypothesis test results for each variable are presented on forest plots. When there was significant heterogeneity, a sensitivity analysis was conducted by excluding the studies one-by-one and repeating the analysis. We performed a subgroup analysis based on the different primary anesthetic methods (general anesthesia, spinal anesthesia, and general + spinal anesthesia). Publication bias was assessed using Egger’s test when ≥ 10 studies were included. Finally, the results were graded using the Grades of Recommendations Assessment, Development and Evaluation (GRADE) profile software. Nineteen countries and international organizations, including the World Health Organization, established the GRADE working group, and formally launched the GRADE evidence quality grading and recommendation strength system in 2004. It can be downloaded and installed at no cost from the Cochrane cooperation network (http://www.gradeworkinggroup.org).

RESULTS

1. Search results and characteristics of the selected studies

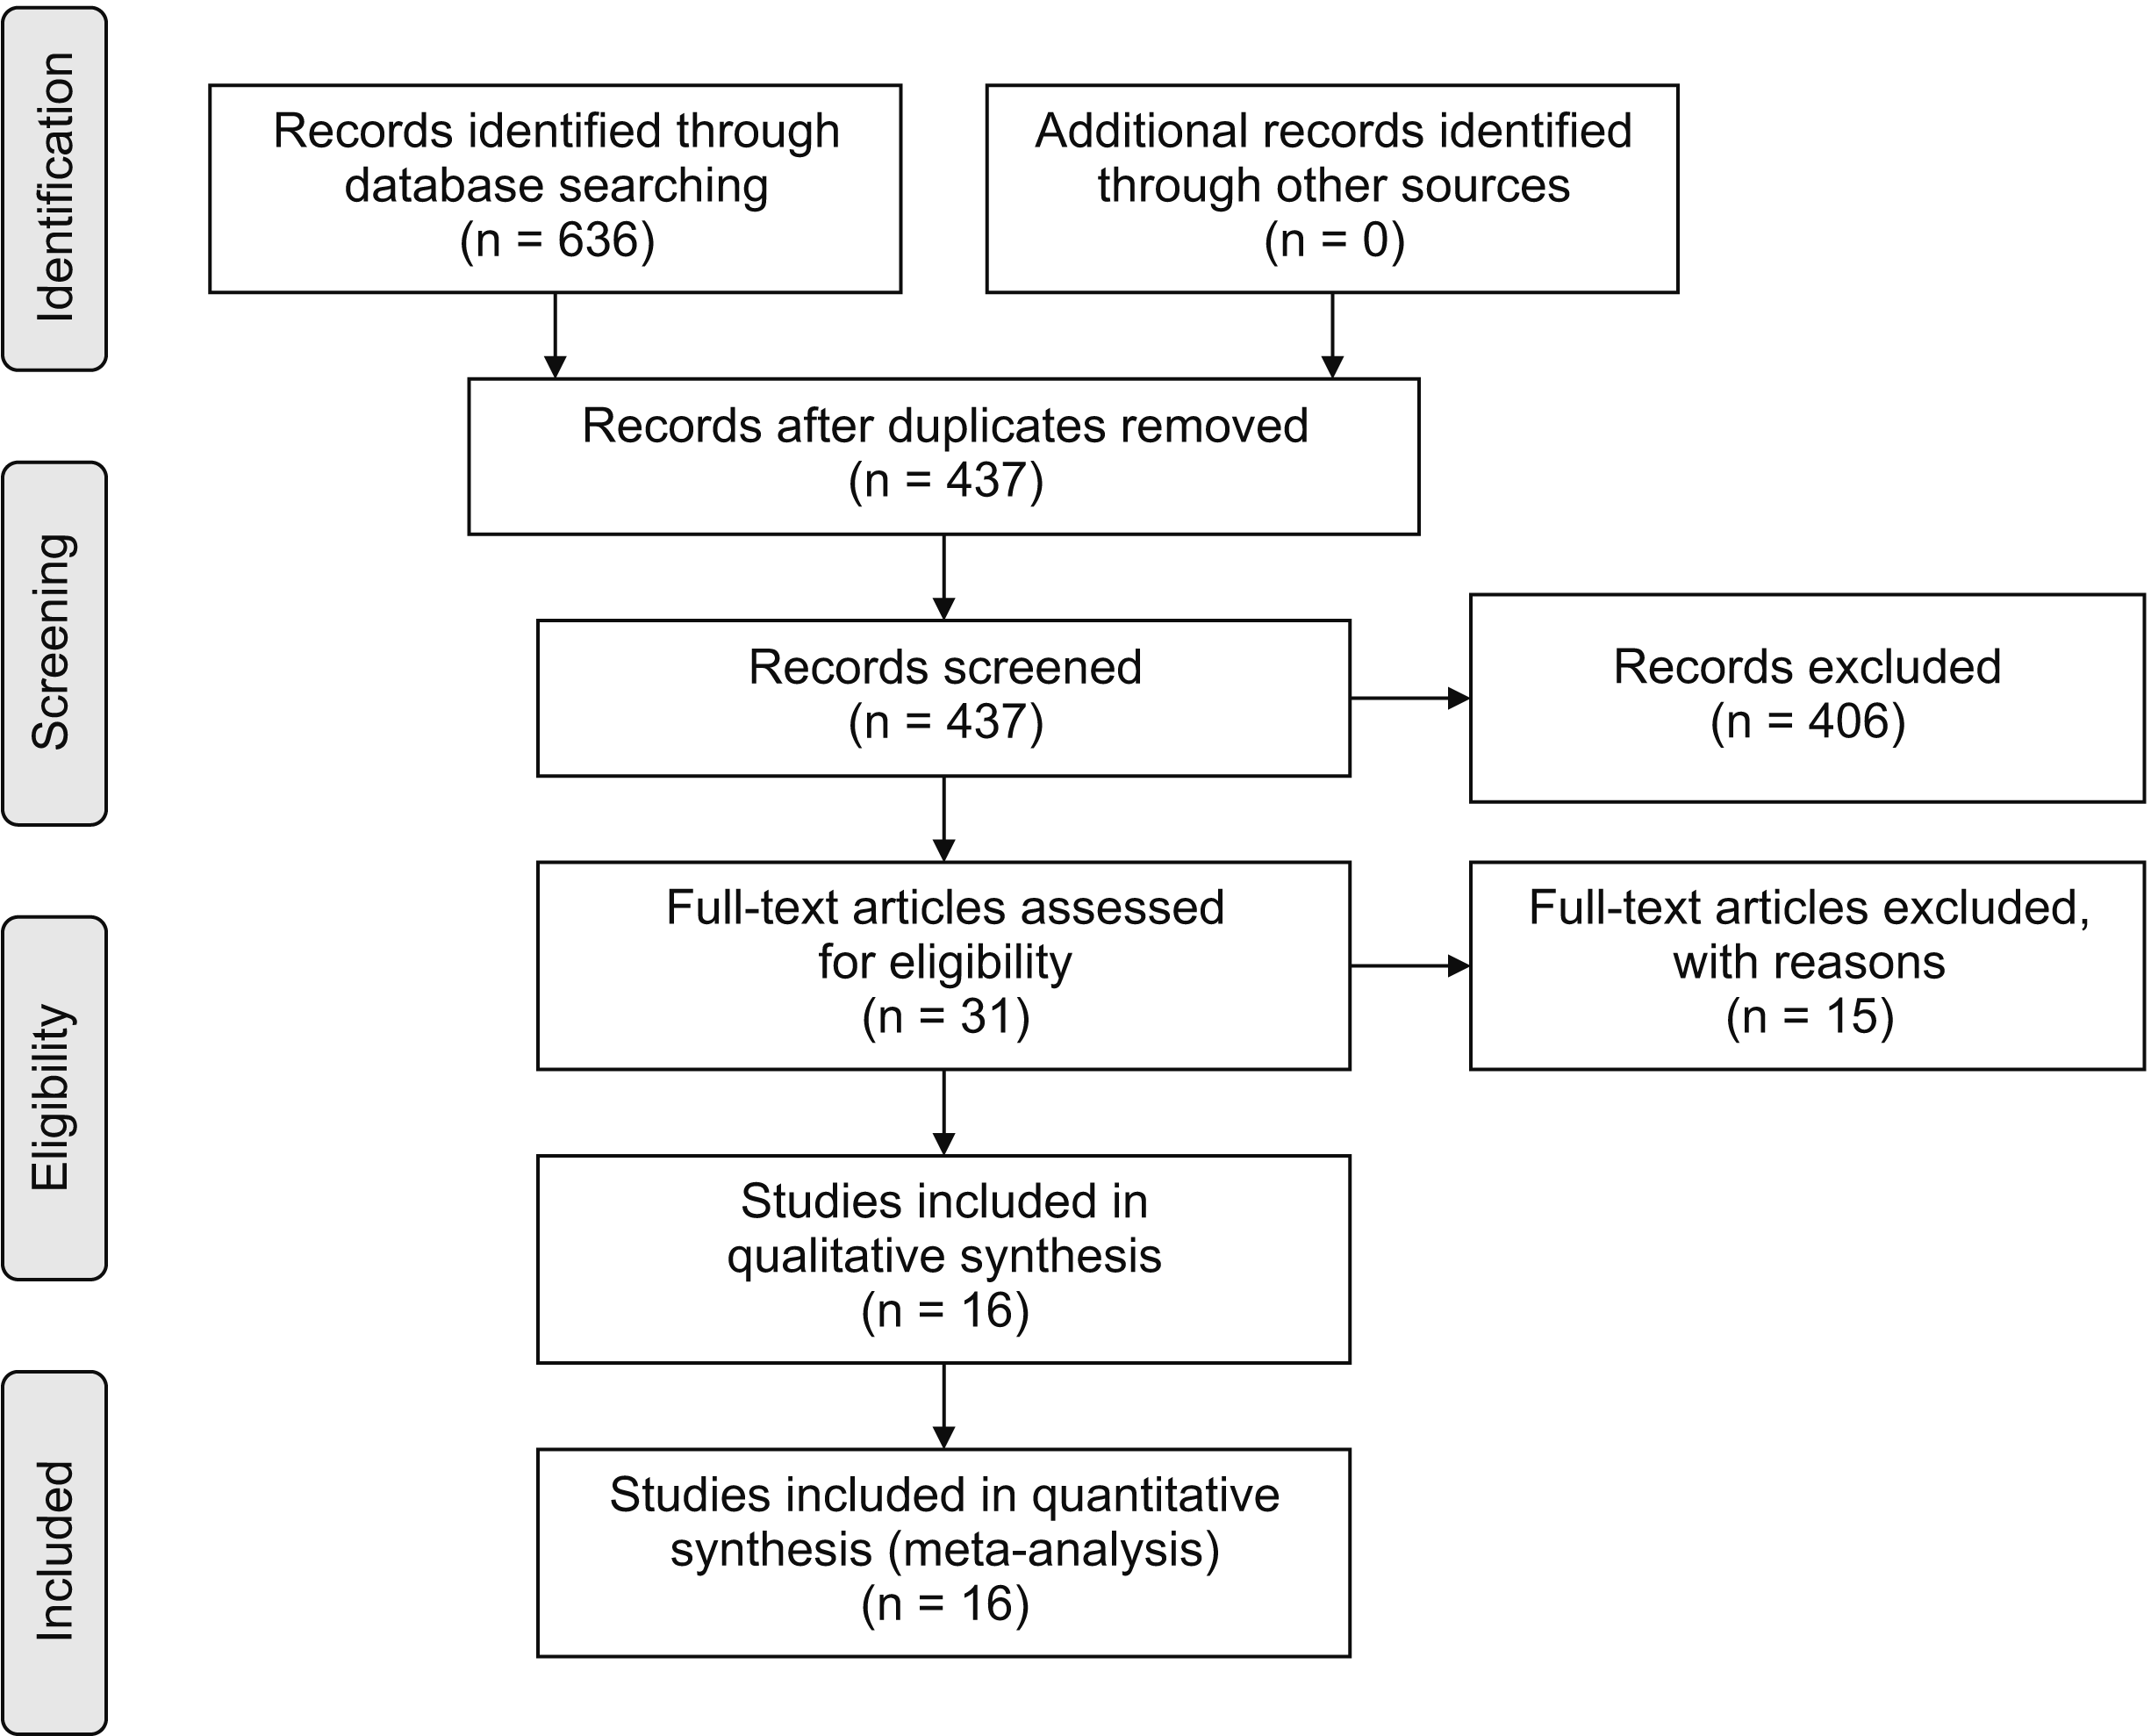
We retrieved 636 studies from the databases using the aforementioned search strategy. EndNote X9 software (Thomson Corp., Stanford, CT) was used to remove duplicates. After reading the titles, abstracts, and full text, we included in the meta-analysis 16 eligible randomized controlled trials that involved 981 patients, 511 in the experimental group, and 470 in the control group (Fig. 1). Table 1 shows the basic characteristics of the included studies. Table 2 shows the baseline demographic and clinical characteristics of the studied population.

2. Methodology evaluation

Fig. 2 shows the risk bias evaluation of the selected 16 randomized controlled trials.

3. Clinical outcomes

1) Adverse effects

(1) Nausea and vomiting

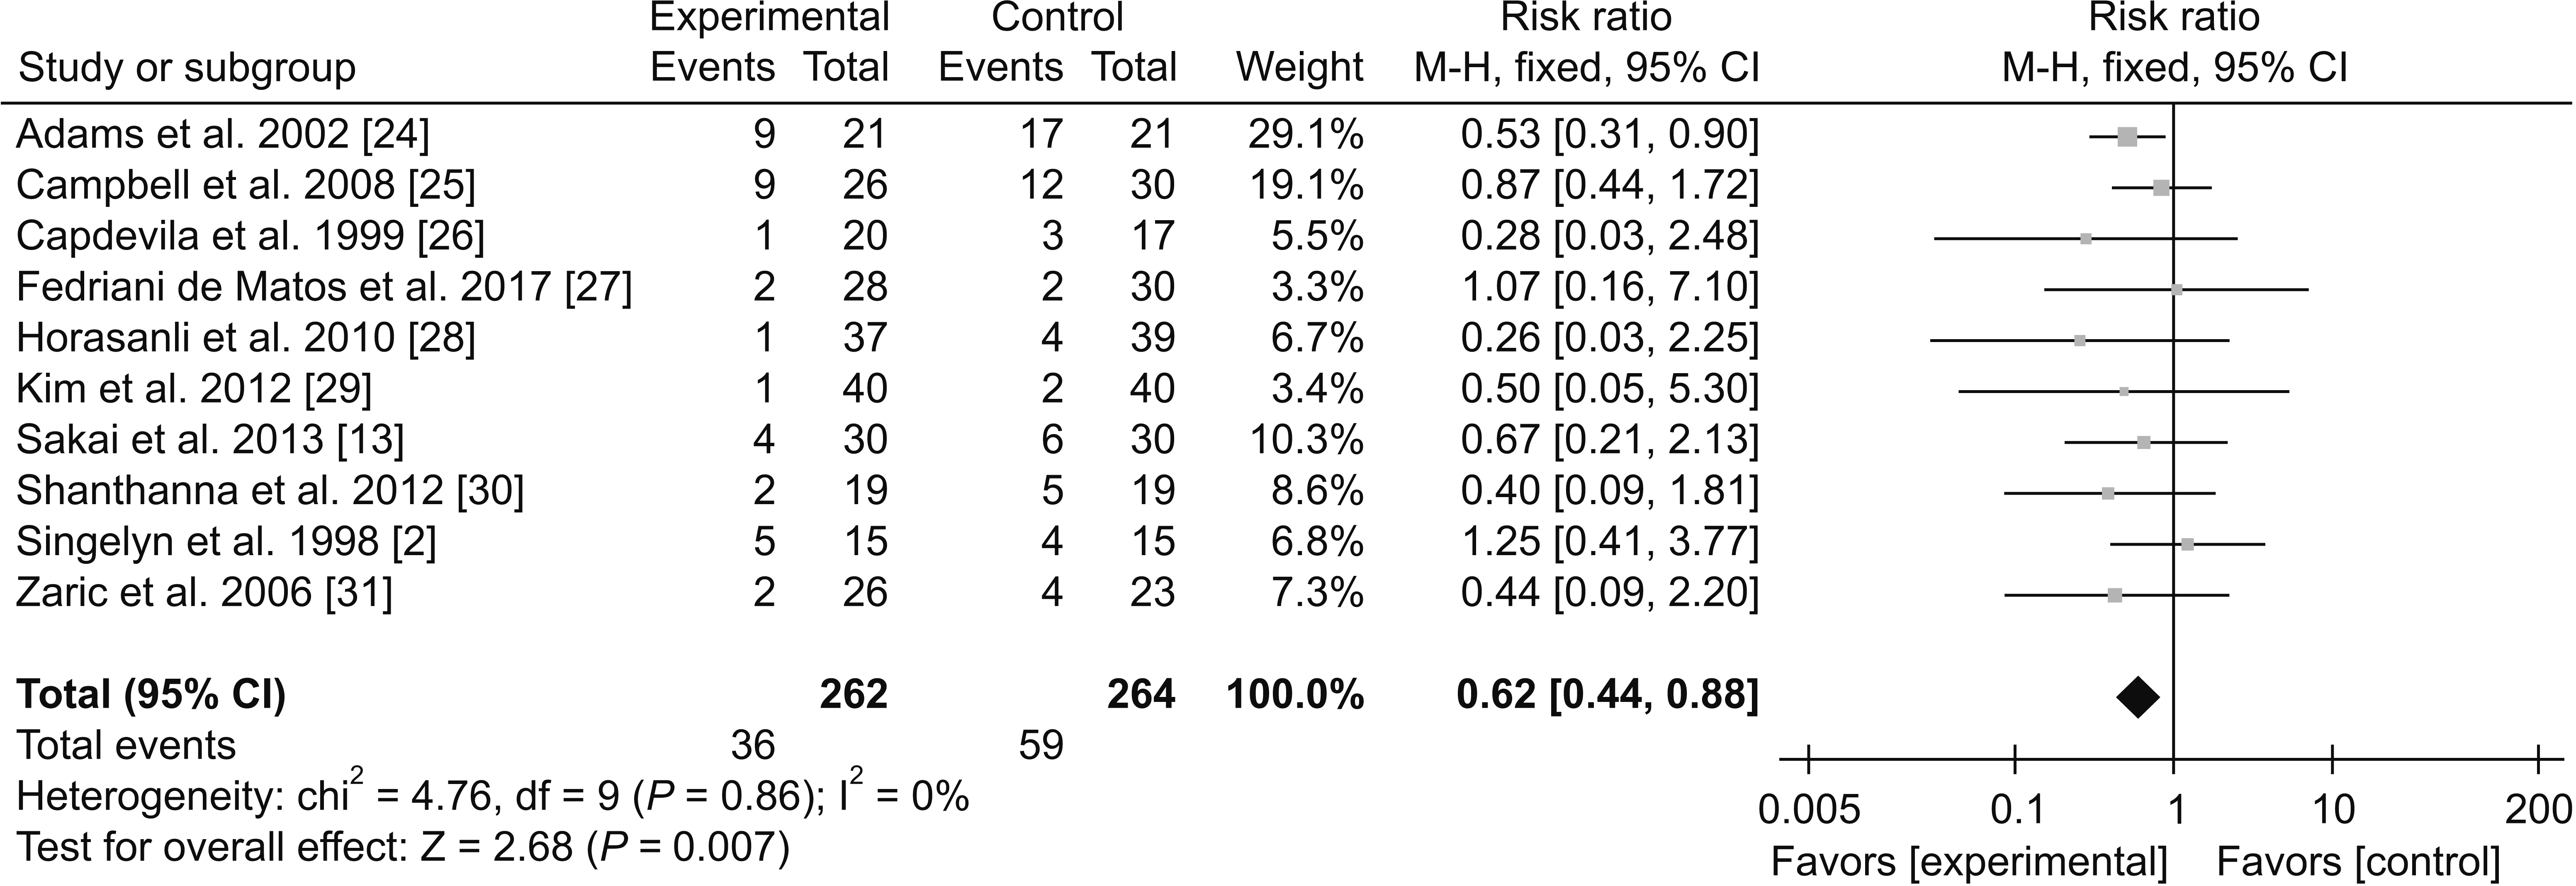
Ten studies [2,13,24-31] involving 526 patients reported on nausea and vomiting. 262 in the experimental group, 264 in the control group. There was no among-study heterogeneity (I2 = 0%, P = 0.86); therefore, the fixed-effect model was used. The experimental group had a significantly lower incidence of nausea and vomiting than the control group (RR = 0.62, 95% CI [0.44 to 0.88], P = 0.007) (Fig. 3). Table 3 presents Egger’s test results (P = 0.448, 95% CI [–3.25 to 1.58]), which shows no obvious publication bias. The quality of the evidence was determined as being of a high grade by the GRADE Profile (Supplementary Table 1).

(2) Hypotension

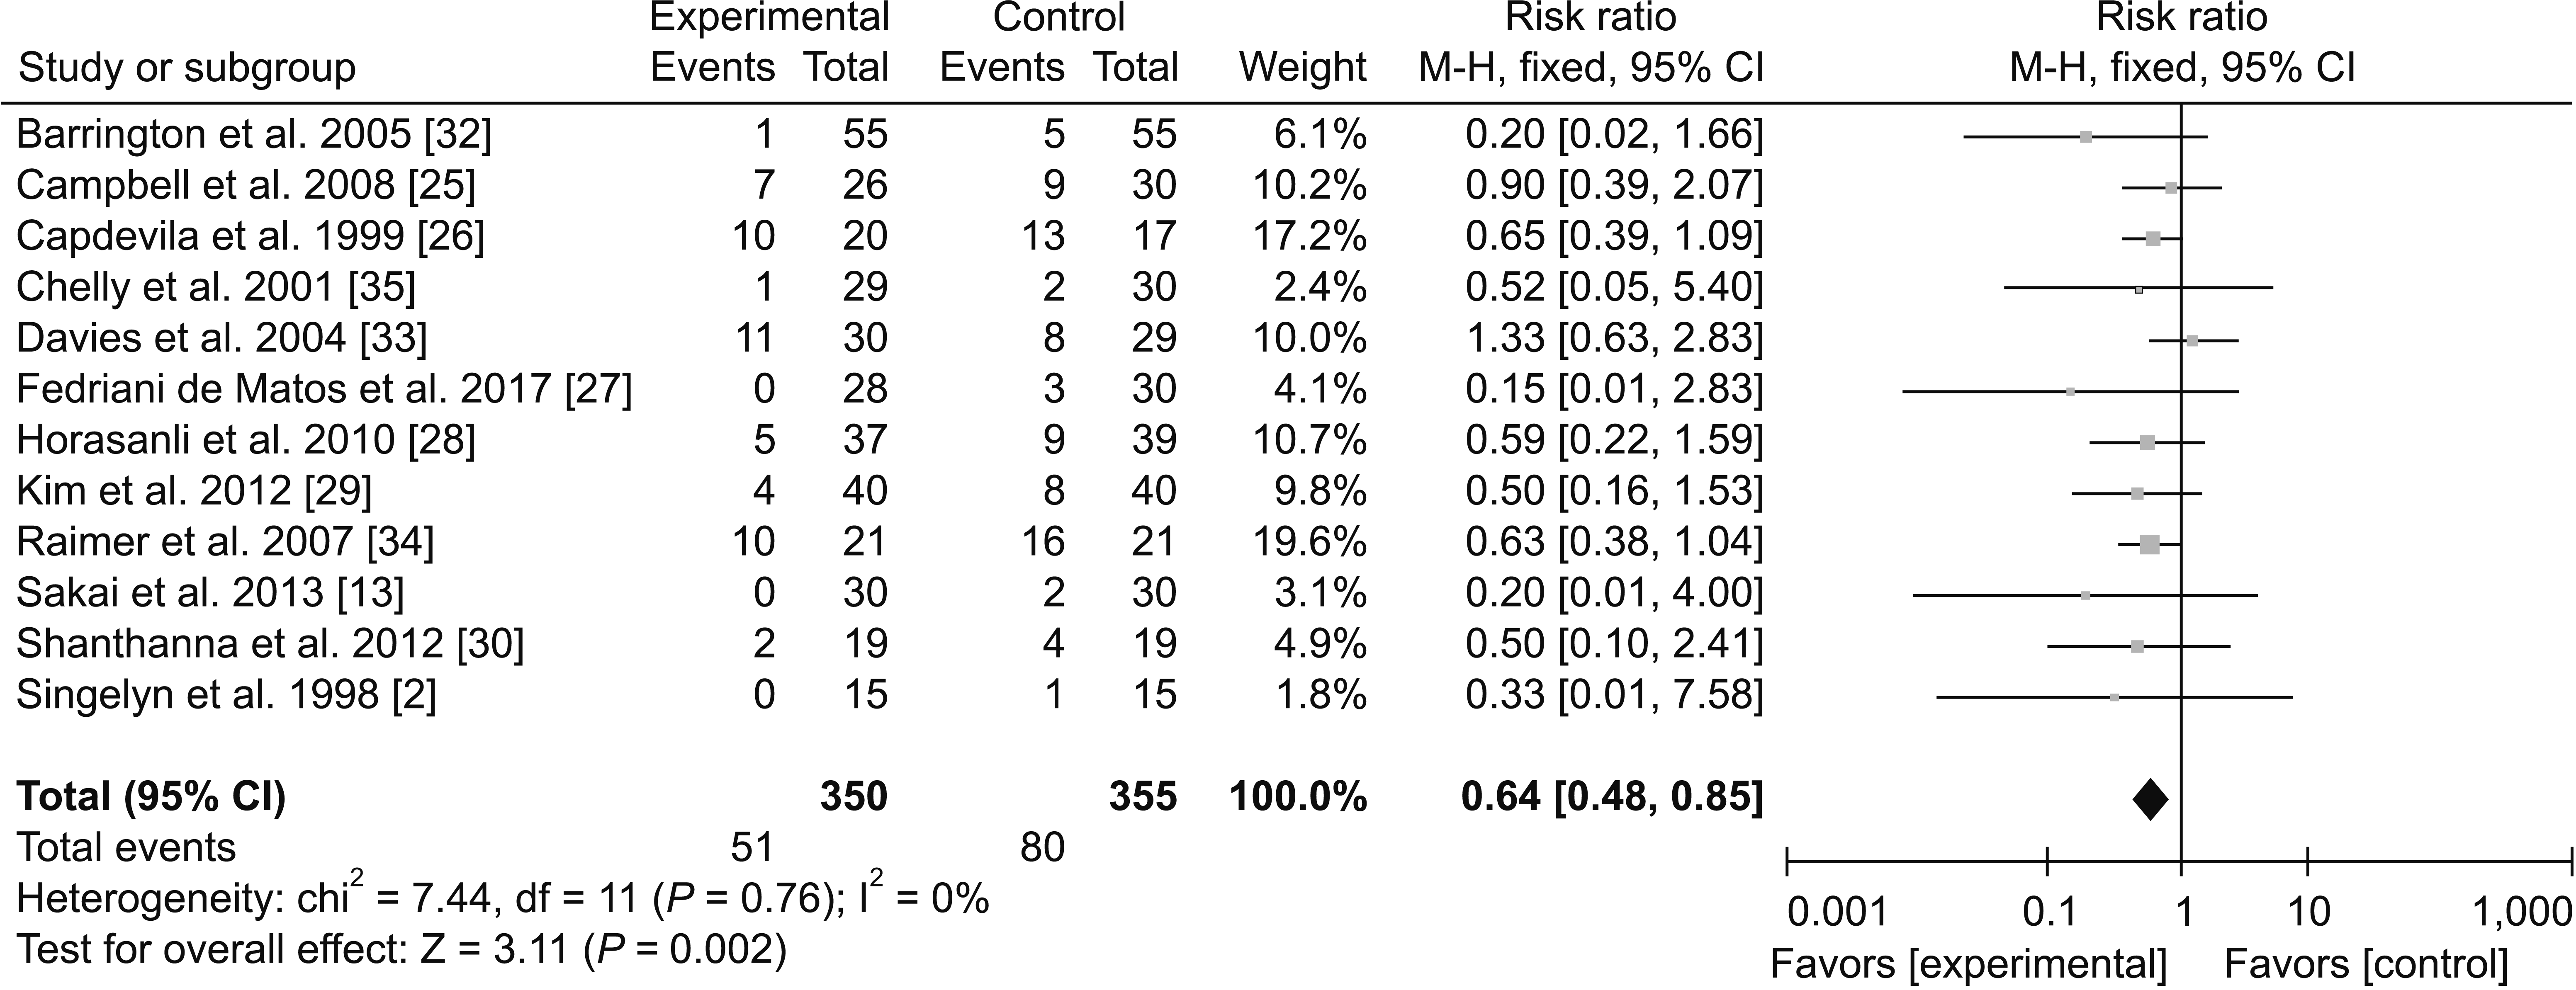
Twelve studies [2,13,25-30,32-35] involving 705 patients reported on hypotension, with 350 in the experimental group, and 355 in the control group. There was no among-study heterogeneity (I2 = 0%, P = 0.76); therefore, the fixed-effect model was used. The experimental group had a significantly lower incidence of hypotension than the control group (RR = 0.64, 95% CI [0.48 to 0.85], P = 0.002) (Fig. 4). Table 4 presents Egger’s test results (P = 0.069, 95% CI [–2.80 to 0.13]), which shows no obvious publication bias. The quality of the evidence was determined as being of a moderate grade by the GRADE Profile (Supplementary Table 1).

(3) Urinary retention

Eight studies [2,13,25-27,30,31,34] involving 370 patients reported on urinary retention, with 185 in the experimental group, and 185 in the control group. There was no among-study heterogeneity (I2 = 5%, P = 0.39); therefore, the fixed-effect model was used. The experimental group showed a significantly lower incidence of urinary retention than the control group (RR = 0.30, 95% CI [0.17 to 0.53], P < 0.001) (Fig. 5). The quality of the evidence was determined as being of a moderate grade by the GRADE Profile (Supplementary Table 1).

(4) Pruritus

Five studies [26,27,29,31,34] involving 266 patients reported on pruritus 135 in the experimental group, 131 in the control group. There was no among-study heterogeneity (I2 = 0%, P = 0.81); therefore, the fixed-effect model was used. The experimental group showed a significantly lower incidence of pruritus than the control group (RR = 0.14, 95% CI [0.03 to 0.59], P < 0.008) (Fig. 6). The quality of the evidence was determined as being of a moderate grade by the GRADE Profile (Supplementary Table 1).

(5) Sedation

Four studies [26,27,29,31] involving 224 patients reported on sedation, with 114 in the experimental group, and 110 in the control group. There was no among-study heterogeneity (I2= 0%, P = 0.82); therefore, the fixed-effect model was used. There was no between-group difference in the sedation incidence (RR = 2.02, 95% CI [0.32 to 12.92], P = 0.46) (Fig. 7). The quality of the evidence was determined as being of a moderate grade by the GRADE Profile (Supplementary Table 1).

2) VAS score

(1) 0-12 hours

Eight studies [2,24,27,29-31,34,36] involving 389 patients reported on the VAS score within 0-12 hours after the surgery, with 195 in the experimental group, and 194 in the control group. There was among-study heterogeneity (I2= 58%, P = 0.02); therefore, the random-effect model was used. There was no between-group difference in the VAS score (SMD = 0.38, 95% CI [–0.00 to 0.76], P = 0.05) (Fig. 8). Sensitivity analysis revealed that after removing the study by Singelyn et al. [2], I2 was decreased to 0% without changing the conclusion (SMD = 0.21, 95% CI [–0.01 to 0.44], P = 0.57) (Supplementary Fig. 1). Sub-group analysis revealed no between-subgroup heterogeneity (I2 = 20.1%, P = 0.29) (Supplementary Fig. 2). The quality of the evidence was determined as being of a low grade by the GRADE Profile (Supplementary Table 2).

(2) 12-24 hours

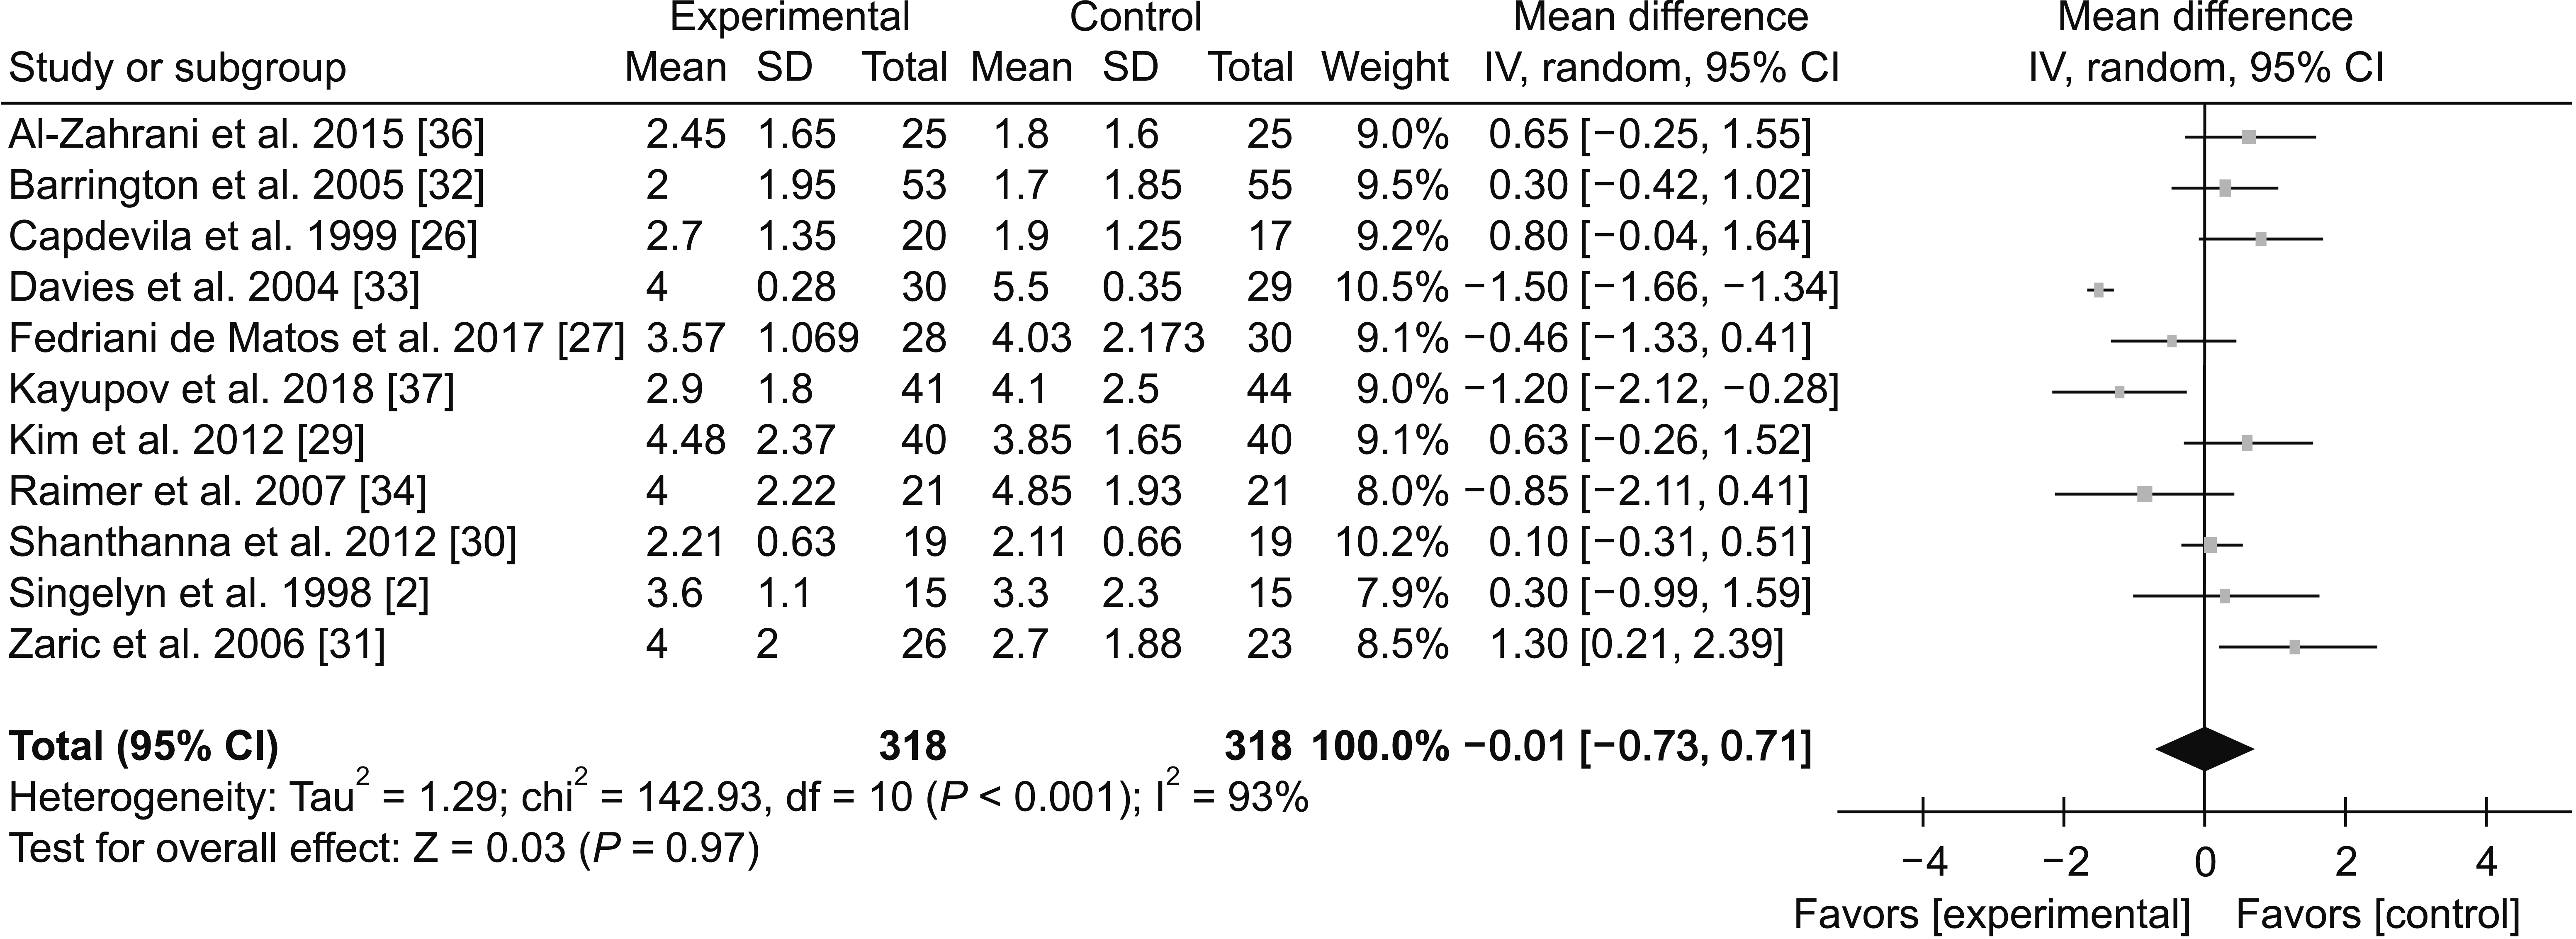
Eleven studies [2,26,27,29-34,36,37] involving 636 patients reported the VAS score within 12-24 hours after the surgery, with 318 in the experimental group, and 318 in the control group. There was among-study heterogeneity (I2 = 93%, P < 0.001); therefore, the random-effect model was used. There was no between-group difference in the VAS score (SMD = –0.01, 95% CI [–0.73 to 0.71], P = 0.97) (Fig. 9). Sensitivity analysis revealed no heterogeneity source, and there was no between-group heterogeneity. The subgroup analysis result was I2 = 0%, P = 0.65 (Supplementary Fig. 3), this indicates that the heterogeneity source was not significantly related to the anesthesia mode, but its source could not be determined. Table 5 presents Egger’s test results (P = 0.851, 95% CI [–7.97 to 9.36]), which shows no obvious publication bias. The quality of the evidence was determined as being of a low grade by the GRADE Profile (Supplementary Table 2).

(3) 24-48 hours

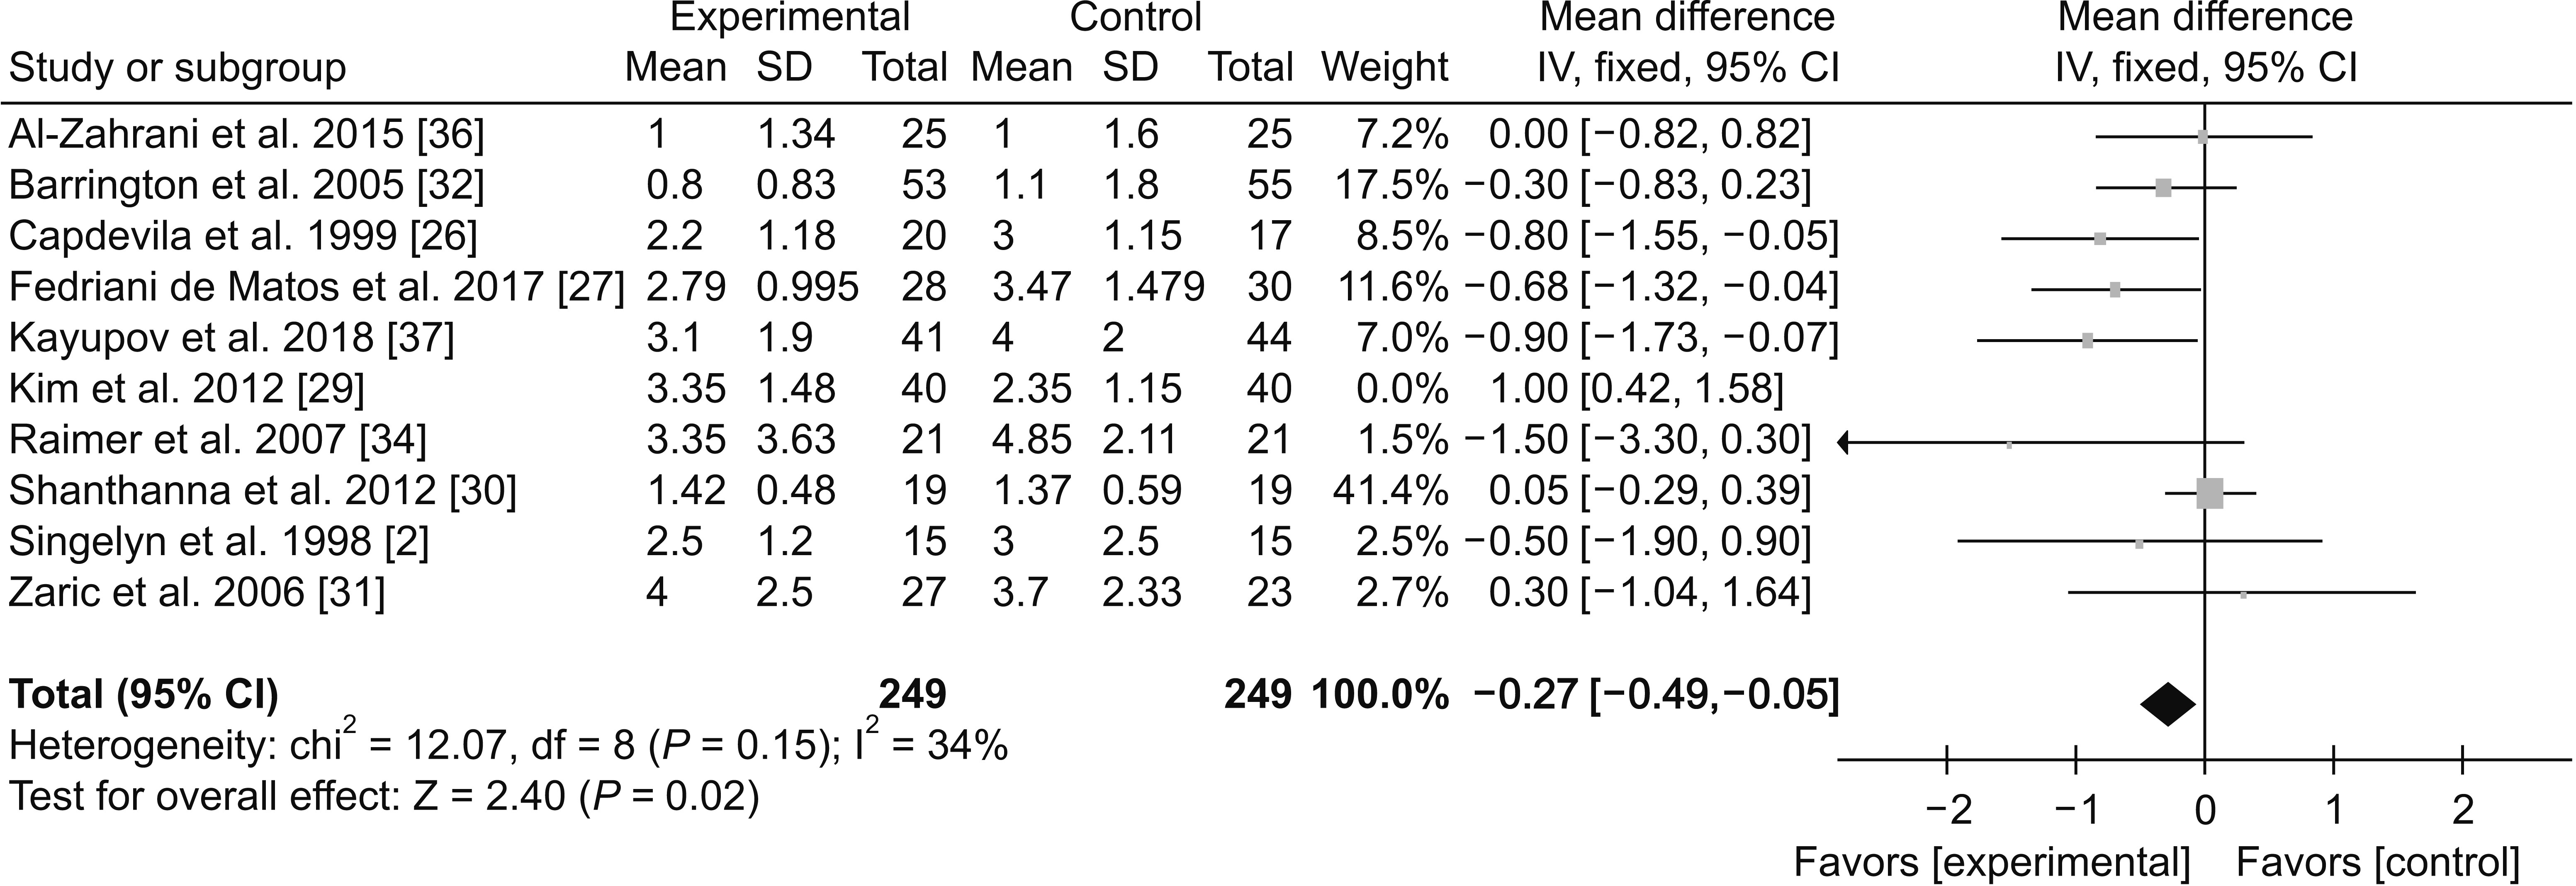
Ten studies [2,26,27,29-32,34,36,37] involving 578 patients reported on the VAS score within 24-48 hours after the surgery, with 289 in the experimental group, and 289 in the control group. There was among-study heterogeneity (I2 = 68%, P < 0.001); therefore, the random-effect model was used. There was no between-group difference in the VAS score (SMD = –0.23, 95% CI [–0.65 to –0.18], P = 0.26) (Supplementary Fig. 4). Sensitivity analysis revealed that after removing the study by Kim et al., [29], I2 decreased to 34%, with the experimental group having a significantly lower VAS score than the control group (SMD = –0.27, 95% CI [–0.49 to –0.05], P = 0.02) (Fig. 10). Subgroup analysis revealed no between-subgroup heterogeneity (I2 = 0%, P = 0.97) (Supplementary Fig. 5). Table 6 presents Egger’s test results (P = 0.186, 95% CI [–118.21 to 69.28]), which shows no obvious publication bias. The quality of the evidence was determined as being of a low grade by the GRADE Profile (Supplementary Table 2).

3) Patient satisfaction

Four studies [27,28,36,37] involving 316 patients reported on patient satisfaction, with 178 in the experimental group, and 138 in the control group. There was no among-study heterogeneity (I2 = 0%, P = 0.69); therefore, the fixed-effect model was used. There was no between-group difference in the patient satisfaction (RR = 1.06, 95% CI [0.94 to 1.18], P = 0.34) (Fig. 11). The quality of the evidence was determined as being of a moderate grade by the GRADE Profile (Supplementary Table 3).

4) Opioid consumption

Seven studies [25,27,31-34,36] involving 534 patients reported the perioperative opioid dosage, with 265 in the experimental group, and 269 in the control group. One study [36] only reported the intraoperative opioid dosage, while three studies [31,33,34] only reported the postoperative opioid dosage. There was significant among-study heterogeneity (I2 = 79%, P < 0.001); therefore, the random-effect model was used. The opioid dosage in the experimental group was insignificantly lower than the control group (SMD = –2.02, 95% CI [–8.4 to 4.36], P = 0.54) (Fig. 12). Sensitivity analysis did not reveal the source of the heterogeneity; moreover, subgroup analysis revealed no between-subgroup heterogeneity (I2 = 0%, P = 0.57) (Supplementary Fig. 6). The quality of the evidence was determined as being of a very low grade by the GRADE Profile (Supplementary Table 4).

5) Length of hospital stay

Six studies [2,25,26,32-34] involving 336 patients reported the length of hospital stay, with 168 in the experimental group, and 168 in the control group. There was among-study heterogeneity (I2 = 66%, P = 0.01); therefore, the random-effect model was used. Hospital stay in the experimental group was insignificantly shorter than in the control group (SMD = –0.31, 95% CI [–0.96 to 0.34], P = 0.35) (Supplementary Fig. 7). Sensitivity analysis revealed that after removing the study by Raimer et al. [34], I2 decreased to 20% without changing the conclusion (SMD = –0.09, 95% CI [–0.45 to 0.27], P = 0.63) (Fig. 13). Subgroup analysis did not indicate between-subgroup heterogeneity (I2 = 0%, P = 0.42), which suggests there is little correlation between the heterogeneity source and the anesthesia mode. The heterogeneity source, however, could not be determined (Supplementary Fig. 8). The quality of the evidence was determined as being of a low grade by the GRADE Profile (Supplementary Table 5).

6) Active knee flexion

Five studies [2,13,30-32] involving 285 patients reported on active knee flexion, with 143 in the experimental group, and 142 in the control group. There was low among-study heterogeneity (I2 = 31%, P = 0.22); therefore, we used the fixed-effect model. There was no between-group difference in the active knee flexion (SMD = 1.81, 95% CI [–1.17 to 4.78], P = 0.23) (Fig. 14). The quality of the evidence was determined as being of a moderate grade by the GRADE Profile (Supplementary Table 5).

DISCUSSION

Our findings show that compared with epidural block, a peripheral nerve block can significantly reduce TKA postoperative complications. The analgesic effect is more distinct 24-48 hours after the surgery compared with the other assessed time slots. Significance differences in patient satisfaction, perioperative opioid dosage, length of hospital stay, and active knee flexion were not found between the two groups. There was low overall among-study heterogeneity, a high level of evidence, and no significant publication bias.
The incidence of postoperative complications is a major index when evaluating the anesthesia protocol. Zaric et al. [31] reported that first day post-TKA, there was an 87% probability of one or more adverse reactions, including nausea and vomiting, sedation, and pruritus. The complications rate was 35% in their experimental group. The present meta-analysis found that the experimental group had a significantly lower incidence of nausea and vomiting, hypotension, urinary retention, and pruritus than the control group. This is consistent with the results reported in several other studies [38-40]. First of all, it may be related to the wide range of epidural blocks [41]; moreover, using large doses of opioids could increase the incidence of nausea and vomiting [42]. Although there was no significant between-group difference in the opioid dosage, a lower dose is expected to lead to fewer side effects.
VAS scores are a common clinical evaluation index. In this meta-analysis, there was a significant between-group difference in the VAS scores only at 24-48 hours after the TKA. This suggests that the peripheral nerve block and the traditional analgesic method exhibit similar postoperative analgesic effects. This is consistent with several previous reports [43,44]. Sensitivity analysis of the VAS score findings at 0-12 hours revealed that the study by Singelyn et al. [2] was the source for the heterogeneity. Singelyn et al. [2] reported only the sample size and ASA grade; therefore, the age range, sex ratio, and body mass index could have contributed to the heterogeneity. Regarding the VAS score measured at 12-24 hours, neither sensitivity nor subgroup analysis could identify the source of heterogeneity; however, we assume that differences in patient selection and anesthetic concentration and dosage could have been major sources of heterogeneity. Upon analysis of the VAS score measured at 24-48 hours, a peripheral nerve block was found to reduce the VAS score after excluding the study by Kim et al. [29]. This could have resulted from the sex ratio in the study by Kim et al. [29], which was quite different from that of the other included studies.
Ritter et al. [45] compared the 5-year effect of TKA between 4,379 female and 2,947 male patients and reported a significantly lower VAS score among male patients. After removing this study from the analysis, there was a relative increase in the proportion of male patients in the experimental group. This change in sex ratio and the lower VAS score among male patients could have contributed to the reduced VAS score.
Several studies [25,30] have reported that the femoral nerve block effect was not optimal during the 24 hours after the surgery since it does not block the sciatic and obturator nerves. Consequently, it was reported that the VAS score in the peripheral nerve block group was significantly higher than that of the epidural block group [37]. Long et al. [46], on the other hand, reported that the analgesic effect of peripheral nerve block was optimal within 24 hours after surgery. In this meta-analysis, there was no between-group difference in the VAS score measured within 24 hours after the TKA, which is consistent with the findings reported by Fowler et al. [39] and Gerrard et al. [40].
Our meta-analysis demonstrates a good analgesic effect from long-acting opioids, including morphine and fentanyl. Other analgesic methods for pain relief during the perioperative period exist. The side effects of opioids, including nausea, vomiting, urinary retention, and respiratory depression, might impede post-TKA patient rehabilitation. Although there was no significant between-group difference in opioid dosage, numerically, the experimental group received a lower opioid dose, which is reflected in the distribution of the side effects. In addition, although there was no between-group difference in patient satisfaction, it was numerically higher in the experimental group.
The ultimate goal of TKA is the postoperative recovery of a functional knee joint. In this meta-analysis, we found that the experimental group had slight but insignificant advantages in the length of hospital stay and active knee flexion. This is consistent with findings in several previous reports [33,46]. The study by Raimer et al. [34] was identified as the source of heterogeneity when analyzing the length of hospital stay. This could be attributed to their discharge policy rather than to the choice of anesthetics.
In this meta-analysis, the peripheral nerve block was found to exhibit advantages in patient satisfaction, perioperative opioid use, and rehabilitation indices. Moreover, it could be more effective than the epidural block in reducing postoperative complications. Importantly, nerve injury was not reported in any of the trials. Therefore, we conclude that peripheral nerve block may be an attractive alternative analgesic technique for knee arthroplasty patients.

1. Strengths and limitation

1) Strengths

This meta-analysis comprehensively evaluated the post-TKA analgesic effect on adverse reactions, VAS score, patient satisfaction, and rehabilitation indices. Moreover, multiple indices were graded at a moderate or high evidence level. This indicates that the results are credible and provide strong evidence for clinical guidance.

2) Limitations

The drug type and dose, as well as the timing of drug use, differed across studies. Such differences could have affected the final index measurement. Moreover, due to the limited number of studies included, this article could only study all peripheral nerve block approaches grouped together. We could not separately analyze each nerve block type, which must have led to deviation of the results. In addition, high heterogeneity was found among studies in some measures, but sensitivity and subgroup analyses could not reveal its source. Finally, this study does not include more “novel” peripheral nerve blocks used for TKA, which reduces the richness of the article.
In conclusion, this meta-analysis compared peripheral nerve block to epidural block as a mode of anesthesia during TKA and for postoperative pain control. For knee joint replacement, a peripheral nerve block can effectively reduce the occurrence of complications and lead to higher patient satisfaction in the postoperative period. The peripheral nerve block shows good performance in all aspects. We performed a sensitivity analysis on its analgesic effect within 24 hours after surgery. Studies were excluded one by one with no change in the heterogeneity, indicating that there was no significant effect for the analgesic approach within 24 hours after the surgery on the analyzed outcomes. More large-scale, high-quality randomized controlled trials are needed to evaluate the optimal anesthetic method for knee joint replacement and draw more precise conclusions.

SUPPLEMENTARY MATERIALS

Supplementary materials can be found via https://doi.org/10.3344/kjp.2021.34.3.271.

Notes

Author contributions: Di You: Writing/manuscript preparation; Lu Qin: Writing/manuscript preparation; Kai Li: Methodology; Di Li: Investigation; Guoqing Zhao: Methodology; Longyun Li: Data curation.

CONFLICT OF INTEREST

No potential conflict of interest relevant to this article was reported.

FUNDING

This study was supported by the Health Research Talent Special Project (No. 2019SCZ026) and Province Science and Technology Development Plan Project (No. 20160101121JC).

REFERENCES

1. Kester BS, Minhas SV, Vigdorchik JM, Schwarzkopf R. 2016; Total knee arthroplasty for posttraumatic osteoarthritis: is it time for a new classification? J Arthroplasty. 31:1649–53.e1. DOI: 10.1016/j.arth.2016.02.001. PMID: 26961087.
crossref
2. Singelyn FJ, Deyaert M, Joris D, Pendeville E, Gouverneur JM. 1998; Effects of intravenous patient-controlled analgesia with morphine, continuous epidural analgesia, and continuous three-in-one block on postoperative pain and knee rehabilitation after unilateral total knee arthroplasty. Anesth Analg. 87:88–92. DOI: 10.1213/00000539-199807000-00019. PMID: 9661552.
crossref
3. Ibrahim MS, Khan MA, Nizam I, Haddad FS. 2013; Peri-operative interventions producing better functional outcomes and enhanced recovery following total hip and knee arthroplasty: an evidence-based review. BMC Med. 11:37. DOI: 10.1186/1741-7015-11-37. PMID: 23406499. PMCID: PMC3606483.
crossref
4. Webb CA, Mariano ER. 2015; Best multimodal analgesic protocol for total knee arthroplasty. Pain Manag. 5:185–96. DOI: 10.2217/pmt.15.8. PMID: 25971642.
crossref
5. Wheatley RG, Shepherd D, Jackson IJ, Madej TH, Hunter D. 1992; Hypoxaemia and pain relief after upper abdominal surgery: comparison of i.m. and patient-controlled analgesia. Br J Anaesth. 69:558–61. DOI: 10.1093/bja/69.6.558. PMID: 1467096.
crossref
6. Moen V, Dahlgren N, Irestedt L. 2004; Severe neurological complications after central neuraxial blockades in Sweden 1990-1999. Anesthesiology. 101:950–9. DOI: 10.1097/00000542-200410000-00021. PMID: 15448529.
crossref
7. Zinkus J, Mockutė L, Gelmanas A, Tamošiūnas R, Vertelis A, Macas A. 2017; Comparison of 2 analgesia modalities in total knee replacement surgery: is there an effect on knee function rehabilitation? Med Sci Monit. 23:3019–25. DOI: 10.12659/MSM.899320. PMID: 28634320. PMCID: PMC5486887.
crossref
8. Runge C, Børglum J, Jensen JM, Kobborg T, Pedersen A, Sandberg J, et al. 2016; The analgesic effect of obturator nerve block added to a femoral triangle block after total knee arthroplasty: a randomized controlled trial. Reg Anesth Pain Med. 41:445–51. DOI: 10.1097/AAP.0000000000000406. PMID: 27171822.
9. Macrinici GI, Murphy C, Christman L, Drescher M, Hughes B, Macrinici V, et al. 2017; Prospective, double-blind, randomized study to evaluate single-injection adductor canal nerve block versus femoral nerve block: postoperative functional outcomes after total knee arthroplasty. Reg Anesth Pain Med. 42:10–6. DOI: 10.1097/AAP.0000000000000507. PMID: 27811526.
crossref
10. Elkassabany NM, Antosh S, Ahmed M, Nelson C, Israelite C, Badiola I, et al. 2016; The risk of falls after total knee arthroplasty with the use of a femoral nerve block versus an adductor canal block: a double-blinded randomized controlled study. Anesth Analg. 122:1696–703. DOI: 10.1213/ANE.0000000000001237. PMID: 27007076.
11. Sundarathiti P, Ruananukul N, Channum T, Kitkunasathean C, Mantay A, Thammasakulsiri J, et al. 2009; A comparison of continuous femoral nerve block (CFNB) and continuous epidural infusion (CEI) in postoperative analgesia and knee rehabilitation after total knee arthroplasty (TKA). J Med Assoc Thai. 92:328–34. PMID: 19301724.
12. Osawa M, Takahama Y, Kondo Y. 2012; [Comparison of postoperative pain relief by continuous femoral nerve block and that by epidural block during physiotherapy after minimally invasive surgery of total knee arthroplasty and uni-condylar knee arthroplasty]. Masui. 61:1316–23. Japanese. PMID: 23362767.
13. Sakai N, Inoue T, Kunugiza Y, Tomita T, Mashimo T. 2013; Continuous femoral versus epidural block for attainment of 120° knee flexion after total knee arthroplasty: a randomized controlled trial. J Arthroplasty. 28:807–14. DOI: 10.1016/j.arth.2012.09.013. PMID: 23434107.
crossref
14. Moher D, Liberati A, Tetzlaff J, Altman DG. 2010; Preferred reporting items for systematic reviews and meta-analyses: the PRISMA statement. Int J Surg. 8:336–41. DOI: 10.1016/j.ijsu.2010.02.007. PMID: 20171303.
crossref
15. Shoji H, Solomonow M, Yoshino S, D'Ambrosia R, Dabezies E. 1990; Factors affecting postoperative flexion in total knee arthroplasty. Orthopedics. 13:643–9. DOI: 10.3928/0147-7447-19900601-08. PMID: 2367246.
crossref
16. Ryu J, Saito S, Yamamoto K, Sano S. 1993; Factors influencing the postoperative range of motion in total knee arthroplasty. Bull Hosp Jt Dis. 53:35–40. PMID: 8012266.
17. Naylor JM, Walker R. 2018; Low value care and inpatient rehabilitation after total knee replacement. Med J Aust. 209:207–8. DOI: 10.5694/mja18.00663. PMID: 30157411.
crossref
18. Kuo AC, Raghunathan K, Lartigue AM, Bryan WE 3rd, Pepin MJ, Takemoto S, et al. 2019; Freedom from opioids after total knee arthroplasty. J Arthroplasty. 34:893–7. DOI: 10.1016/j.arth.2019.01.054. PMID: 30777627.
crossref
19. Roberts KC, Moser SE, Collins AC, McCardel BR, Schultz KA, Schaffer NE, et al. 2020; Prescribing and consumption of opioids after primary, unilateral total hip and knee arthroplasty in opioid-naive patients. J Arthroplasty. 35:960–5.e1. DOI: 10.1016/j.arth.2019.08.036. PMID: 31924487.
crossref
20. Higgins JPT, Altman DG. Higgins JPT, Green S, editors. 2008. Assessing risk of bias in included studies. Cochrane handbook for systematic reviews of interventions: Cochrane book series. John Wiley & Sons;Chichester: p. 187–241. DOI: 10.1002/9780470712184.ch8.
crossref
21. Hou X, Shi J, Chen X. 2015; How to estimate the mean and standard deviation based on the median, range and sample size when conducting meta-analysis. Chin J Evid Based Med. 15:484–7.
22. Jüni P, Altman DG, Egger M. Egger M, Smith GD, Altman DG, editors. 2008. Assessing the quality of randomised controlled trials. Systematic reviews in health care: meta-analysis in context. 2nd ed. BMJ;London: p. 87–108.
crossref
23. Higgins JP, Thompson SG, Deeks JJ, Altman DG. 2003; Measuring inconsistency in meta-analyses. BMJ. 327:557–60. DOI: 10.1136/bmj.327.7414.557. PMID: 12958120. PMCID: PMC192859.
crossref
24. Adams HA, Saatweber P, Schmitz CS, Hecker H. 2002; Postoperative pain management in orthopaedic patients: no differences in pain score, but improved stress control by epidural anaesthesia. Eur J Anaesthesiol. 19:658–65. DOI: 10.1017/S0265021502001084. PMID: 12243289.
crossref
25. Campbell A, McCormick M, McKinlay K, Scott NB. 2008; Epidural vs. lumbar plexus infusions following total knee arthroplasty: randomized controlled trial. Eur J Anaesthesiol. 25:502–7. DOI: 10.1017/S0265021508003724. PMID: 18298872.
26. Capdevila X, Barthelet Y, Biboulet P, Ryckwaert Y, Rubenovitch J, d'Athis F. 1999; Effects of perioperative analgesic technique on the surgical outcome and duration of rehabilitation after major knee surgery. Anesthesiology. 91:8–15. DOI: 10.1097/00000542-199907000-00006. PMID: 10422923.
crossref
27. Fedriani de Matos JJ, Atienza Carrasco FJ, Díaz Crespo J, Moreno Martín A, Tatsidis Tatsidis P, Torres Morera LM. 2017; Effectiveness and safety of continuous ultrasound-guided femoral nerve block versus epidural analgesia after total knee arthroplasty. Rev Esp Anestesiol Reanim. 64:79–85. DOI: 10.1016/j.redar.2016.05.008. PMID: 27400891.
crossref
28. Horasanli E, Gamli M, Pala Y, Erol M, Sahin F, Dikmen B. 2010; A comparison of epidural anesthesia and lumbar plexus-sciatic nerve blocks for knee surgery. Clinics (Sao Paulo). 65:29–34. DOI: 10.1590/S1807-59322010000100006. PMID: 20126343. PMCID: PMC2815279.
crossref
29. Kim JH, Cho MR, Kim SO, Kim JE, Lee DK, Roh WS. 2012; A comparison of femoral/sciatic nerve block with lateral femoral cutaneous nerve block and combined spinal epidural anesthesia for total knee replacement arthroplasty. Korean J Anesthesiol. 62:448–53. DOI: 10.4097/kjae.2012.62.5.448. PMID: 22679542. PMCID: PMC3366312.
crossref
30. Shanthanna H, Huilgol M, Manivackam VK, Maniar A. 2012; Comparative study of ultrasound-guided continuous femoral nerve blockade with continuous epidural analgesia for pain relief following total knee replacement. Indian J Anaesth. 56:270–5. DOI: 10.4103/0019-5049.98776. PMID: 22923827. PMCID: PMC3425288.
crossref
31. Zaric D, Boysen K, Christiansen C, Christiansen J, Stephensen S, Christensen B. 2006; A comparison of epidural analgesia with combined continuous femoral-sciatic nerve blocks after total knee replacement. Anesth Analg. 102:1240–6. DOI: 10.1213/01.ane.0000198561.03742.50. PMID: 16551931.
crossref
32. Barrington MJ, Olive D, Low K, Scott DA, Brittain J, Choong P. 2005; Continuous femoral nerve blockade or epidural analgesia after total knee replacement: a prospective randomized controlled trial. Anesth Analg. 101:1824–9. DOI: 10.1213/01.ANE.0000184113.57416.DD. PMID: 16301267.
crossref
33. Davies AF, Segar EP, Murdoch J, Wright DE, Wilson IH. 2004; Epidural infusion or combined femoral and sciatic nerve blocks as perioperative analgesia for knee arthroplasty. Br J Anaesth. 93:368–74. DOI: 10.1093/bja/aeh224. PMID: 15247111.
crossref
34. Raimer C, Priem K, Wiese AA, Birnbaum J, Dirkmorfeld LM, Mossner A, et al. 2007; Continuous psoas and sciatic block after knee arthroplasty: good effects compared to epidural analgesia or i.v. opioid analgesia: a prospective study of 63 patients. Acta Orthop. 78:193–200. DOI: 10.1080/17453670710013672. PMID: 17464606.
crossref
35. Chelly JE, Greger J, Gebhard R, Coupe K, Clyburn TA, Buckle R, et al. 2001; Continuous femoral blocks improve recovery and outcome of patients undergoing total knee arthroplasty. J Arthroplasty. 16:436–45. DOI: 10.1054/arth.2001.23622. PMID: 11402405.
crossref
36. Al-Zahrani T, Doais KS, Aljassir F, Alshaygy I, Albishi W, Terkawi AS. 2015; Randomized clinical trial of continuous femoral nerve block combined with sciatic nerve block versus epidural analgesia for unilateral total knee arthroplasty. J Arthroplasty. 30:149–54. DOI: 10.1016/j.arth.2014.07.032. PMID: 25149364.
crossref
37. Kayupov E, Okroj K, Young AC, Moric M, Luchetti TJ, Zisman G, et al. 2018; Continuous adductor canal blocks provide superior ambulation and pain control compared to epidural analgesia for primary knee arthroplasty: a randomized, controlled trial. J Arthroplasty. 33:1040–4.e1. DOI: 10.1016/j.arth.2017.11.013. PMID: 29233569.
crossref
38. Gandhi HJ, Trivedi LH, Tripathi DC, Dash DM, Khare AM, Gupta MU. 2019; A randomized, controlled trial of comparison of a continuous femoral nerve block (CFNB) and continuous epidural infusion (CEI) using 0.2% ropivacaine for postoperative analgesia and knee rehabilitation after total knee arthroplasty (TKA). J Anaesthesiol Clin Pharmacol. 35:386–9. DOI: 10.4103/joacp.JOACP_134_16. PMID: 31543590. PMCID: PMC6748000.
crossref
39. Fowler SJ, Symons J, Sabato S, Myles PS. 2008; Epidural analgesia compared with peripheral nerve blockade after major knee surgery: a systematic review and meta-analysis of randomized trials. Br J Anaesth. 100:154–64. DOI: 10.1093/bja/aem373. PMID: 18211990.
crossref
40. Gerrard AD, Brooks B, Asaad P, Hajibandeh S, Hajibandeh S. 2017; Meta-analysis of epidural analgesia versus peripheral nerve blockade after total knee joint replacement. Eur J Orthop Surg Traumatol. 27:61–72. DOI: 10.1007/s00590-016-1846-z. PMID: 27592218.
crossref
41. Yuan Z, Wei J, Wen J, Yang S, Quan D. 2015; A meta-analysis of countious femoral nerve block versus continuous epidural analgesia after total knee arthroplasty. Chin J Tissue Eng Res. 19:5728–34.
42. Zywiel MG, Stroh DA, Lee SY, Bonutti PM, Mont MA. 2011; Chronic opioid use prior to total knee arthroplasty. J Bone Joint Surg Am. 93:1988–93. DOI: 10.2106/JBJS.J.01473. PMID: 22048093.
crossref
43. Patel N, Solovyova O, Matthews G, Arumugam S, Sinha SK, Lewis CG. 2015; Safety and efficacy of continuous femoral nerve catheter with single shot sciatic nerve block vs epidural catheter anesthesia for same-day bilateral total knee arthroplasty. J Arthroplasty. 30:330–4. DOI: 10.1016/j.arth.2014.09.015. PMID: 25445854.
crossref
44. Patterson ME, Bland KS, Thomas LC, Elliott CE, Soberon JR Jr, Nossaman BD, et al. 2015; The adductor canal block provides effective analgesia similar to a femoral nerve block in patients undergoing total knee arthroplasty--a retrospective study. J Clin Anesth. 27:39–44. DOI: 10.1016/j.jclinane.2014.08.005. PMID: 25468584.
crossref
45. Ritter MA, Wing JT, Berend ME, Davis KE, Meding JB. 2008; The clinical effect of gender on outcome of total knee arthroplasty. J Arthroplasty. 23:331–6. DOI: 10.1016/j.arth.2007.10.031. PMID: 18358368.
crossref
46. Long WT, Ward SR, Dorr LD, Raya J, Boutary M, Sirianni LE. 2006; Postoperative pain management following total knee arthroplasty: a randomized comparison of continuous epidural versus femoral nerve infusion. J Knee Surg. 19:137–43. DOI: 10.1055/s-0030-1248096. PMID: 16642893.
crossref

Fig. 1
Flowchart of the study selection process.
kjp-34-3-271-f1.tif
Fig. 2
Risk of bias graph and summary.
kjp-34-3-271-f2.tif
Fig. 3
Forest plot for the incidence of nausea and vomiting after nerve block vs. epidural block. M-H: Mantel-Haenszel, CI: confidence interval, df: degree of freedom.
kjp-34-3-271-f3.tif
Fig. 4
Forest plot for the incidence of hypotension after nerve block vs. epidural block. M-H: Mantel-Haenszel, CI: confidence interval, df: degree of freedom.
kjp-34-3-271-f4.tif
Fig. 5
Forest plot for the incidence of urinary retention after nerve block vs. epidural block. M-H: Mantel-Haenszel, CI: confidence interval, df: degree of freedom.
kjp-34-3-271-f5.tif
Fig. 6
Forest plot for the incidence of pruritus after nerve block vs. epidural block. M-H: Mantel-Haenszel, CI: confidence interval, df: degree of freedom.
kjp-34-3-271-f6.tif
Fig. 7
Forest plot for the incidence of sedation after nerve block vs. epidural block. M-H: Mantel-Haenszel, CI: confidence interval, df: degree of freedom.
kjp-34-3-271-f7.tif
Fig. 8
Forest plot for the visual analogue scale score during 0-12 hours after surgery after nerve block vs. epidural block. SD: standard deviation, IV: inverse variance, CI: confidence interval, df: degree of freedom.
kjp-34-3-271-f8.tif
Fig. 9
Forest plot for the visual analogue scale score within 12-24 horrs after nerve block vs. epidural analgesia. SD: standard deviation, IV: inverse variance, CI: confidence interval, df: degree of freedom.
kjp-34-3-271-f9.tif
Fig. 10
Forest plot for the sensitivity analyses (24-48 hr). SD: standard deviation, IV: inverse variance, CI: confidence interval, df: degree of freedom.
kjp-34-3-271-f10.tif
Fig. 11
Forest plot for patient satisfaction after nerve block vs. epidural block. M-H: Mantel-Haenszel, CI: confidence interval, df: degree of freedom.
kjp-34-3-271-f11.tif
Fig. 12
Forest plot for intraoperative opioid use. SD: standard deviation, IV: inverse variance, CI: confidence interval, df: degree of freedom.
kjp-34-3-271-f12.tif
Fig. 13
Forest plot for sensitivity analyses of the length of hospital stay. SD: standard deviation, IV: inverse variance, CI: confidence interval, df: degree of freedom.
kjp-34-3-271-f13.tif
Fig. 14
Forest plot for active knee flexion after nerve block vs. epidural analgesia. SD: standard deviation, IV: inverse variance, CI: confidence interval, df: degree of freedom.
kjp-34-3-271-f14.tif
Table 1
Basic characteristics of the included studies
Reference Year Country Journal Design Primary
anesthesia
Intervention Analgesic techniques
Peripheral nerve block Epidural analgesia Peripheral nerve block Epidural analgesia
Adams et al. [24] 2002 Germany European Journal of Anaesthesiology RCT GA Continuous femoral Continuous epidural analgesia Single-shot femoral block: postop bolus bupivacaine 0.375% of 40 mL Bupivacaine 0.375% bolus postop
Barrington et al. [32] 2005 Australia Anesthesia and Analgesia RCT Spinal Continuous lumbar plexus infusion Continuous epidural analgesia Femoral catheter: preop bolus bupivacaine 0.25% with adrenaline 25 mL + infusion bupivacaine 0.2% with PCA bolus postop Ropivacaine 0.2% with fentanyl infusion postop
Campbell et al. [25] 2008 UK European Journal of Anaesthesiology RCT Spinal Continuous femoral block Continuous epidural infusion Infusion a mixture of levobupivacaine 0.125% and clonidine + 10 mL 0.5% levobupivacaine 4 mL of 0.5% levobupivacaine + 4 mL 0.25% levobupivacaine
Capdevila et al. [26] 1999 France Anaesthesiology RCT GA Single-shot combined sciatic plus femoral (3-in-1) block Continuous lumbar epidural analgesia Femoral catheter: postop bolus 2% lidocaine with epinephrine 25 mL and morphine 2 mg + infusion 1% lidocaine with clonidine and morphine Lidocaine 2% with epinephrine and morphine 2 mg to block level T10 bolus postop + infusion 1% lidocaine with clonidine and morphine
Davies et al. [33] 2004 UK British Journal of Anaesthesiology RCT GA Continuous femoral nerve block Continuous epidural analgesia Single-shot femoral and sciatic blocks: preop bolus bupivacaine 0.375% 30 mL (femoral) + 25 mL (sciatic) limited to 3 mg kg-1 Bupivacaine 0.5% bolus preop + infusion bupivacaine 0.25% postop
Sakai et al. [13] 2013 Japan The Journal of Arthroplasty RCT GA Continuous femoral Continuous epidural analgesia 60-mg dose of 0.3% ropivacaine (tibial) + 60-mg dose of 0.3% ropivacaine (femoral) 1% lidocaine 50 mg + 90-mg doses of 0.3% ropivacaine
Shanthanna et al. [30] 2012 Canada Indian Journal of Anaesthesia RCT GA and spinal Continuous femoral Continuous epidural analgesia Femoral catheters: 12 mL bolus of 0.125% bupivacaine mixed with 2 mcg/mL fentanyl + 0.125% bupivacaine with fentanyl postop 25 mcg fentanyl + 12 mL bolus of 0.125% bupivacaine mixed with 2 mcg/mL fentanyl + 0.125% bupivacaine with fentanyl postop
Singelyn et al. [2] 1998 Belgium Anesthesia and Analgesia RCT GA Continuous femoral and sciatic nerve blocks Continuous epidural infusion 37 mL of 0.25% bupivacaine with epinephrine + continuous infusion of 0.125% bupivacaine with sufentanil 0.1 µg/mL and clonidine 1 µg/mL postop 3 mL of 0.25% bupivacaine with epinephrine + 10 µg of sufentanil bolus preop + infusion bupivacaine 0.125% with sufentanil and clonidine postop
Zaric et al. [31] 2006 Denmark Anesthesia and Analgesia RCT GA Femoral Epidural catheter analgesia Femoral and sciatic catheters: preop bolus ropivacaine 0.75% 30 mL each catheter + infusion ropivacaine 0.2% with sufentanil (femoral) and ropivacaine 0.05% (sciatic) postop Ropivacaine 0.75% boluses to block level T10 preop + infusion ropivacaine 0.25% with sufentanil postop
Chelly et al. [35] 2001 USA The Journal of Arthroplasty RCT GA Lumbar plexus + sciatic blocks Epidural anesthesia 15 mL of 0.75% ropivacaine + 15 mL of 1.5% mepivacaine + 0.2% ropivacaine postop Epidural catheter: 20 mL of a mixture containing 2% lidocaine and 0.5% bupivacaine
Horasanli et al. [28] 2010 Turkey Clinics RCT GA Continuous femoral infusion Epidural analgesia 3 mL of 2% lidocaine + 30 mL of 0.375% ropivacaine + 20 mL of 0.375% ropivacaine 2 mL of 2% lidocaine + 3 mL of 2% lidocaine with epinephrine + 15 mL of 0.75% epidural ropivacaine
Kim et al. [29] 2012 Korea Korean Journal of Anesthesiology RCT Spinal Femoral/sciatic nerve block Combined spinal epidural nerve block 20 mL of 1.5% mepivacaine + 5 mL of 1.5% mepivacaine + 20 mL of 1.5% mepivacaine 1.3 mL of 0.5% hyperbaric bupivacaine + 10 mL of 0.75% ropivacaine + fentanyl, ketorolac, ramosetron postop
Raimer et al. [34] 2007 Germany Acta Orthopaedica RCT Spinal Continuous psoas compartment and sciatic analgesia Epidural analgesia 25 mL of 0.75% ropivacaine + 25 mL 1% prilocaine (sciatic block) 0.5% bupivacaine
Al-Zahrani et al. [36] 2015 Saudi Arabia The Journal of Arthroplasty RCT GA Continuous femoral nerve block with single shot sciatic nerve block Continuous epidural infusion Femoral nerve catheter: preop 15 mL of 0.25% bupivacaine; 10 mL 0.25% bupivacaine + 0.2% bupivacaine Epidural catheter: preop 10 mL of 0.25% bupivacaine + 50 mcg fentanyl; 0.0625% bupivacaine + fentanyl
Fedriani de Matos et al. [27] 2017 Spain Rev Esp Anestesiol Reanim RCT Spinal Continuous femoral Continuous epidural block 15 mL of levobupivacaine 0.25% + levobupivacaine 0.125% postop 3 mL bupivacaine 0.25% with adrenalin + levobupivacaine 0.125% postop
Kayupov et al. [37] 2018 USA The Journal of Arthroplasty RCT GA and spinal Continuous adductor canal blocks Epidural analgesia Spinal + CACB: 3 mL 1.5% + lidocaine with epinephrine, 0.2% ropivacaine postop; Epidural catheter: 0.1% bupivacaine postop
General + CACB: 30 mL 0.5% ropivacaine with epinephrine, ropivacaine postop

RCT: randomized controlled trial, GA: general anesthesia, PCA: patient-controlled analgesia.

Table 2
Baseline demographic and clinical characteristics of the included population
Reference Total CG TG Mean age (yr)a Sex (M/F)a ASA (I/II/III)a BMI (kg/m2)a
Adams et al. [24] 42 21 21 69 vs.70 7/14 vs. 5/16 NR NR
Barrington et al. [32] 108 55 53 71 ± 9 vs. 69 ± 10 25/30 vs. 26/27 NR 31 ± 5.2 vs. 33 ± 6.1
Campbell et al. [25] 60 31 29 70 ± 8.4 vs. 72 ± 9.9 14/17 vs. 14/15 2.2 ± 0.6 vs. 2.2 ± 0.6 30.8 ± 4.8 vs. 29.1 ± 4.6
Capdevila et al. [26] 37 17 20 51 ± 15 vs. 54 ± 17 10/7 vs. 8/12 ASA I or II NR
Davies et al. [33] 60 30 30 73.1 ± 9.0 vs. 72.3 ± 9.5 13/17 vs. 19/11 NR NR
Sakai et al. [13] 60 30 30 73 (53-86) vs. 72 (48-84) 4/26 vs. 4/26 1/26/3 vs. 2/24/4 24.8 (16.4-33.3) vs. 24.8 (19.1-37.0)
Shanthanna et al. [30] 38 19 19 63.6 ± 5.0 vs. 63.5 ± 5.0 11/8 vs. 10/9 NR NR
Singelyn et al. [2] 30 15 15 NR NR ASA II or III NR
Zaric et al. [31] 49 23 26 67 ± 6 vs. 66 ± 7 12/11 vs. 11/15 3/20/0 vs. 4/17/5/0 NR
Chelly et al. [35] 59 30 29 70 (65-74) vs. 66 (60-74) NR NR NR
Horasanli et al. [28] 76 39 37 54.0 ± 16.9 vs. 51.3 ± 14.9 27/12 vs. 24/13 14/29/0 vs. 14/23/0 NR
Kim et al. [29] 80 40 40 67.4 ± 1.3 vs. 71.8 ± 1.3 4/36 vs. 3/37 1/38/0 vs. 2/36/2 NR
Raimer et al. [34] 42 21 21 64 (61-73) vs. 69 (61-75) 7/14 vs. 10/11 2/12/7 vs. 2/15/4 33 (28-35) vs. 30 (26-34)
Al-Zahrani et al. [36] 50 25 25 60 ± 8.5 vs. 62 ± 7.5 7/18 vs. 8/17 2/23/0 vs. 6/19/0 33 ± 5 vs. 33 ± 5
Fedriani de Matos et al. [27] 58 30 28 68.6 ± 6.5 vs. 68.0 ± 8.2 70%/30% 32%/68% 0%/80%/20% vs. 4%/89%/7% 33.5 ± 8.5 vs. 30.8 ± 5.0
Kayupov et al. [37] 132 44 41/47 64/63/60 45%/55% 46%/54% 59%/41% NR 30/31/31

CG: control group, TG: test group, ASA: American Society of Anesthesiologists , BMI: body mass index, NR: not reported.

aEpidural analgesia vs. nerve block.

Table 3
Egger’s test of nausea and vomiting
Std_Eff Coef. Std. Err. t P > l t l 95% CI
Slope 0.006 0.880 0.01 0.994 –2.022, 2.035
Bias –0.836 1.049 –0.80 0.448 –3.255, 1.583

Std_Eff: standardized effect, Coef.: coefficient, Std. Err.: standard error, CI: confidence interval.

Table 4
Egger’s test of hypotension
Std_Eff Coef. Std. Err. t P > l t l 95% CI
Slope 0.376 0.497 0.76 0.469 –0.748, 1.500
Bias –1.337 0.648 –2.06 0.069 –2.803, 0.130

Std_Eff: standardized effect, Coef.: coefficient, Std. Err.: standard error, CI: confidence interval.

Table 5
Egger’s test of the visual analogue scale score within 12-24 hours
Std_Eff Coef. Std. Err. t P > l t l 95% CI
Slope –1.344 0.897 –1.50 0.185 –3.539, 0.851
Bias 0.696 3.543 0.20 0.851 –7.973, 9.365

Std_Eff: standardized effect, Coef.: coefficient, Std. Err.: standard error, CI: confidence interval.

Table 6
Egger’s test of the visual analogue scale score within 24-48 hours
Std_Eff Coef. Std. Err. t P > l t l 95% CI
Slope 5.267 2.007 2.62 0.232 –20.239, 30.773
Bias –24.465 7.378 –3.32 0.186 –118.208, 69.277

Std_Eff: standardized effect, Coef.: coefficient, Std. Err.: standard error, CI: confidence interval.

TOOLS
Similar articles