

 PDF
PDF Citation
 Print
Print


INTRODUCTION
MATERIALS AND METHODS
1. Ethical consideration
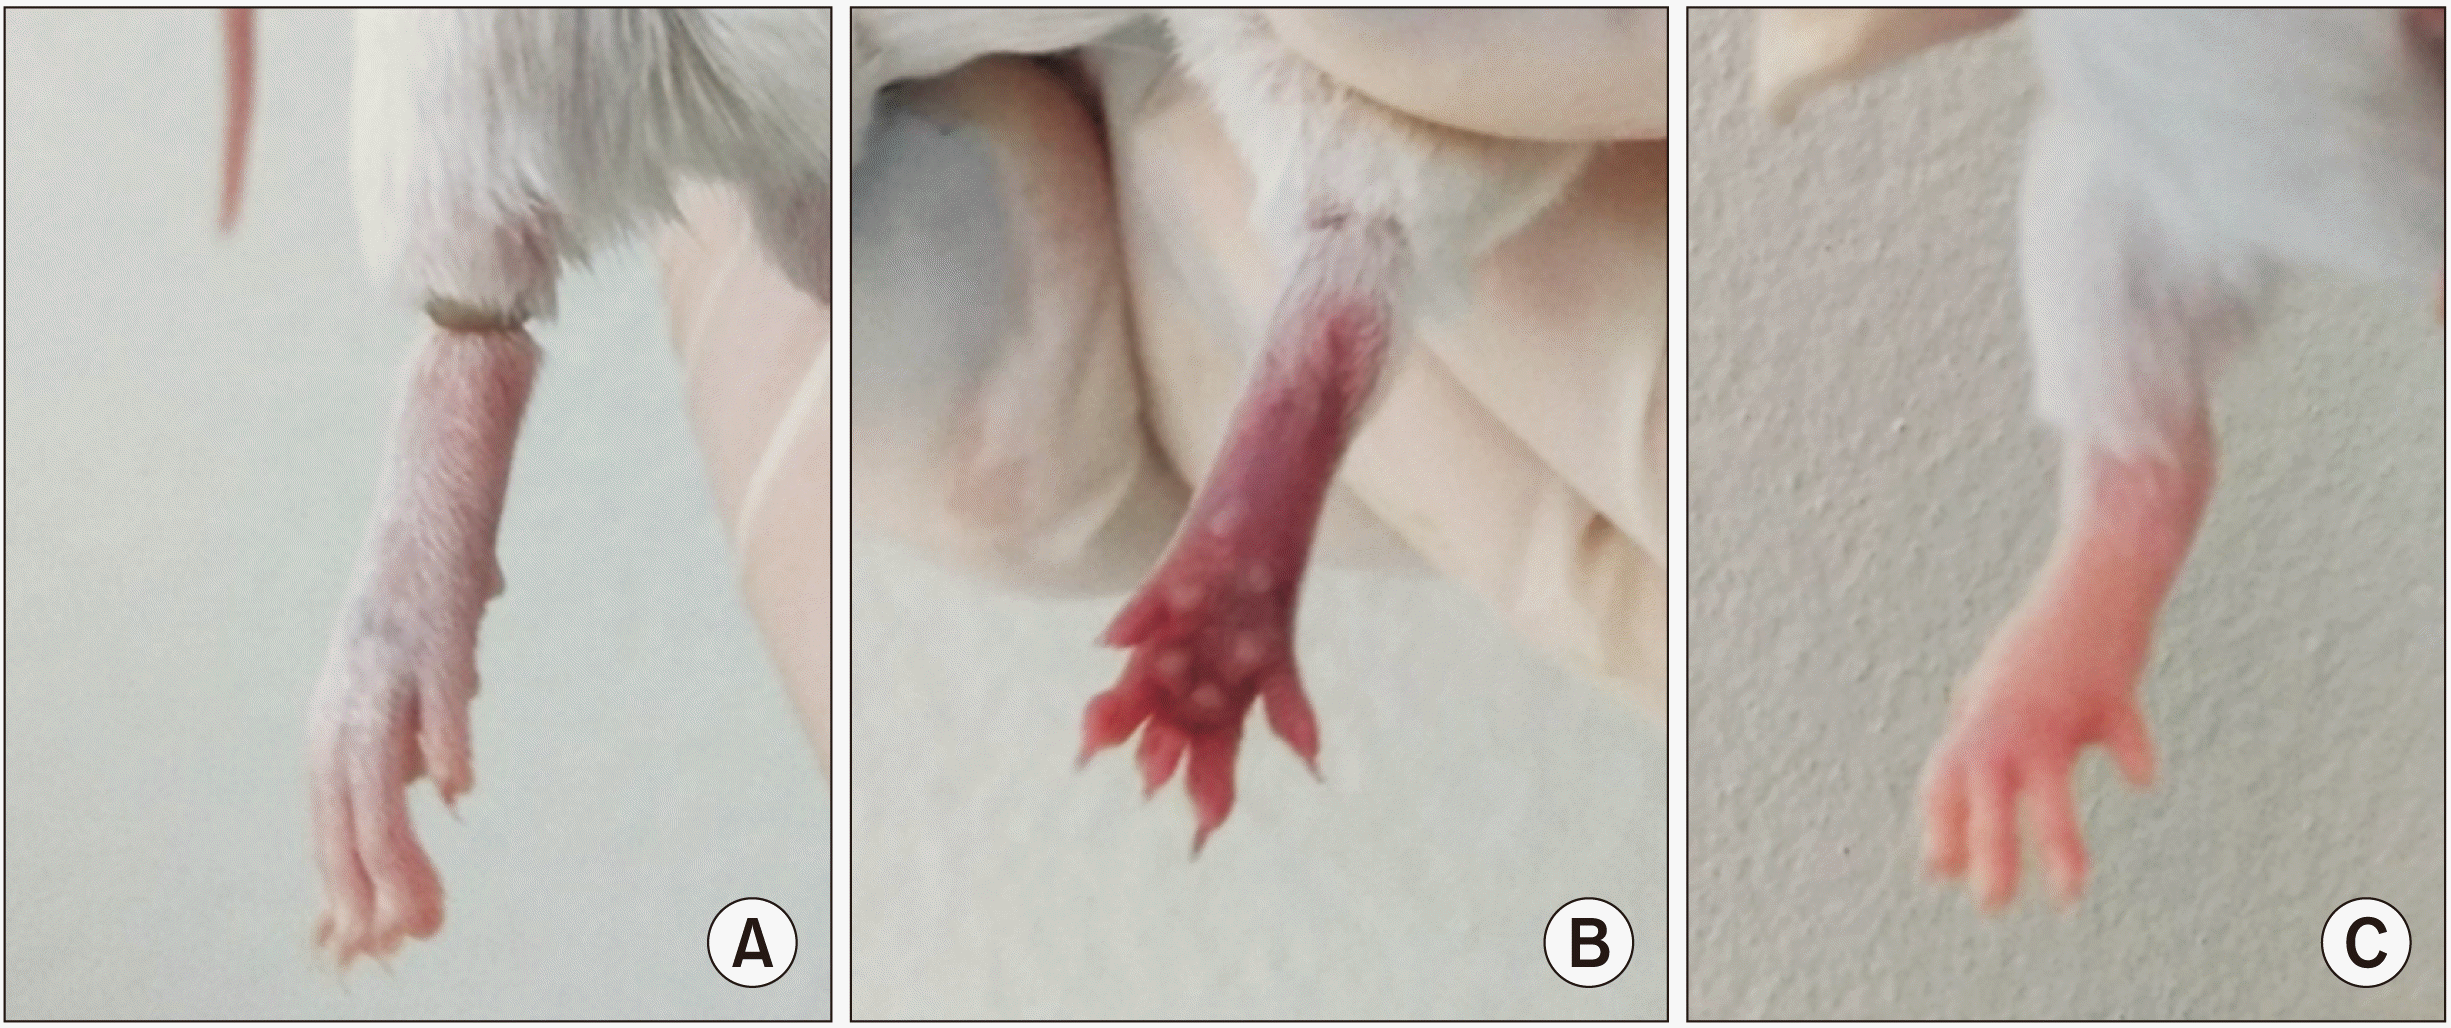
2. Experimental procedure
Group 1 - control or placebo, the PBM was not applied;
Group 2 - PBM applied to the paw with CRPS-I from the warm phase (1st day after CPIP induction);
Group 3 - PBM applied to the paw from the acute phase of CRPS-I (3rd day after CPIP induction);
Group 4 - PBM applied near the region between the L4 and L5 segments from the warm phase of the injury;
Group 5 - PBM applied near the region between the L4 and L5 segments from the acute phase of the lesion;
Group 6 - PBM applied at two points: the right paw and the region between the L4 and L5 segments from the warm phase of the syndrome;
Group 7 - PBM applied at two points: the right paw and the region between the L4 and L5 segments from the acute phase of the injury.
3. PBM
4. Analysis procedure
2) Thermal hyperalgesia
3) Mechanical hyperalgesia
4) Thermographic analysis
5) Functional and Sciatic Static Index (SSI)
 | Fig. 2Illustrative representation of the parameters used to calculate the Sciatic Static Index and Sciatic Functional Index. IT: intermediate finger opening, PL: footprint length, TS: full finger opening. Adapted from the article of Marcolino et al. (J Hand Microsurg 2013; 5: 49-53) [33].
|
5. Statistical analysis
RESULTS
1. Edema
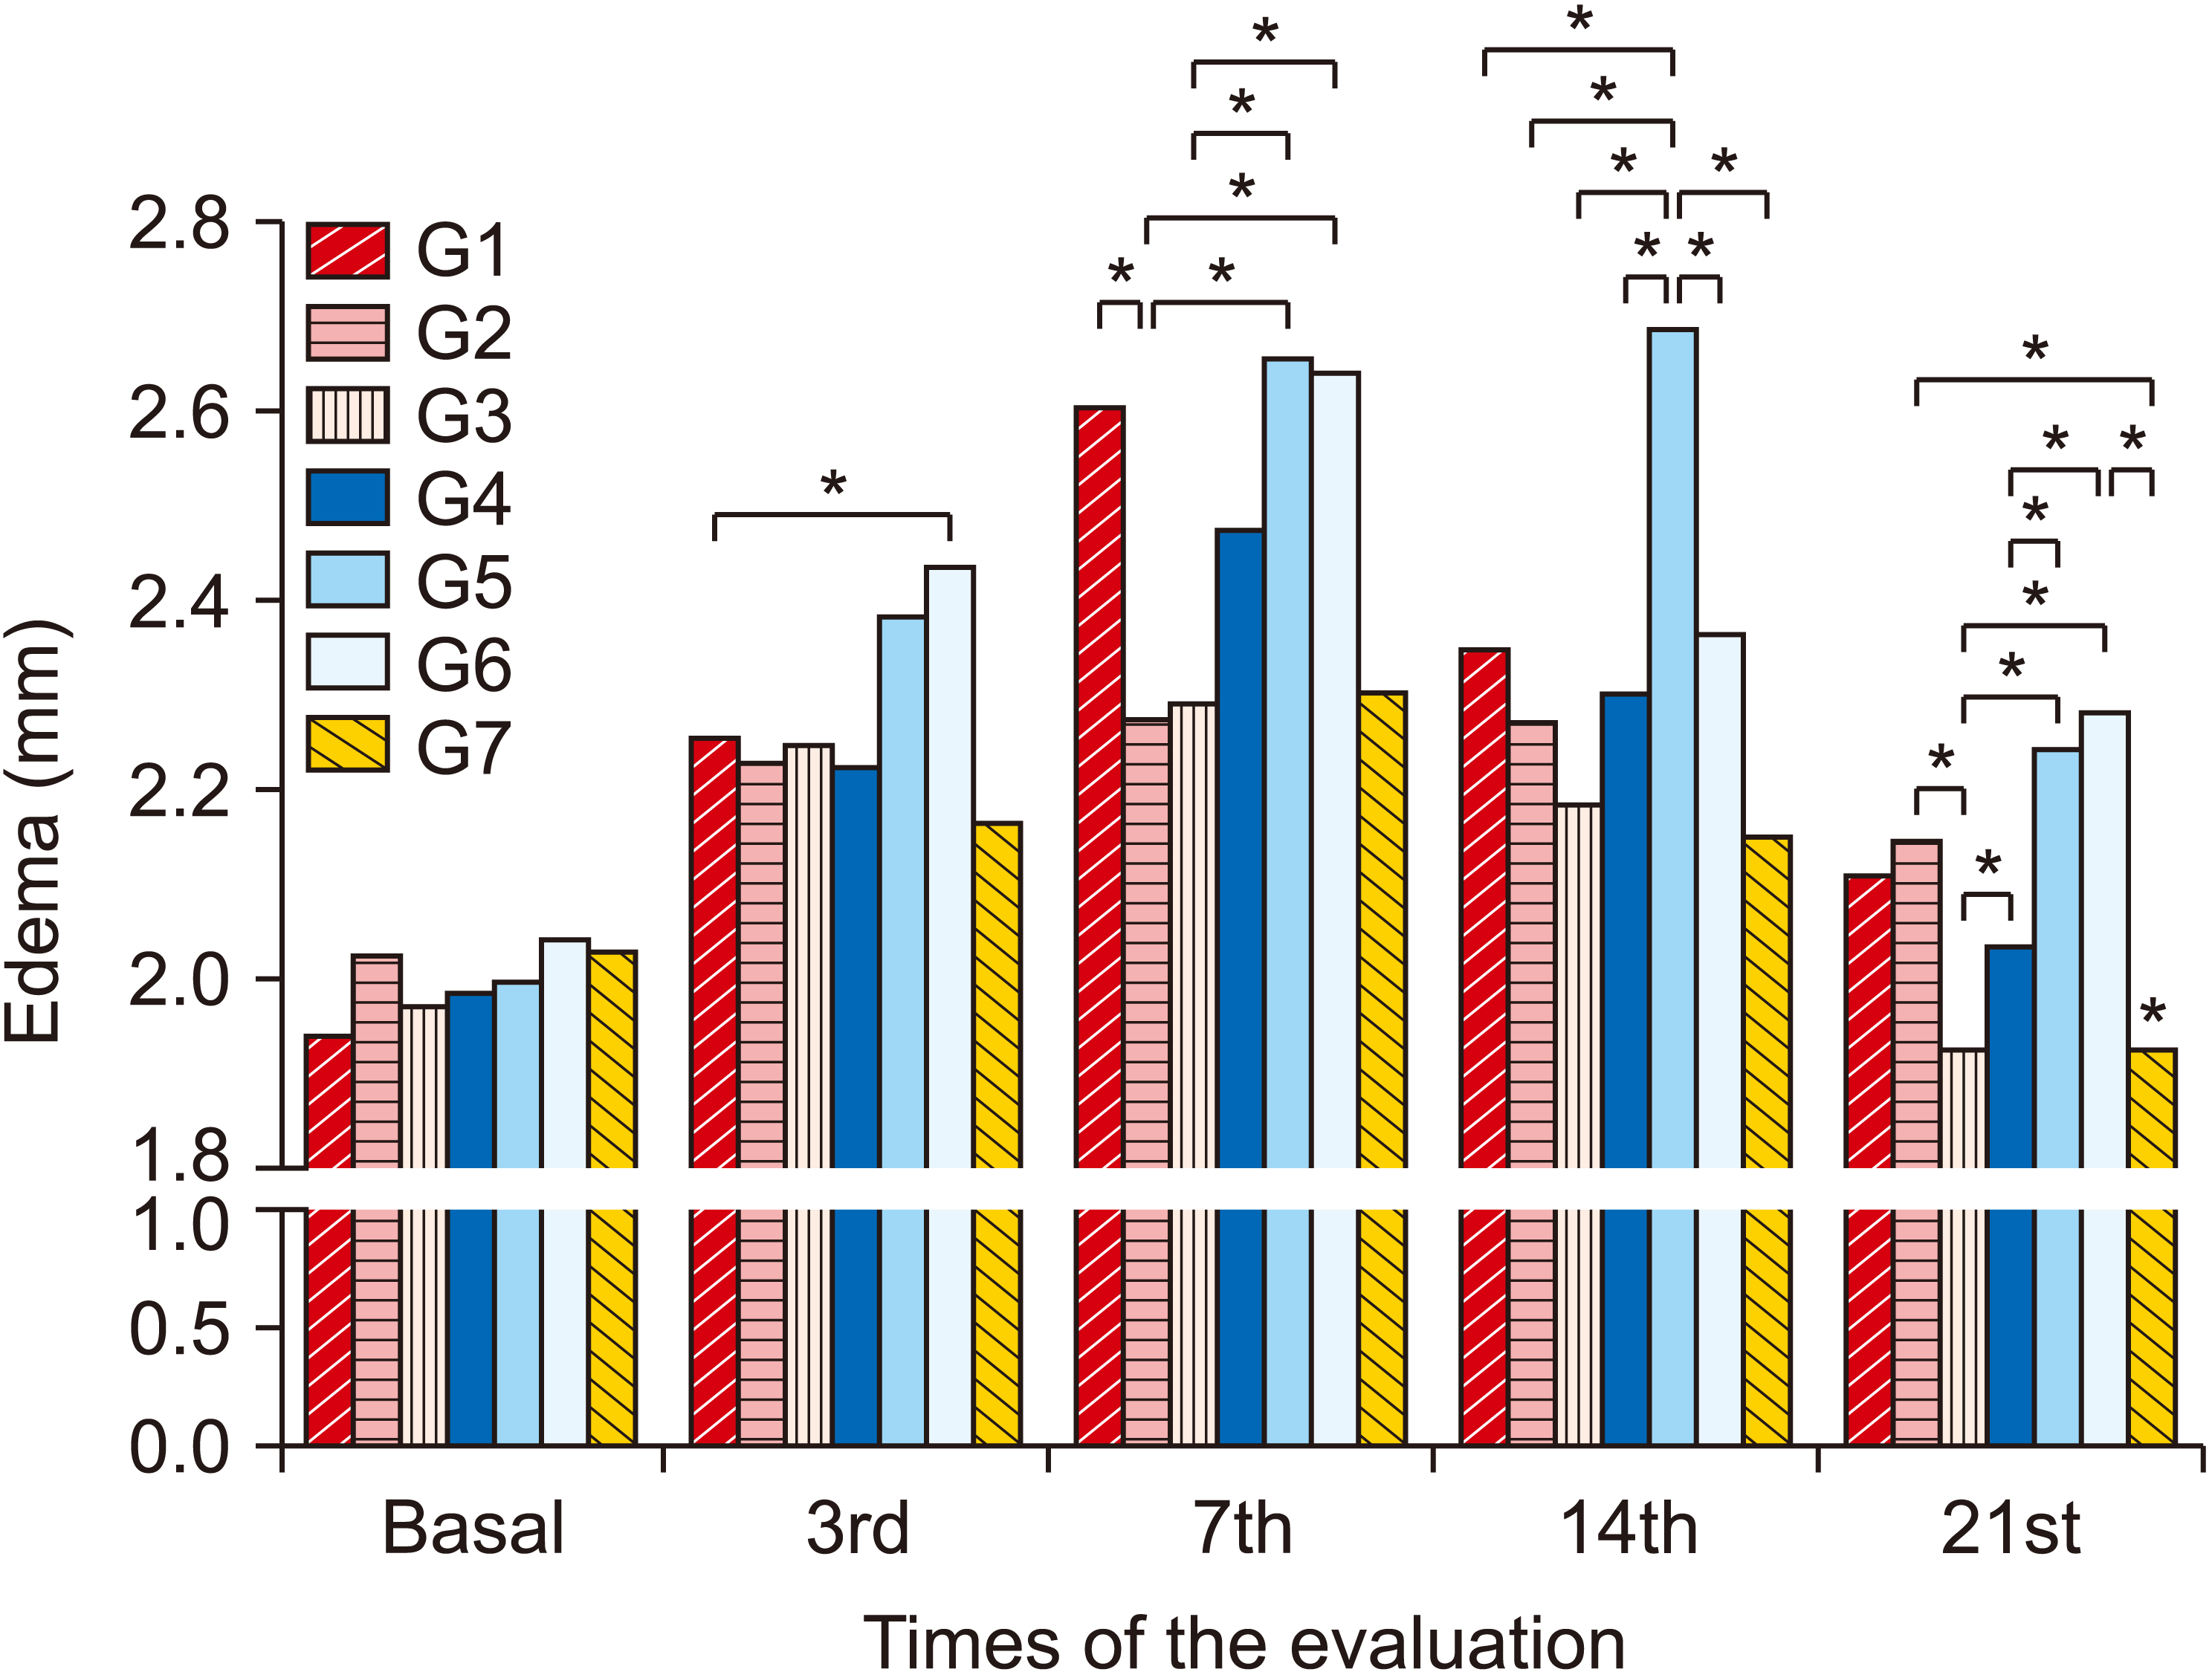 | Fig. 3Average values of the edema variable between groups and evaluation days. Group (G) 1: control (placebo), G2: photobiomodulation (PBM) applied to the paw with complex regional pain syndrome type I (CRPS-I) from the warm phase, G3: PBM applied to the paw with CRPS-I from the acute phase, G4: PBM applied close to the area of the region between L4 and L5 from the warm phase, G5: PBM applied close to the area of the region between L4 and L5 from the acute phase, G6: PBM applied at two points: right paw and region between L4 and L5 from the warm phase, G7: PBM applied at two points: right paw and region between L4 and L5 from the acute phase. *P < 0.05.
|
Table 2
Group 1: control (placebo), Group 2: photobiomodulation (PBM) applied to the paw with complex regional pain syndrome type I (CRPS-I) from the warm phase, Group 3: PBM applied to the paw with CRPS-I from the acute phase, Group 4: PBM applied close to the area of the region between L4 and L5 from the warm phase, Group 5: PBM applied close to the area of the region between L4 and L5 from the acute phase, Group 6: PBM applied at two points: right paw and region between L4 and L5 from the warm phase, Group 7: PBM applied at two points: right paw and region between L4 and L5 from the acute phase, 3rd: third evaluation day, 7th: seventh evaluation day, 14th: fourteenth evaluation day, 21st: twenty-first evaluation day.
![]()
2. Thermal hyperalgesia
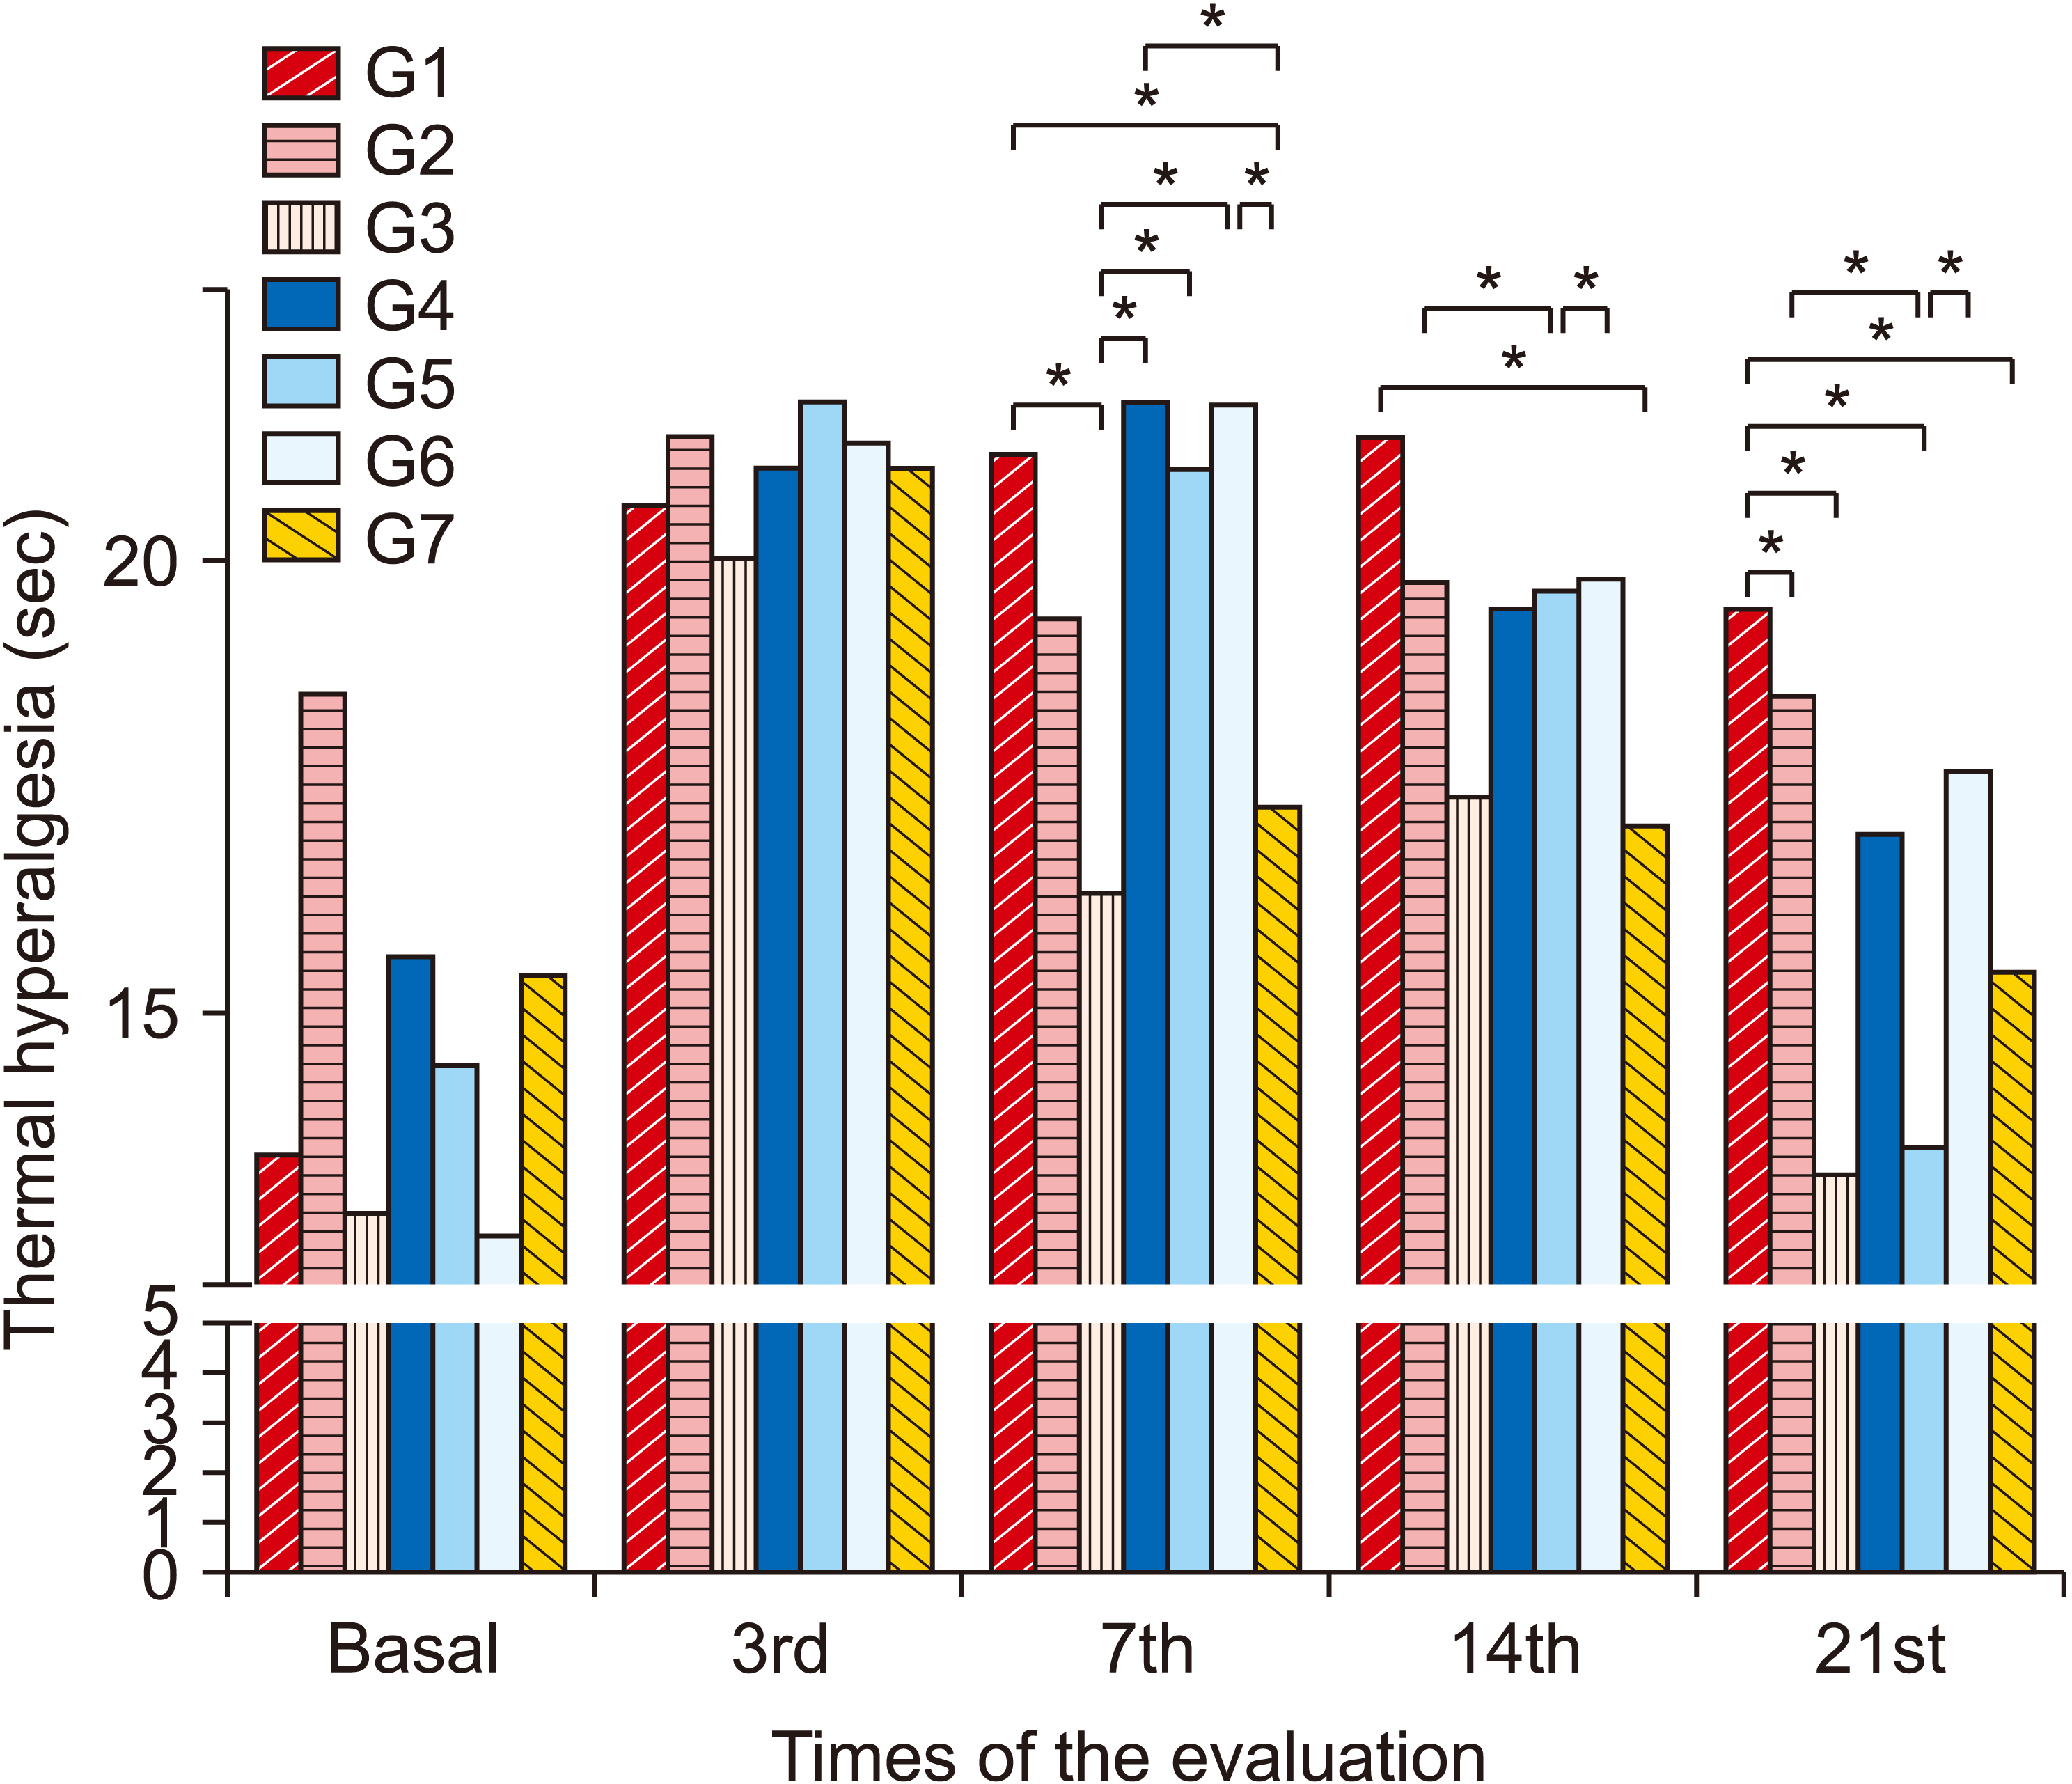 | Fig. 4Average values referring to thermal hyperalgesia between groups and evaluations. Group (G) 1: control (placebo), G2: photobiomodulation (PBM) applied to the paw with complex regional pain syndrome type I (CRPS-I) from the warm phase, G3: PBM applied to the paw with CRPS-I from the acute phase, G4: PBM applied close to the area of the region between L4 and L5 from the warm phase, G5: PBM applied close to the area of the region between L4 and L5 from the acute phase, G6: PBM applied at two points: right paw and region between L4 and L5 from the warm phase, G7: PBM applied at two points: right paw and region between L4 and L5 from the acute phase. *P < 0.05.
|
Table 3
Group 1: control (placebo), Group 2: photobiomodulation (PBM) applied to the paw with complex regional pain syndrome type I (CRPS-I) from the warm phase, Group 3: PBM applied to the paw with CRPS-I from the acute phase, Group 4: PBM applied close to the area of the region between L4 and L5 from the warm phase, Group 5: PBM applied close to the area of the region between L4 and L5 from the acute phase, Group 6: PBM applied at two points: right paw and region between L4 and L5 from the warm phase, Group 7: PBM applied at two points: right paw and region between L4 and L5 from the acute phase, 3rd: third evaluation day, 7th: seventh evaluation day, 14th: fourteenth evaluation day, 21st: twenty-first evaluation day.
![]()
3. Mechanical hyperalgesia
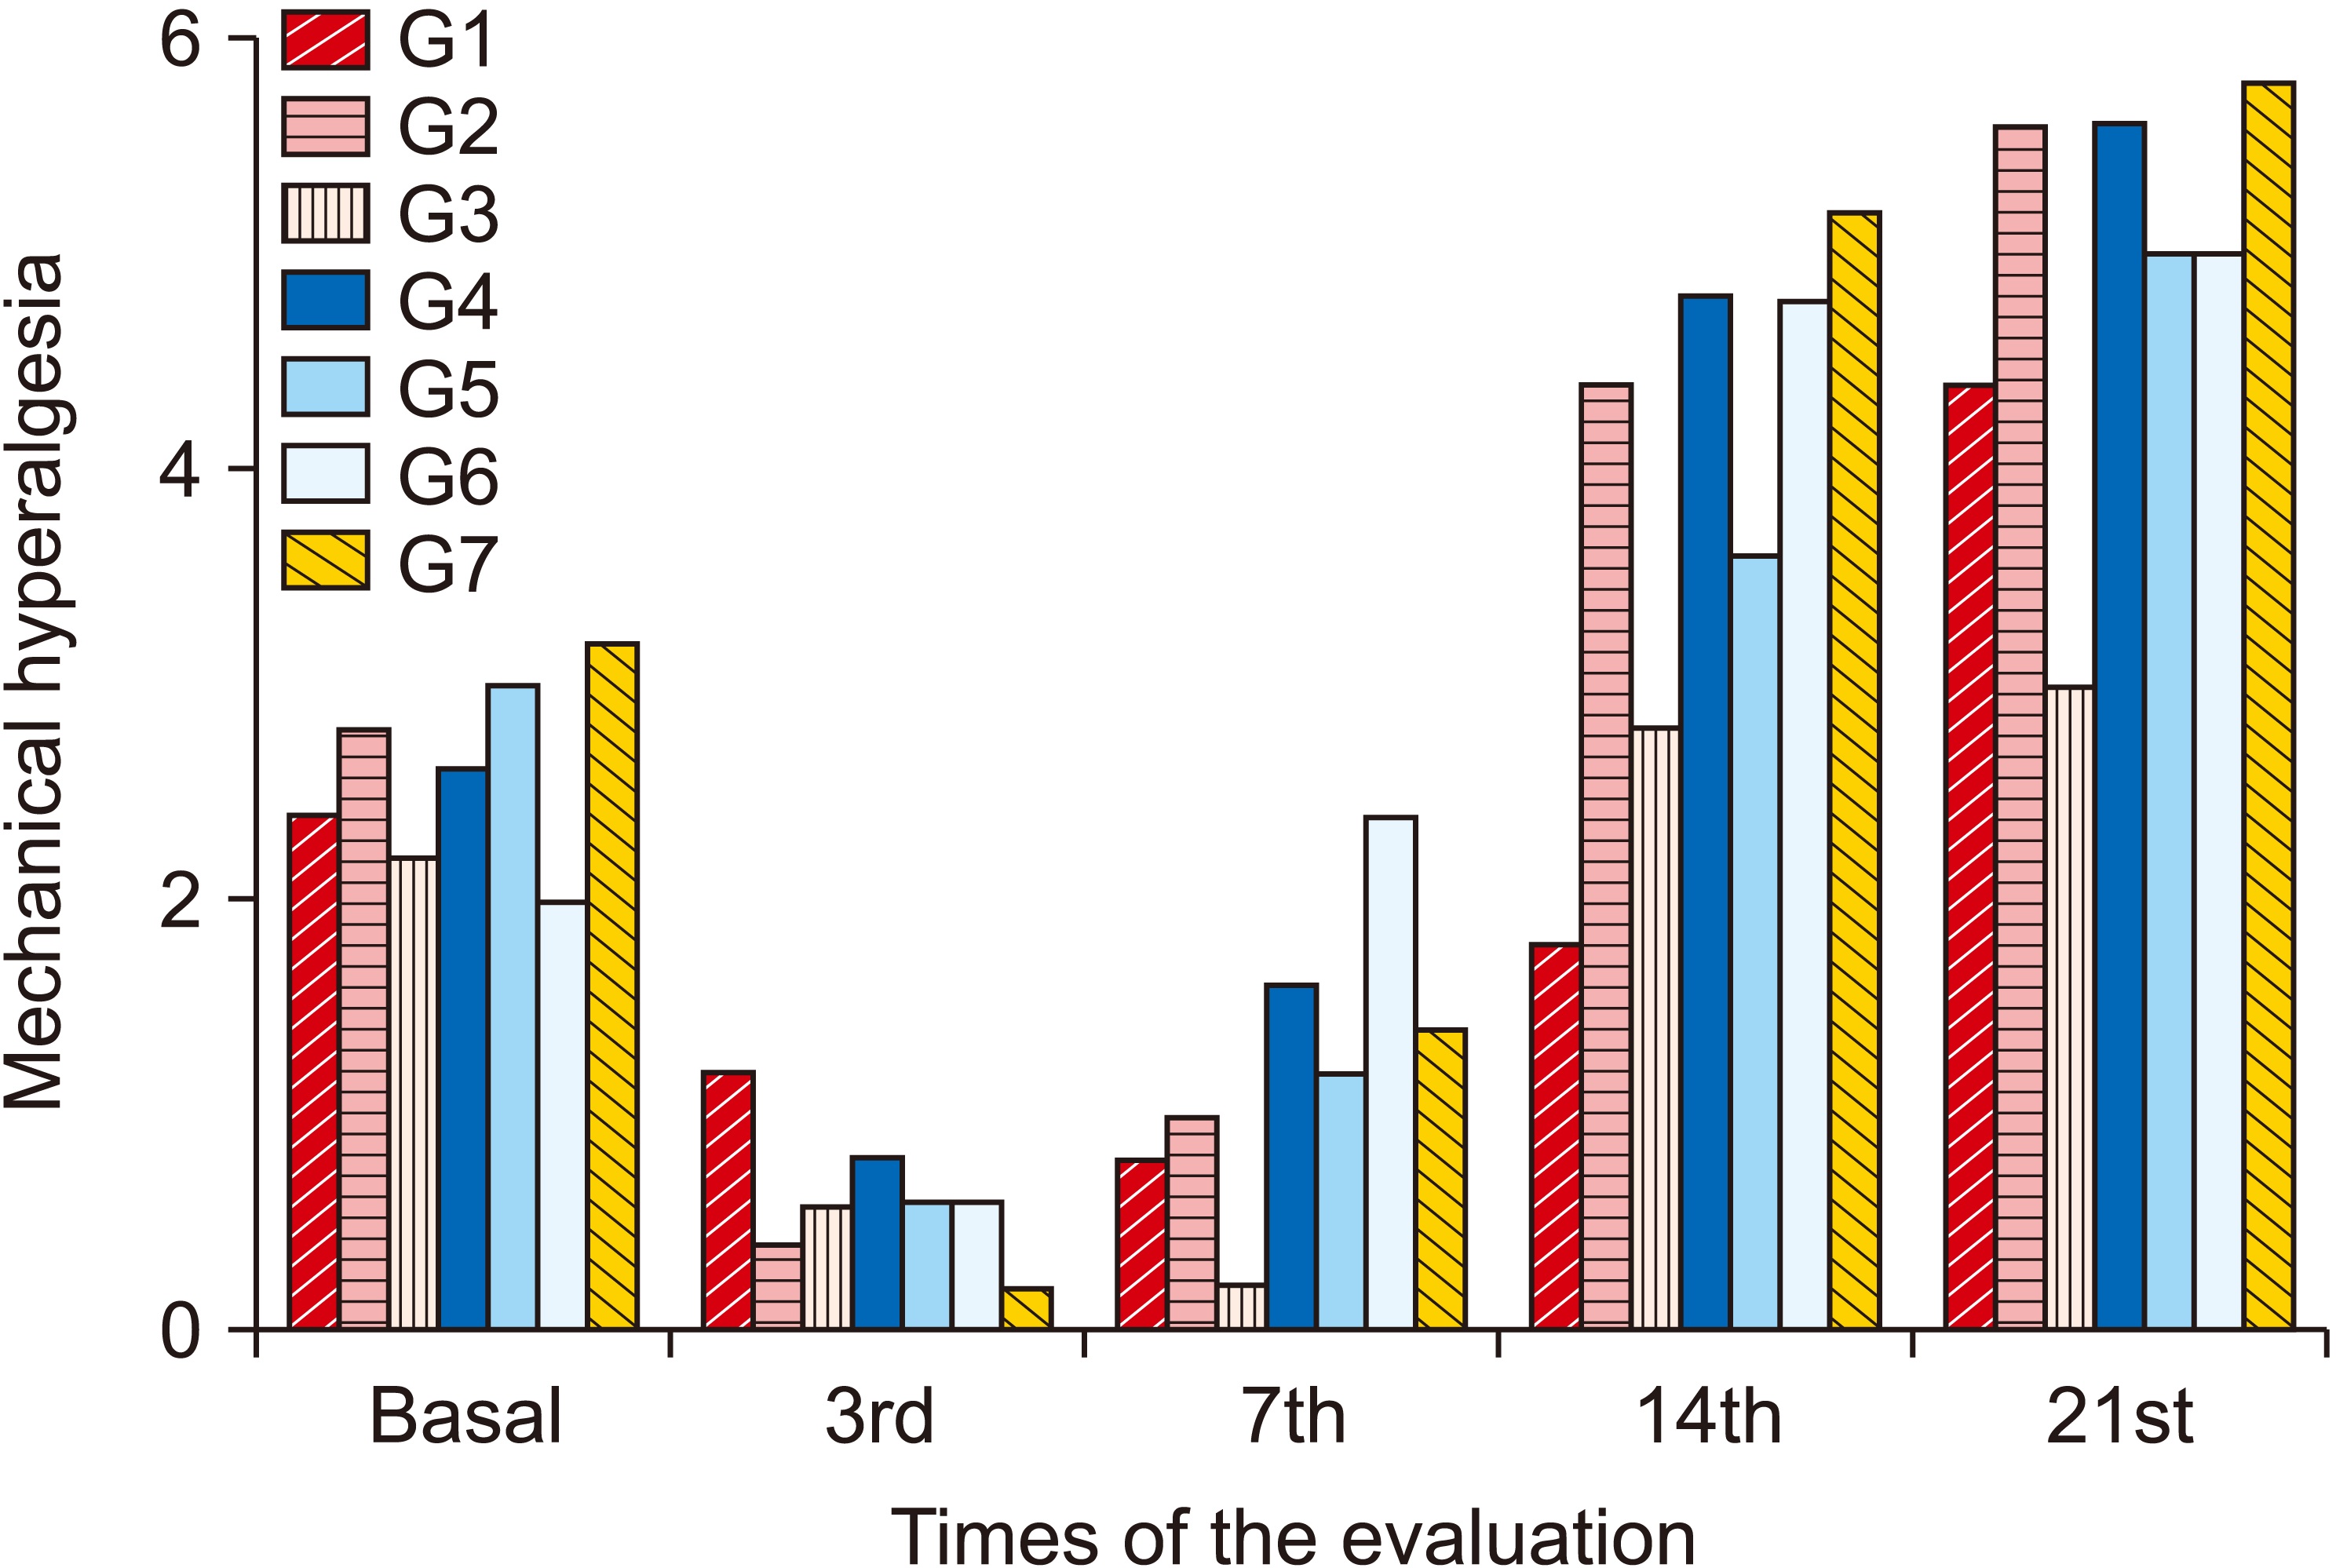 | Fig. 5Average values of the mechanical hyperalgesia test (Von Frey) between groups and evaluations. Group (G) 1: control (placebo), G2: photobiomodulation (PBM) applied to the paw with complex regional pain syndrome type I (CRPS-I) from the warm phase, G3: PBM applied to the paw with CRPS-I from the acute phase, G4: PBM applied close to the area of the region between L4 and L5 from the warm phase, G5: PBM applied close to the area of the region between L4 and L5 from the acute phase, G6: PBM applied at two points: right paw and region between L4 and L5 from the warm phase, G7: PBM applied at two points: right paw and region between L4 and L5 from the acute phase.
|
Table 4
Group 1: control (placebo), Group 2: photobiomodulation (PBM) applied to the paw with complex regional pain syndrome type I (CRPS-I) from the warm phase, Group 3: PBM applied to the paw with CRPS-I from the acute phase, Group 4: PBM applied close to the area of the region between L4 and L5 from the warm phase, Group 5: PBM applied close to the area of the region between L4 and L5 from the acute phase, Group 6: PBM applied at two points: right paw and region between L4 and L5 from the warm phase, Group 7: PBM applied at two points: right paw and region between L4 and L5 from the acute phase, 3rd: third evaluation day, 7th: seventh evaluation day, 14th: fourteenth evaluation day, 21st: twenty-first evaluation day.
![]()
4. Thermography
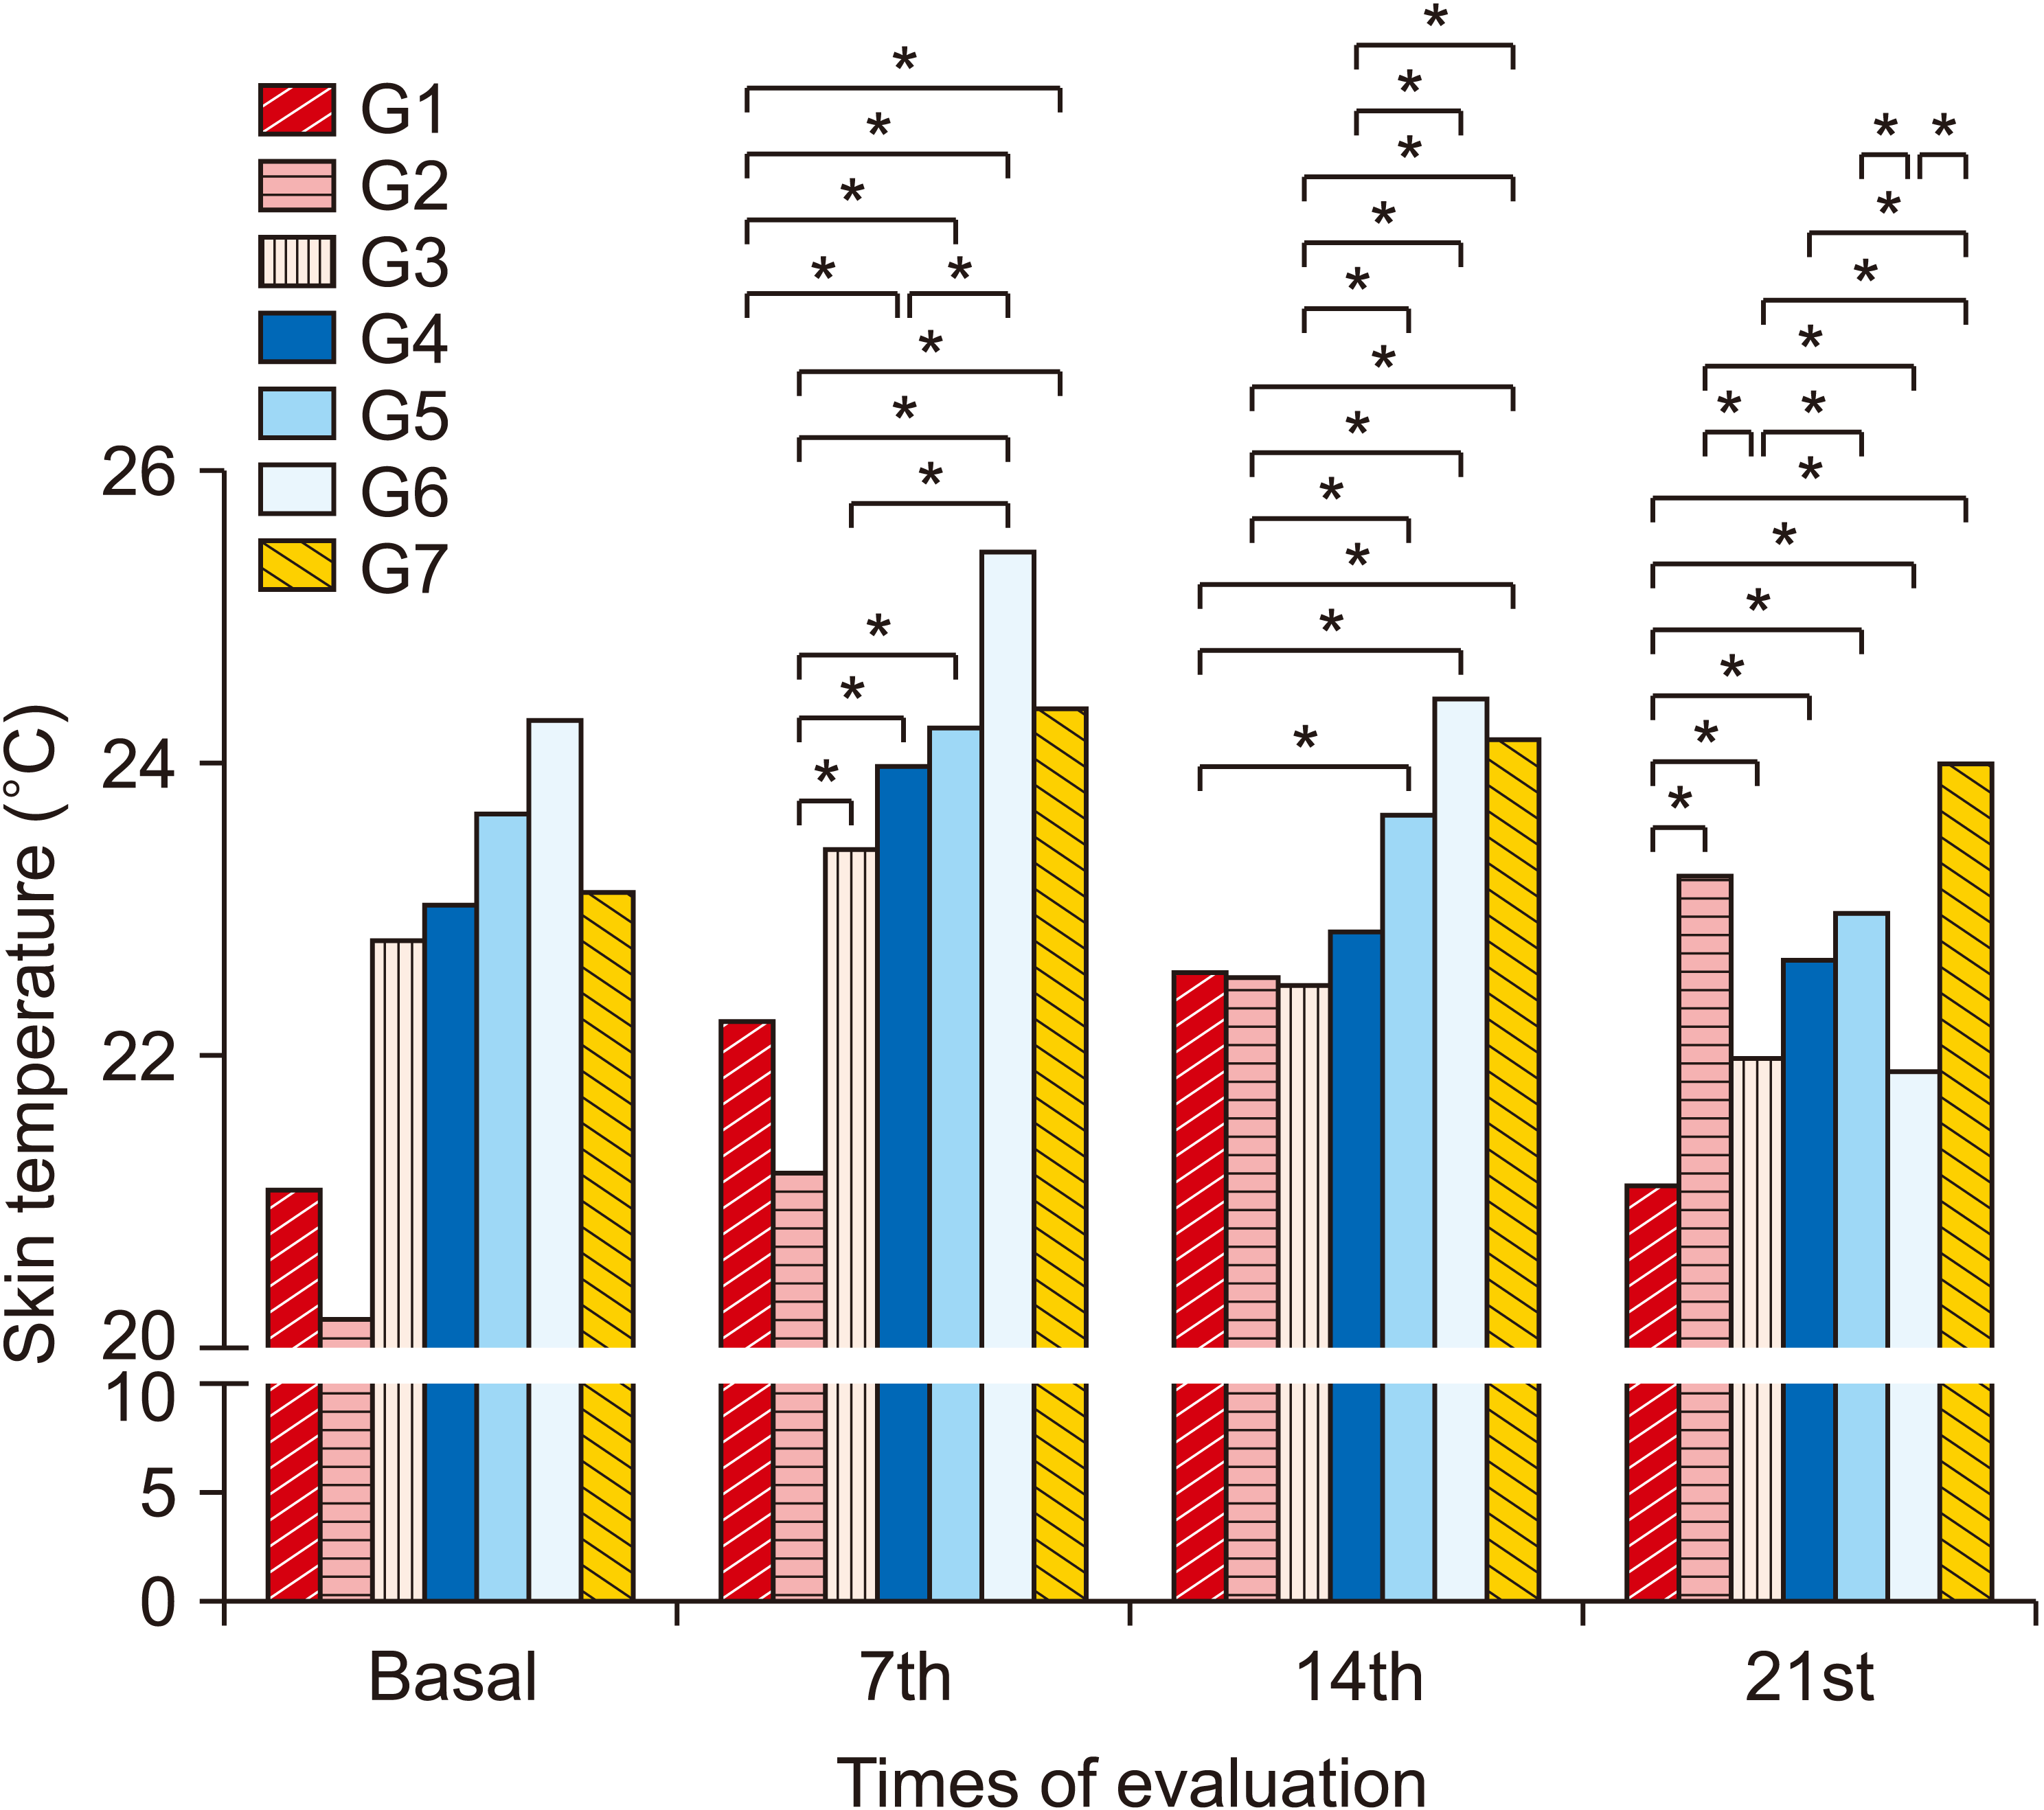 | Fig. 6Average values of the thermographic evaluation between groups and evaluations. Group (G) 1: control (placebo), G2: photobiomodulation (PBM) applied to the paw with complex regional pain syndrome type I (CRPS-I) from the warm phase, G3: PBM applied to the paw with CRPS-I from the acute phase, G4: PBM applied close to the area of the region between L4 and L5 from the warm phase, G5: PBM applied close to the area of the region between L4 and L5 from the acute phase, G6: PBM applied at two points: right paw and region between L4 and L5 from the warm phase, G7: PBM applied at two points: right paw and region between L4 and L5 from the acute phase. *P < 0.05.
|
Table 5
Group 1: control (placebo), Group 2: photobiomodulation (PBM) applied to the paw with complex regional pain syndrome type I (CRPS-I) from the warm phase, Group 3: PBM applied to the paw with CRPS-I from the acute phase, Group 4: PBM applied close to the area of the region between L4 and L5 from the warm phase, Group 5: PBM applied close to the area of the region between L4 and L5 from the acute phase, Group 6: PBM applied at two points: right paw and region between L4 and L5 from the warm phase, Group 7: PBM applied at two points: right paw and region between L4 and L5 from the acute phase, 3rd: third evaluation day, 7th: seventh evaluation day, 14th: fourteenth evaluation day, 21st: twenty-first evaluation day.
![]()
5. SSI and SFI
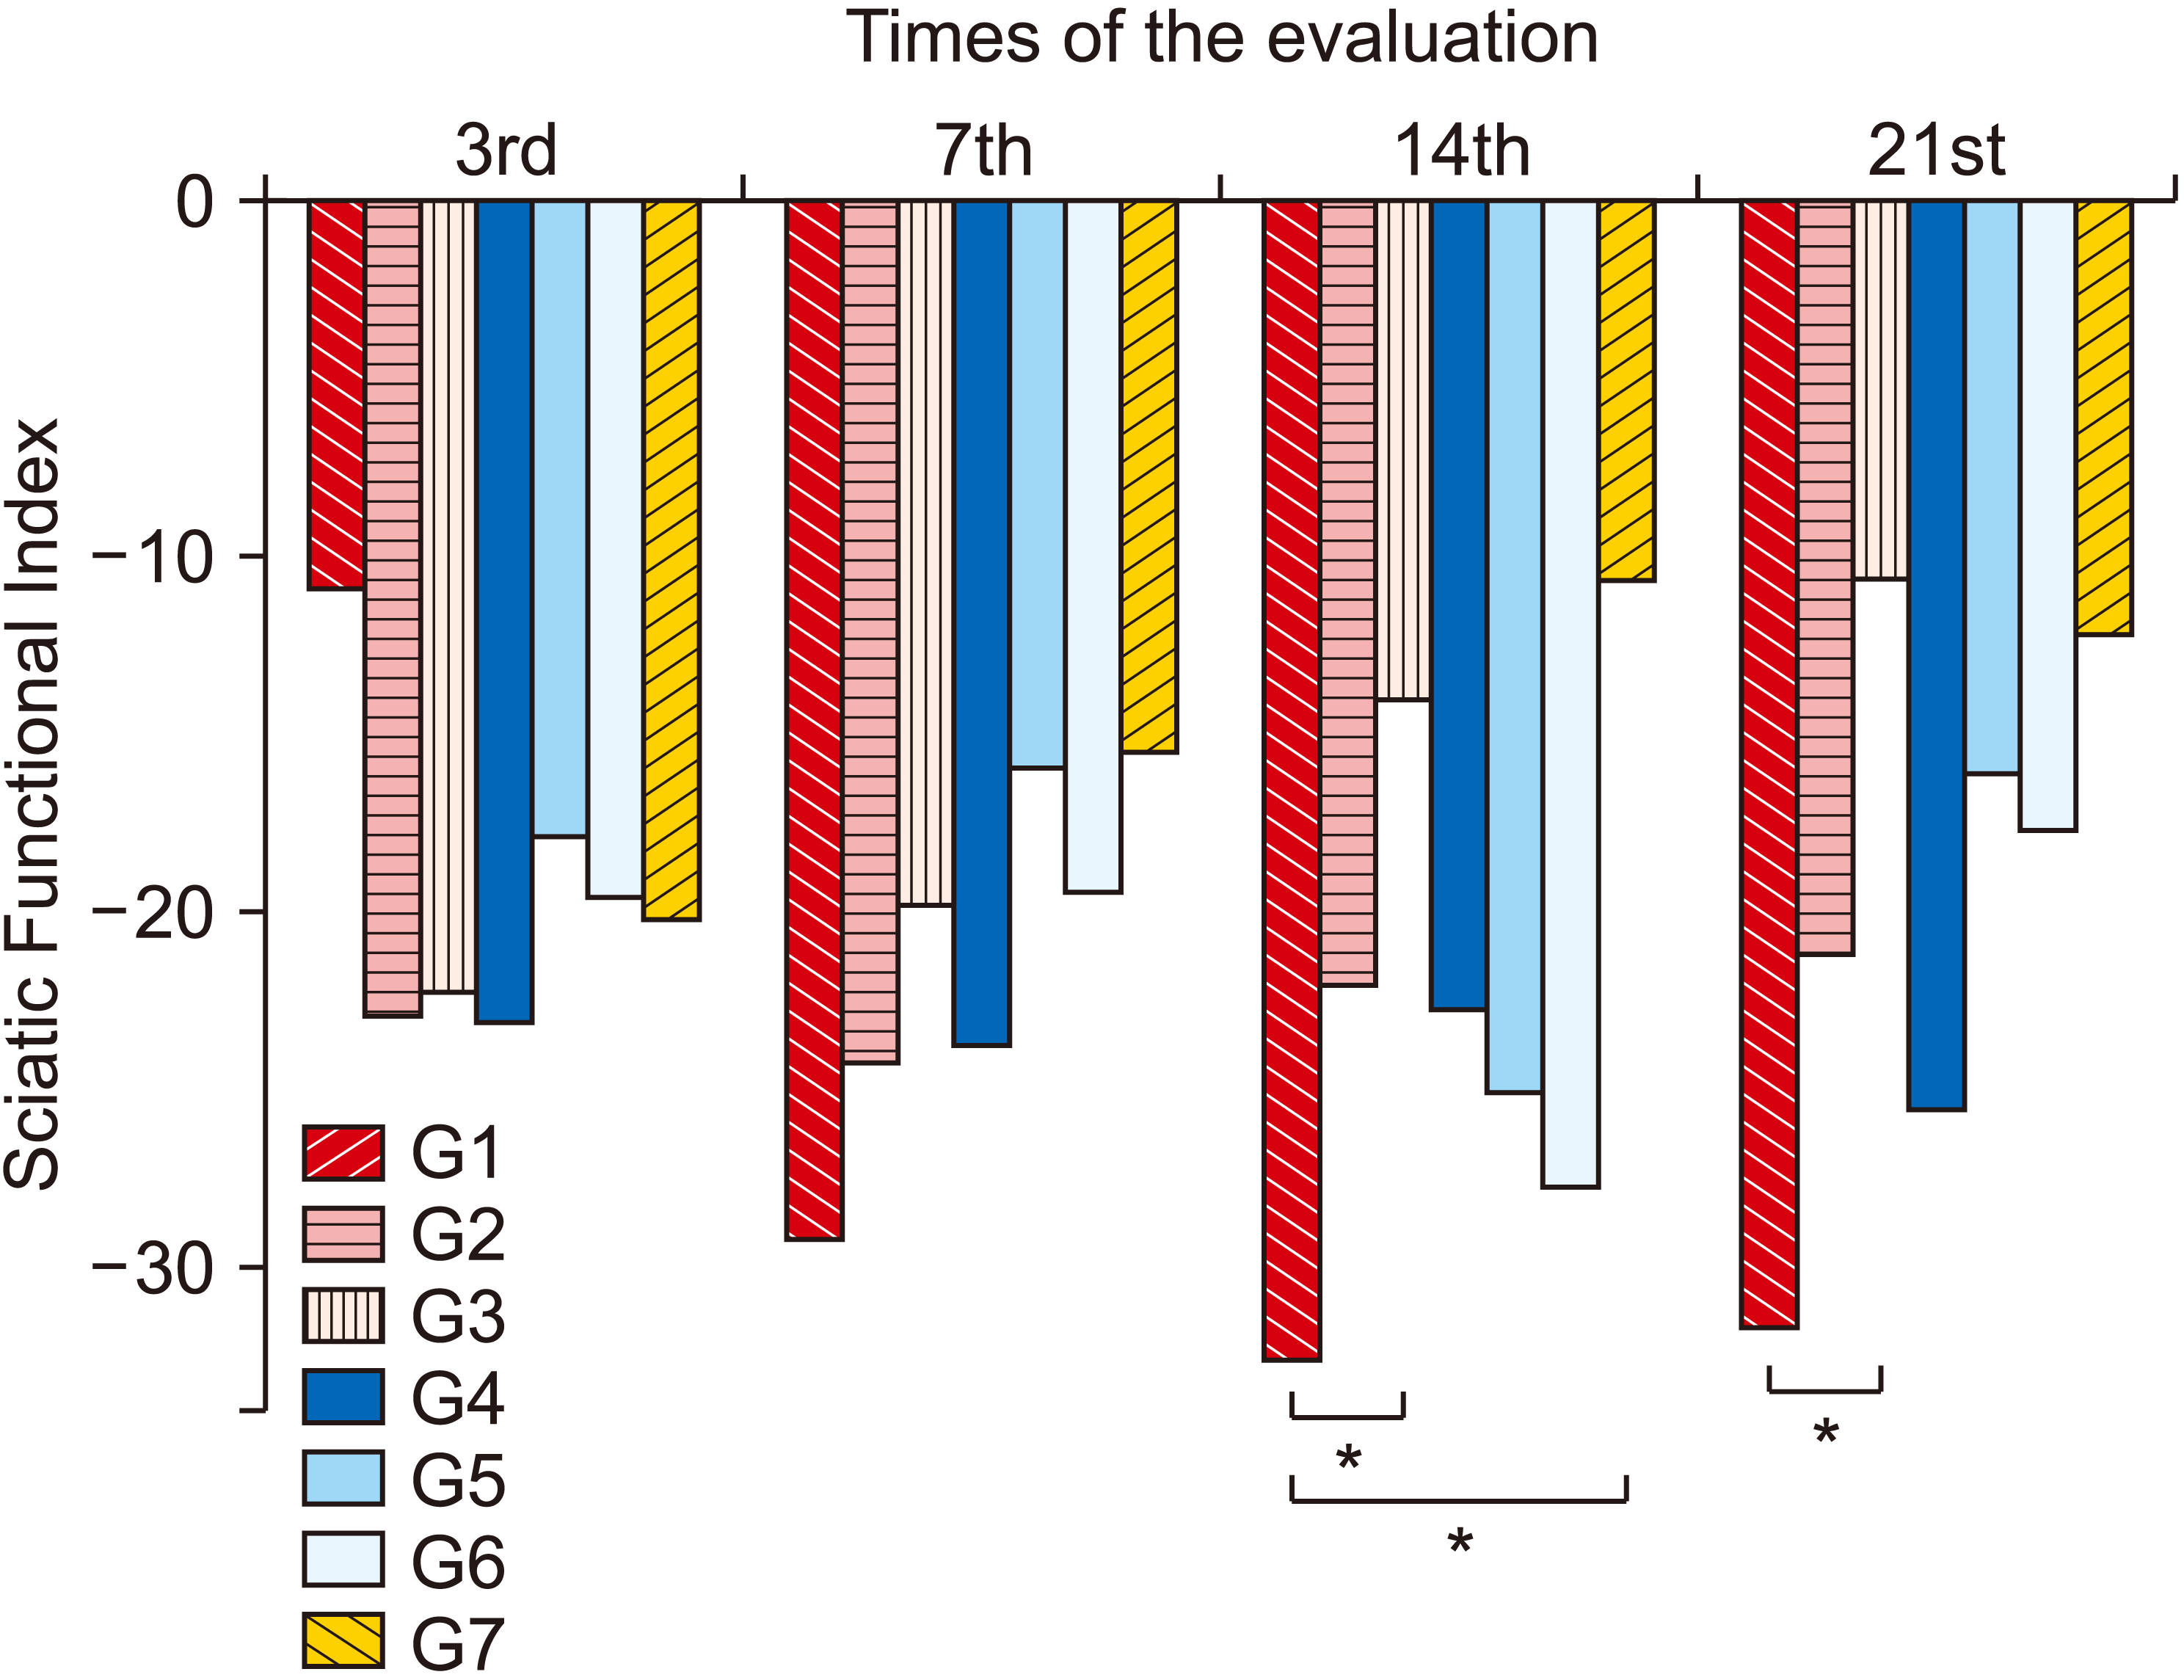 | Fig. 7Average values of Sciatic Functional Index (SFI) between groups and between evaluations. Group (G) 1: control (placebo), G2: photobiomodulation (PBM) applied to the paw with complex regional pain syndrome type I (CRPS-I) from the warm phase, G3: PBM applied to the paw with CRPS-I from the acute phase, G4: PBM applied close to the area of the region between L4 and L5 from the warm phase, G5: PBM applied close to the area of the region between L4 and L5 from the acute phase, G6: PBM applied at two points: right paw and region between L4 and L5 from the warm phase, G7: PBM applied at two points: right paw and region between L4 and L5 from the acute phase. *P < 0.05.
|
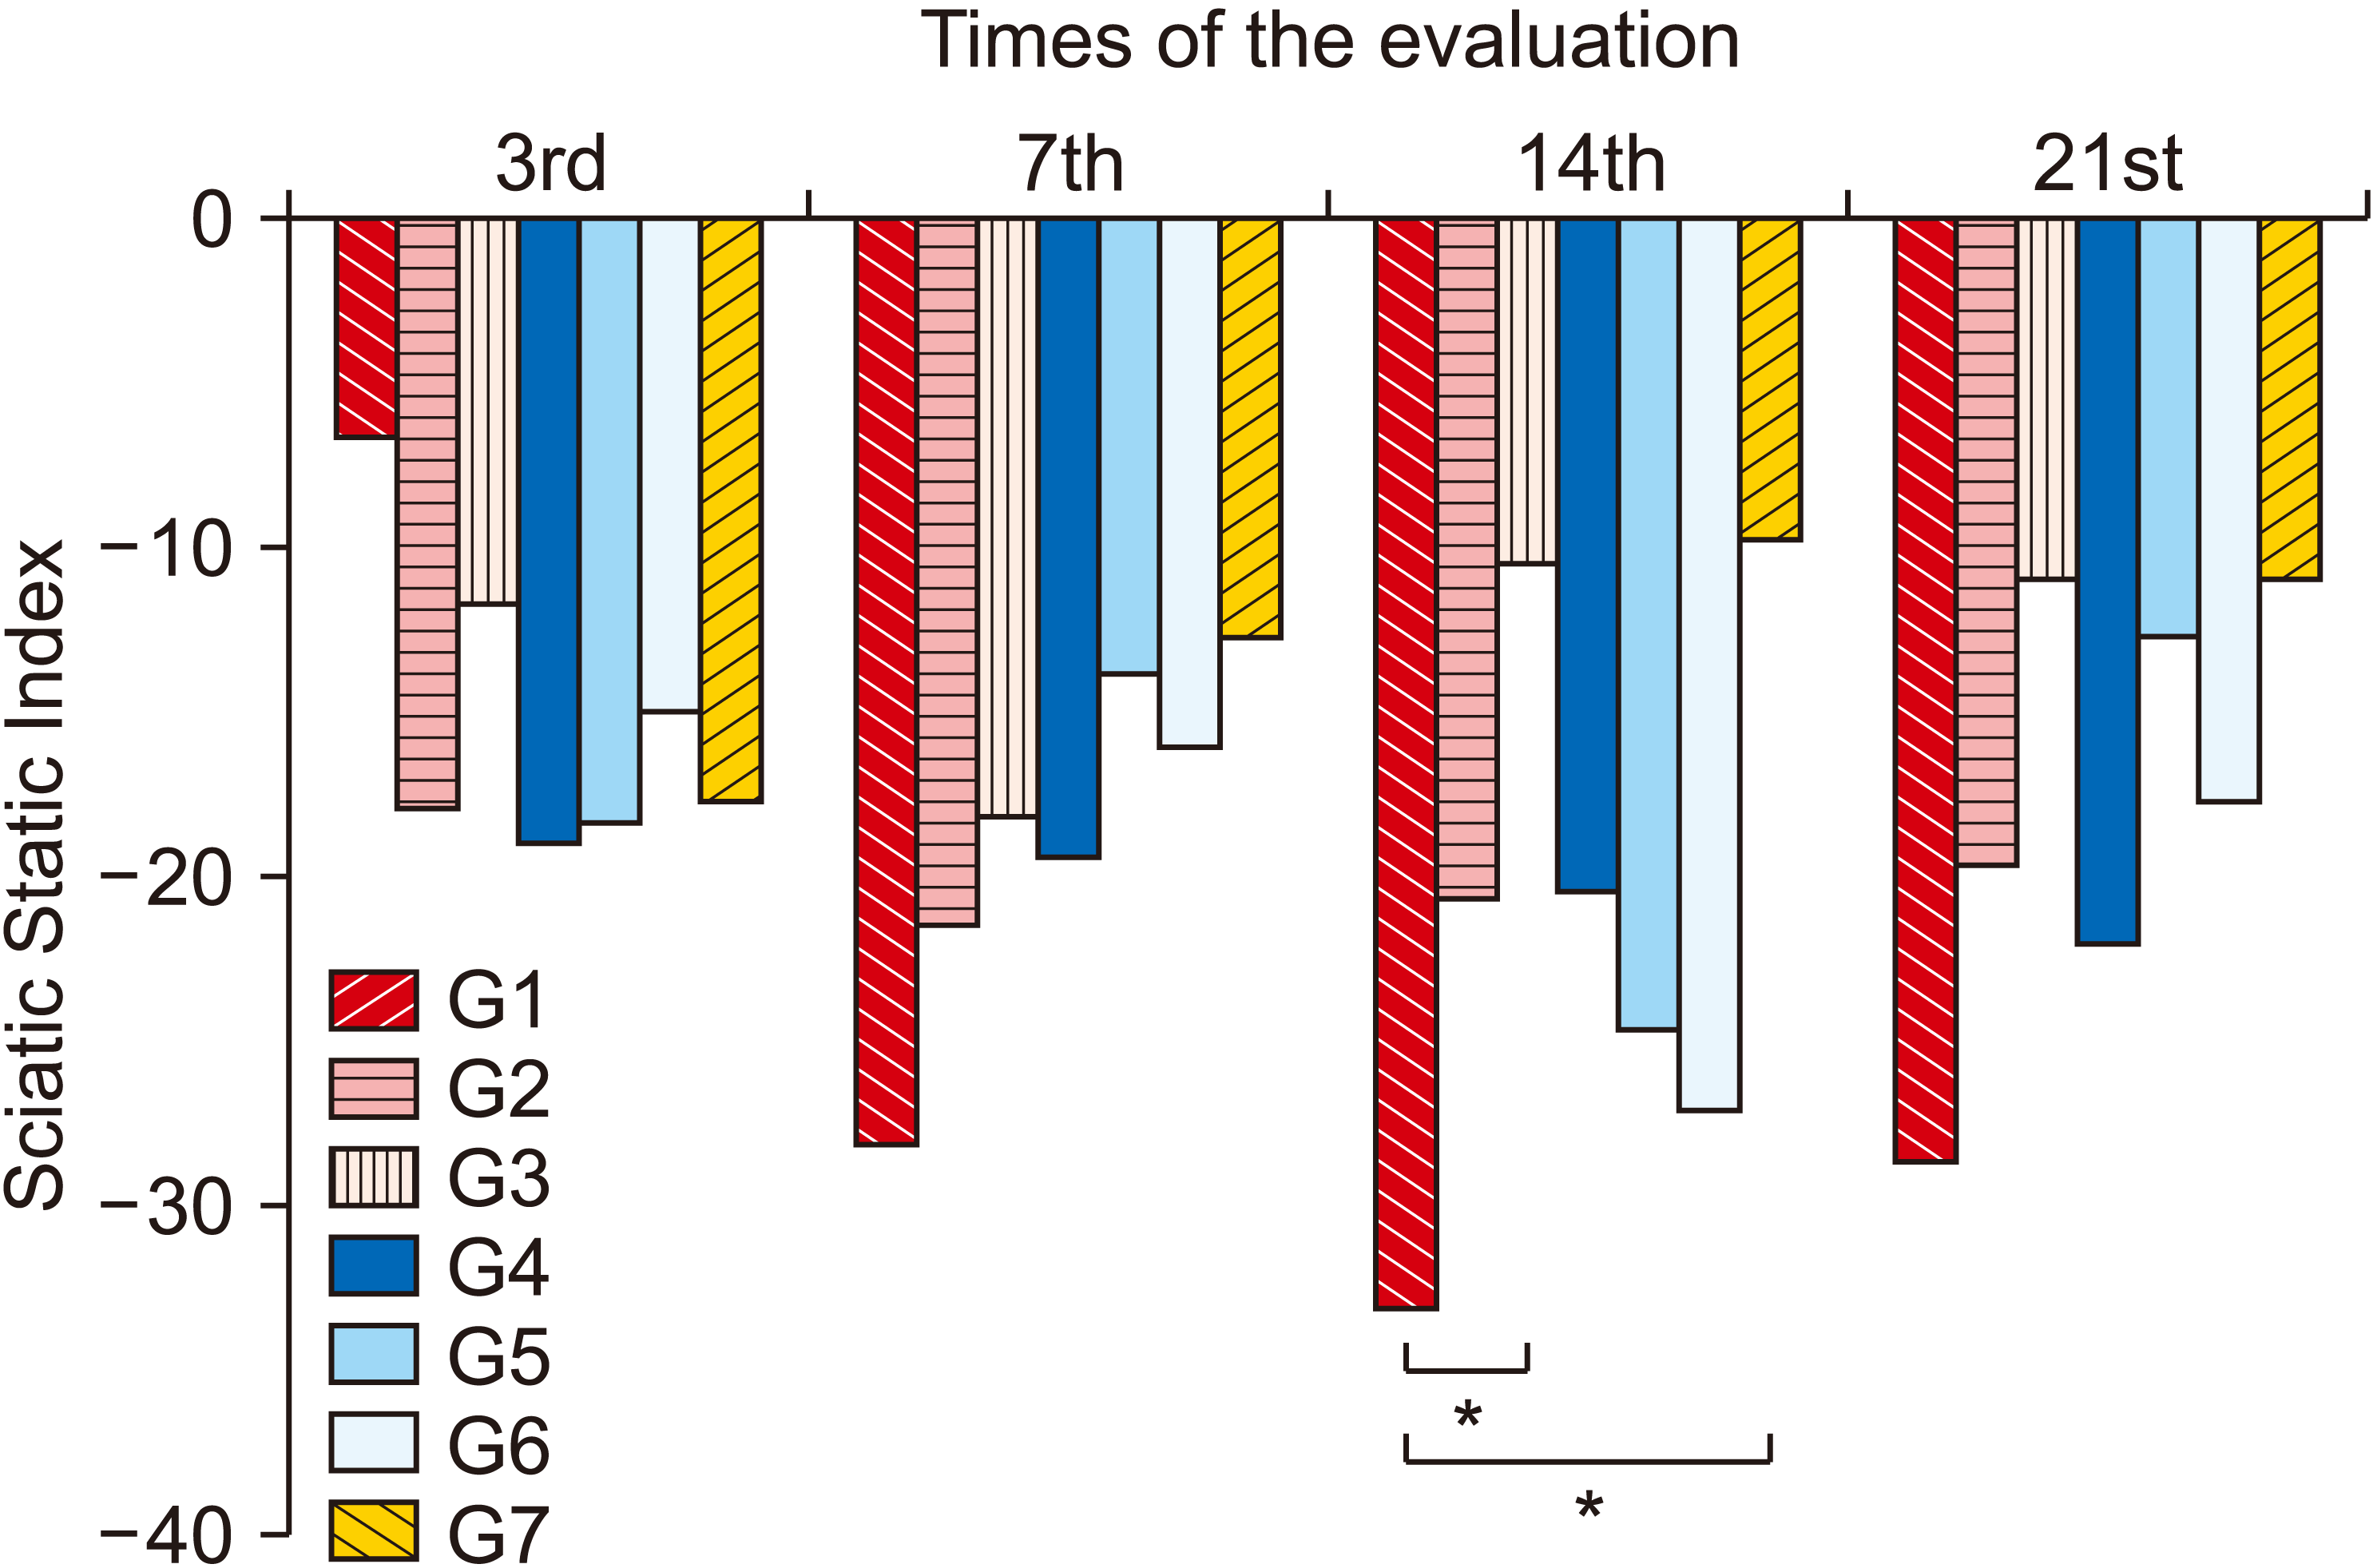 | Fig. 8Average values of Sciatic Static Index (SSI) between groups and between evaluations. Group (G) 1: control (placebo), G2: photobiomodulation (PBM) applied to the paw with complex regional pain syndrome type I (CRPS-I) from the warm phase, G3: PBM applied to the paw with CRPS-I from the acute phase, G4: PBM applied close to the area of the region between L4 and L5 from the warm phase, G5: PBM applied close to the area of the region between L4 and L5 from the acute phase, G6: PBM applied at two points: right paw and region between L4 and L5 from the warm phase, G7: PBM applied at two points: right paw and region between L4 and L5 from the acute phase. *P < 0.05.
|
Table 6
Group 1: control (placebo), Group 2: photobiomodulation (PBM) applied to the paw with complex regional pain syndrome type I (CRPS-I) from the warm phase, Group 3: PBM applied to the paw with CRPS-I from the acute phase, Group 4: PBM applied close to the area of the region between L4 and L5 from the warm phase, Group 5: PBM applied close to the area of the region between L4 and L5 from the acute phase, Group 6: PBM applied at two points: right paw and region between L4 and L5 from the warm phase, Group 7: PBM applied at two points: right paw and region between L4 and L5 from the acute phase, 3rd: third evaluation day, 7th: seventh evaluation day, 14th: fourteenth evaluation day, 21st: twenty-first evaluation day.
![]()
 XML Download