INTRODUCTION
MATERIALS AND METHODS
1. Animals
2. Experimental timeline
3. Punch biopsy
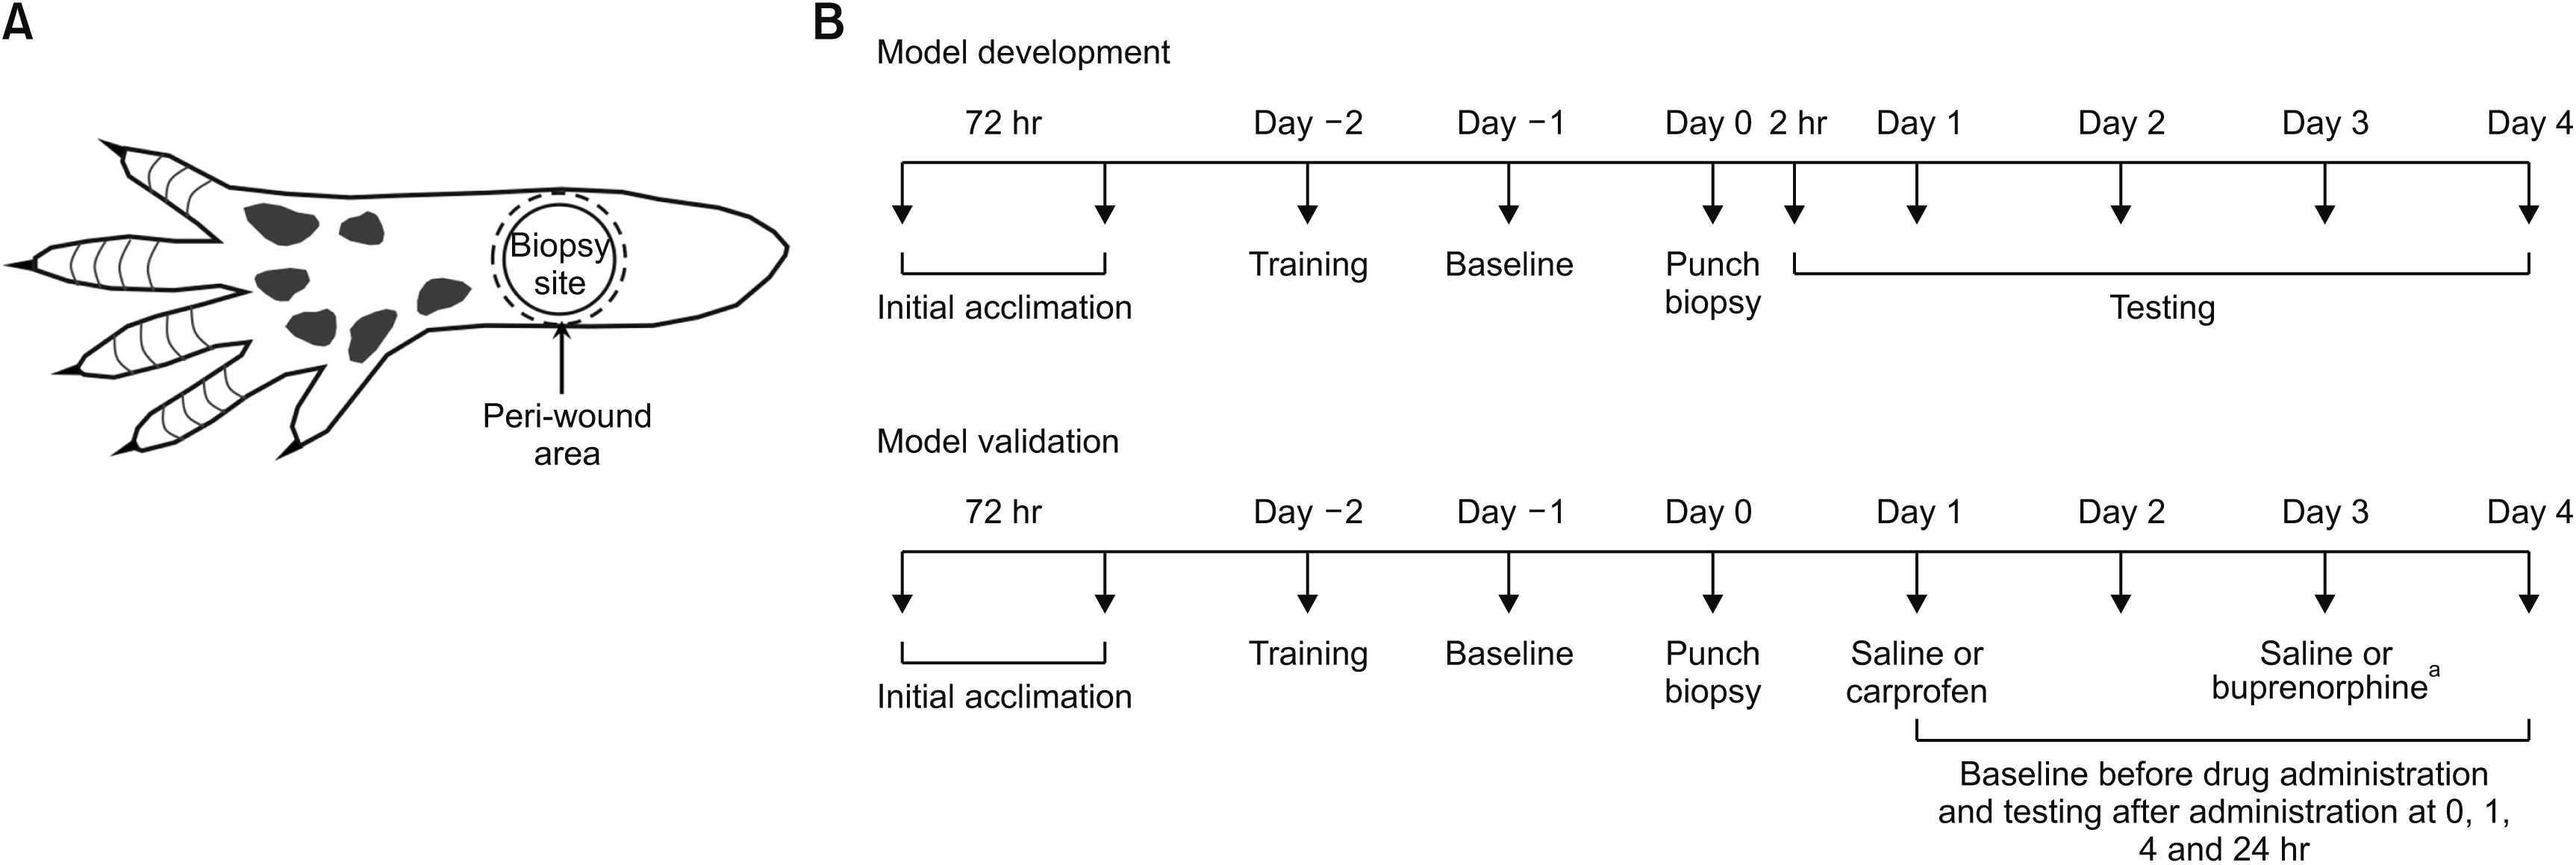 | Fig. 1(A) Schematic of the plantar side of the rat hind paw showing the punch biopsy site (5 mm diameter) and peri-wound stimulation areas. (B) Timelines for development (upper panel) and validation (lower panel) experiments in the excisional wound pain model in rats. Excisional wounds were generated by punch biopsy of the skin of the hind paw, followed by pain behavioral testing at different time points. The rats used for the validation experiments were also treated with carprofen or buprenorphine in a crossover manner. aSaline on day 1 and buprenorphine on day 3 or carprofen on day 1 and saline on day 3. |
4. Mechanical stimulation
5. Thermal stimulation
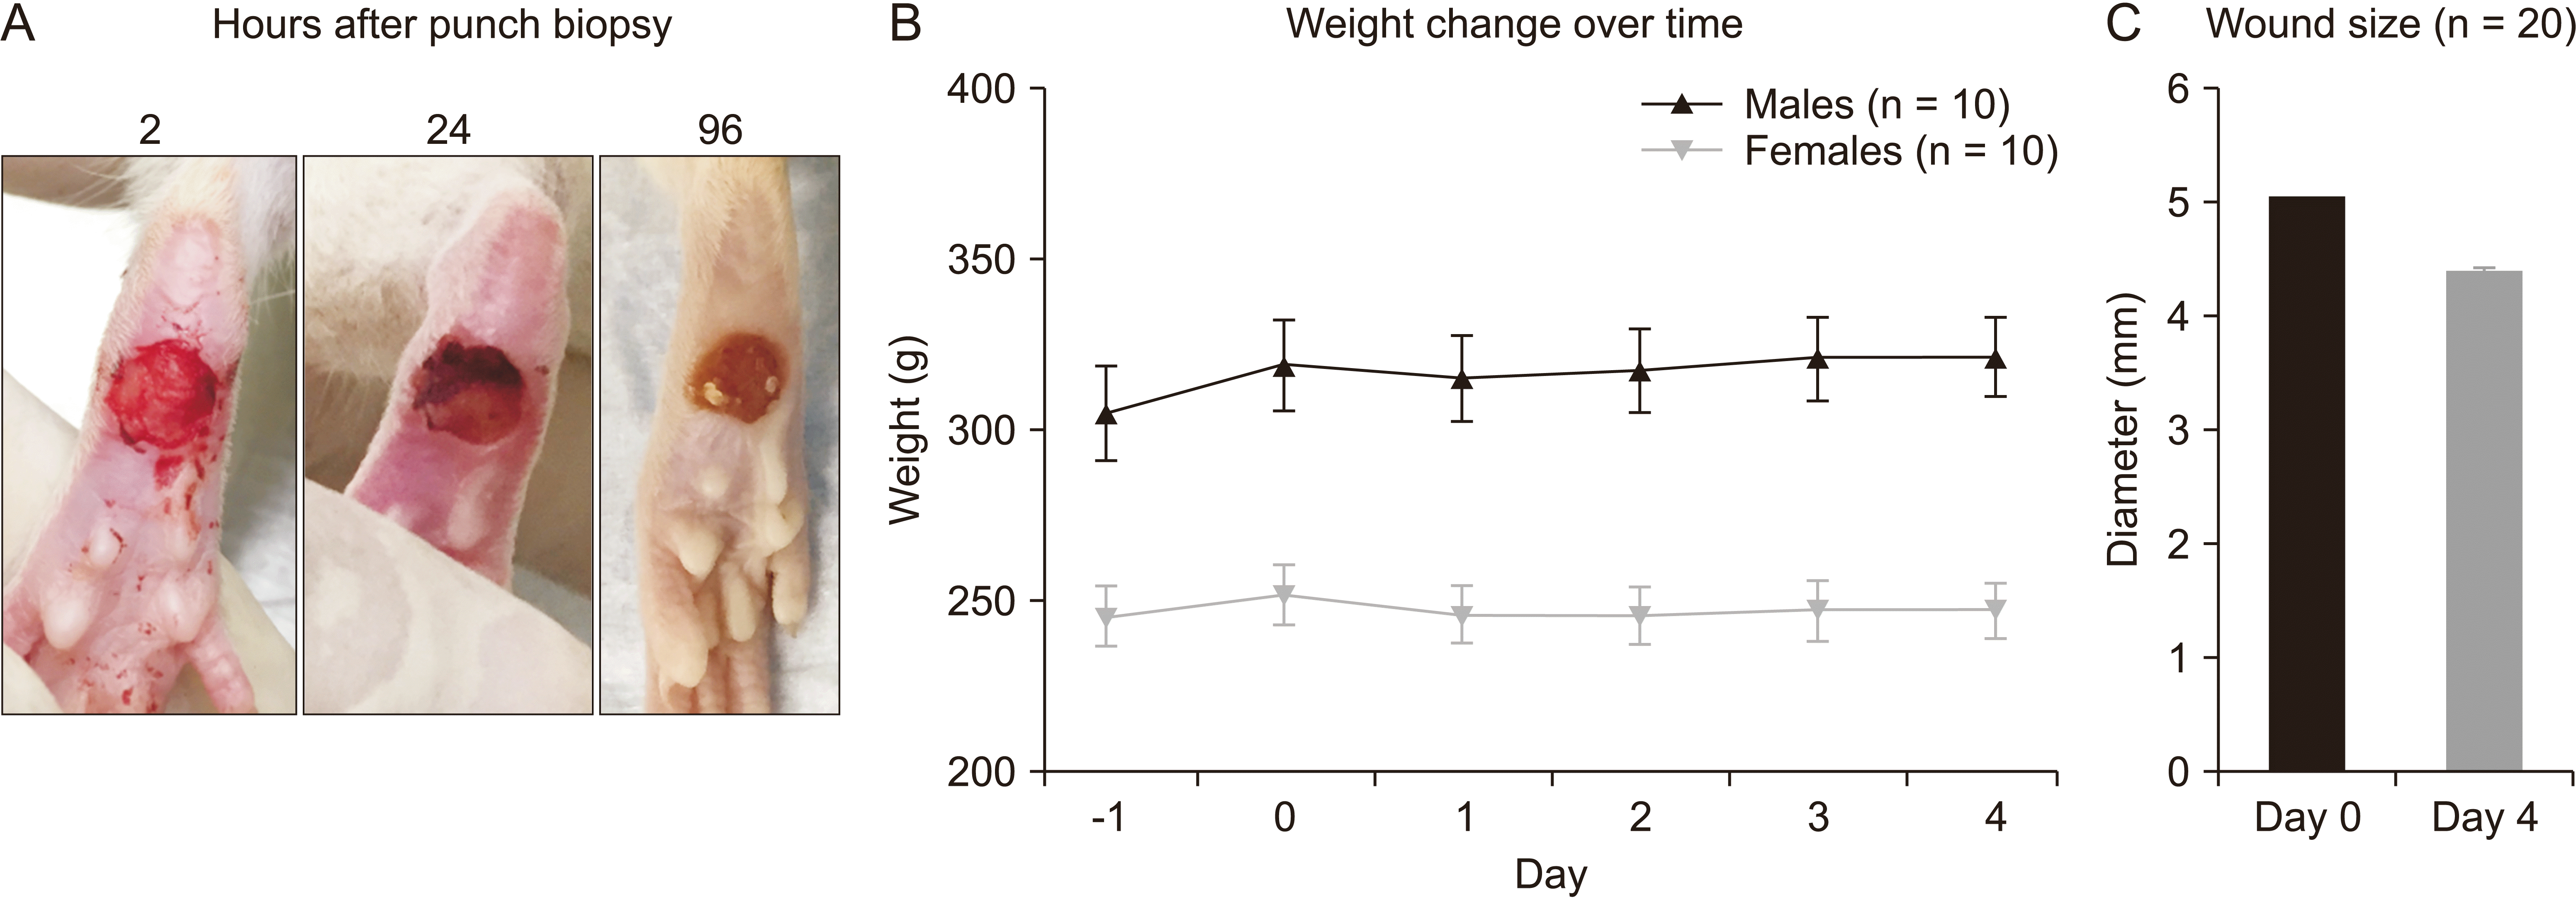 | Fig. 2(A) Representative images of the state of the excisional wound at 2, 24, and 96 hours after punch biopsy. (B) Average body weight over the course of the experiment (n = 20 rats per group). (C) Average wound size change from day of biopsy to end of study (n = 40 rats total). The error bars indicate standard error of the mean. |
6. Guarding behavior
7. HPWD
8. Model validation and drug administration
9. Statistical analysis
RESULTS
1. Excisional wound pain model development
1) Mechanical stimulation
 | Fig. 3Responses at baseline and 2-96 hours post punch biopsy for injured and uninjured paw. (A) Force to withdrawal using von Frey filaments (including peri-wound area). Statistical comparisons were done using ordinary two-way analysis of variance (ANOVA) followed by Sidak’s post-hoc test (a repeated measures approach was not possible due to two missing values). (B) Time to withdrawal during thermal stimulation. Statistical comparisons were done using repeated-measures two-way ANOVA followed by Sidak’s post-hoc test. (C) Guarding behavior for the injured paw. (D) Percentage of body weight exerted on injured paw vs. uninjured paw. Statistical comparisons for (C) and (D) were done using repeated-measures one-way ANOVA followed by Sidak’s post-hoc test. N = 8 rats per group. The error bars indicate standard error of the mean. BW: before wounding. *, **, ***P ≤ 0.049, 0.011, 0.001, respectively. |
2) Thermal stimulation
3) Guarding behavior
4) HPWD
2. Validation of the excisional wound model
1) Effect of carprofen on evoked pain responses
 | Fig. 4The effect of a single dose of carprofen (solid) or saline (open) on responses to von Frey (A) and thermal stimulation (B) in the injured (red) and uninjured (green) paws (dosing 24 hours post punch biopsy). Statistical comparisons were done using repeated-measures two-way analysis of variance followed by Sidak’s post-hoc test. The dotted line inside the graph indicates the time of drug administration. N = 6 rats per group. The error bars indicate standard error of the mean. BW: before wounding, BL (24 hr): baseline at 24 hours after wounding. *, **P ≤ 0.049, and 0.011, respectively. |
2) Effect of buprenorphine evoked and non-evoked pain responses
 | Fig. 5The effect of a single dose of buprenorphine (solid) or saline (open) on responses to von Frey (A) and thermal stimulation (B) in the injured (red) and uninjured (green) paws (C) guarding behavior for the injured paw and (D) percentage of body weight exerted on injured paw vs. uninjured paw (dosing 72 hours post punch biopsy). Statistical comparisons were done using repeated-measures two-way analysis of variance followed by Tukey’s post-hoc test for A and B and followed by Sidak’s post-hoc test for (C) and (D). The dotted line inside the graph indicates the time of drug administration. N = 6 rats per group. The error bars indicate standard error of the mean. BW: before wounding, BL (72 hr): baseline at 72 hours after wounding. ***P < 0.001. |


 PDF
PDF Citation
 Print
Print


 XML Download