Journal List > Korean J Pain > v.34(2) > 1159260

AminiLari, Ashoorian, Caldwell, Rahman, Nieuwlaat, Busse, and Mbuagbaw: The quality of subgroup analyses in chronic pain randomized controlled trials: a methodological review

Abstract

The quality of subgroup analyses (SGAs) in chronic non-cancer pain trials is uncertain. The purpose of this study was to address this issue. We conducted a comprehensive search in MEDLINE and EMBASE from January 2012 to September 2018 to identify eligible trials. Two pairs of reviewers assessed the quality of the SGAs and the credibility of subgroup claims using the 10 criteria developed by Sun et al. in 2012. The associations between the quality of the SGAs and the studies’ characteristics including risk of bias, funding sources, sample size, and the latest impact factor, were assessed using multivariable logistic regression. Our search retrieved 3,401 articles of which 66 were eligible. The total number of SGAs was 177 of which 52 (29.4%) made a subgroup claim. Of these, only 15 (8.5%) were evaluated as being of high quality. Among the 30 SGAs that claimed subgroup effects using an appropriate method of performing interaction tests, the credibility of only 5 were assessed as high. None of the subgroup claims met all the credibility criteria. No significant association was found between the quality of SGAs and the studies’ characteristics. The quality of the SGAs performed in chronic pain trials was poor. To enhance the quality of SGAs, scholars should consider the developed criteria when designing and conducting trials, particularly those which need to be specified a priori.

INTRODUCTION

Chronic non-cancer pain (CNCP) refers to pain not due to cancer lasting more than three months [1]. CNCP is a disabling health condition which is highly prevalent and affects approximately 28% of people globally [2]. Randomized controlled trials (RCTs) aim to provide reliable evidence on the efficacy and adverse effects of interventions in general patient populations [3]. However, clinical decisions often depend on individual patient characteristics. Those conducting trials often perform subgroup analyses (SGAs), defined as evaluating the treatment effects in specific subgroups of patients or interventions, to indicate whether the observed treatment effect is altered by baseline characteristics of the study population [4,5]. SGAs thus play a significant role in suggesting the appropriateness of an intervention for a specific patient population and addresses the clinical need for individually based guidelines. They can also inform future studies by determining whether specific baseline prognostic factors may impact outcome measures of interest. However, the practical potential of SGAs can only be realized if an SGA is rigorous in its design and interpretation, as its results may be misleading if incorrectly performed [6].
Numerous criteria have been developed to evaluate the quality of SGAs. Firstly, it is necessary to evaluate if the treatment effect varies across subgroup categories. Since appropriate statistical tests can only identify the extent to which chance explains a study’s results and not other factors, performing SGAs without testing for interactions is not a valid technique. More importantly, the lack of a priori subgroup hypotheses, and the direction of these interactions can inflate type I error by allowing for multiple hypotheses testing and enhancing the chance of producing spurious subgroup effects [6,7].
Within the literature, it has been found that subgroup claims are often subsequently shown to be incorrect, and that the credibility of subgroup effects is usually low [4]. Notably, a methodological review conducted in the field of chronic back pain found the credibility of subgroup claims to be low [8].
Within the CNCP field, many RCTs have performed SGAs to assess the treatment effects across different subgroups. However, the quality of these analyses and the credibility of the claimed subgroup effects are relatively unknown [8]. There are explicit criteria to help determine the credibility of subgroup effects [4,9,10]. Applying these criteria to CNCP trials, that report SGAs, can help inform the quality of SGAs in this field.
As such, the primary objective of this review was to describe the quality and the credibility of the SGAs conducted in CNCP trials through evaluating their satisfaction of the criteria developed by Sun et al. [4] for assessing the validity of SGAs. Our secondary objective was to explore the associations between studies’ characteristics, including risk of bias, funding sources, sample size, and the latest impact factor with the quality of SGAs.

MATERIALS AND METHODS

1. Inclusion criteria

In this study, we included RCTs that were carried out in humans for the management of CNCP. We did not apply restrictions on the basis of study design (parallel, crossover, factorial), number of trial arms, unit of randomization, type of study, study sample size, or category of outcome. To meet inclusion criteria, the RCTs needed to have included one or more SGAs, with or without a subgroup claim. Conference abstracts and publications which were not in English were excluded. The included studies were indexed in MEDLINE and EMBASE from January 2012 to September 2018.

2. Search strategy

An extensive and predefined search strategy (Appendix 1) of MEDLINE and EMBASE was conducted from January 2012 to September 2018, using the OVID platform. The strategy’s search terms included both MeSH headings and free texts for “subgroup analysis”, “chronic pain”, “ neuropathic pain ”, “intervention”, “treatment”, “management”, and “randomized controlled trials”.

3. Selection of the eligible studies

Two reviewers (MA and VA), independently and in duplicate, screened titles, and abstracts in the field of pain management to detect citations that were RCTs in humans that performed at least one SGA. For the purposes of this study, we defined an SGA as a statistical analysis that explored whether the effects of an intervention differed according to a sub-group variable. Subsequently, the reviewers, independently and in duplicate, screened the full text of all potentially eligible trials to determine if they met the study’s inclusion criteria such as reporting at least one SGA, claiming a subgroup effect using an interaction test, reporting a P value for a subgroup effect, and the magnitude of difference in the effect between patient subgroups.

4. Data extraction and management

The data extraction form was created and developed by the principal investigator. At the stage of full text screening, the principal investigator, along with two other reviewers trained in research methodology (MA&VA-MA&YR), extracted information independently and in duplicate from the eligible RCTs. The extracted data included 1) the year of publication, 2) the funding sources, 3) the journal name and latest impact factor (mostly the Thomson Reuters Impact Factor), 4) the trial design, 5) the trial type, 6) the type of participants, 7) the type of intervention and its comparator, 8) the primary outcome(s) and secondary outcome(s), 9) the follow-up duration, 10) the sample size, and 11) the treatment effect for the primary outcome prior to performing the SGA. In the studies that were published as post-hoc analyses of trials, we used additional resources cited in the included studies, such as published or registered protocols and main trials, to make a more rigorous judgment regarding the quality of the SGAs and the risk of bias assessments.

5. Quality of SGAs

Two pairs of reviewers recorded the number of SGAs performed in each RCT. We assessed the quality and credibility of the SGAs reported using the 10 criteria mentioned above [4]. We assessed the quality of SGAs when the trial performed an SGA but concluded a negative result, and when the trial performed an SGA using an interaction test and claimed a subgroup effect. Due to the various conditions encountered, the following guidelines were developed for the number of criteria considered to evaluate the SGAs:
  • 1) When the trial performed an interaction test and the result was positive (subgroup effect was reported or claimed), all 10 criteria were assessed (credibility).

  • 2) When the trial performed an interaction test and the result was negative (no subgroup effect claimed), 6 criteria were assessed (criteria # 1 to #5 and #7 were applicable).

  • 3) When the trial did not perform an interaction test but reported a positive result (subgroup effect was reported, or the authors reported that the effect appeared larger in one subgroup than another, but acknowledged the fact that they didn’t have the power to detect an interaction effect, and therefore these results were considered to be hypothesis generating), 8 criteria were assessed (criteria #5 and #6 were not applicable).

  • 4) When the trial did not perform an interaction test and reported a negative result (no subgroup effect), only the first 4 criteria were assessed.

It should be noted that the first item reflects “credibility”, and the next three items reflect the “quality” of SGAs. The quality of all SGAs reported in each study was coded based on the detailed instructions established by Sun et al. [4], which were used in previous studies (Appendix 2). Each criterion was scored as 1 if the answer to the item was “yes” (criterion met) and 0 if the answer was “no” (criterion not met). We only assessed the SGA for the pain-related primary outcome and the last follow-up time. If pain was not the primary outcome, we considered the SGA for the primary outcome in addition to the SGA for the most relevant outcome to pain among the secondary outcomes.
Depending on the number of criteria assessed, we scored each SGA between 0 to 10, 0 to 8, 0 to 6, or 0 to 4. We conventionally classified the quality of each SGA based on the proportion of criteria met as high-quality (60% or more) or low quality (less than 60%).
We specifically assessed the credibility of SGAs for those studies which claimed a subgroup effect after performing an interaction test.

6. Risk of bias

Reviewers assessed the risk of bias for included RCTs, independently and in duplicate, using a modified Cochrane risk of bias instrument [11,12]. All disagreements in different stages were resolved by reaching a consensus or consulting with a third reviewer (LM).

7. Data analysis

We used descriptive statistics to summarize and calculate the proportion of trials reporting at least one SGA or claiming a subgroup effect. We also calculated the proportion of SGAs (those which claimed a subgroup effect) meeting each credibility criterion and the number of criteria met by each SGA.
The normality and homogeneity of variance assumptions for continuous outcomes (e.g., functional scores) was verified using the Shapiro–Wilk test and Levene’s test, respectively. We performed multivariable linear regression models to assess the potential associations between the quality of the SGAs (as a continues variable) and pre-specified study characteristics including the risk of bias (low-risk vs. high-risk based on the overall judgment of the reviewers), funding sources (industry and non-industry), sample size (small vs. large), and the latest impact factor (as a continues variable). A theory-driven approach was used to build the final multivariable regression model and select the most influential predictor variables. We dichotomized the studies’ sample sizes based on the median of this variable into two groups: above and below the median.
To control for the impact of potential multicollinearity issues between the covariates, we calculated the variance inflation factor (VIF) of all variables included in the final models. A VIF of 10 or above (a tolerance of 0.1) was considered as multicollinearity.
To run the regression models, since some of the studies had performed more than one SGA with the same approach to analyzing subgroup effects, we included only one SGA with the highest score in the quality assessment from each study in the regression model. Through applying this approach we limited our analysis to including 66 SGAs, which was equal to the number of studies included. The goodness of fit for the models was also evaluated using the Hosmer–Lemeshow test [13]. Agreement between reviewers regarding: 1) the quality of SGAs, 2) the use of the interaction test, and 3) the risk of bias assessment was calculated using the Cohen’s Kappa statistic. We considered the kappa values of 0-0.20, 0.21-0.40, 0.41-0.60, and 0.61-0.80 as indicating slight, fair, moderate, and substantial agreement, respectively. Values of more than 0.80 were regarded as almost perfect agreement [14]. All analyses were performed using SPSS software version 24 (IBM Co., Armonk, NY).

8. Sample size

To perform the linear regression analysis, we calculated the total number of RCTs that would need to be included. According to Harris and Quade [15], as the rule of thumb for multivariable linear regression analyses, for five or less predictors, the number of subjects should exceed the number of independent variables by 50. For equations involving six or more predictors, an absolute number of 10 subjects per predictor is recommended. Based on these recommendations, a total sample size of at least 60 RCTs was calculated to be included in this study. Considering 4 independent variables for running linear regression models, this study, with 66 RCTs, has sufficient power to produce reliable results.

RESULTS

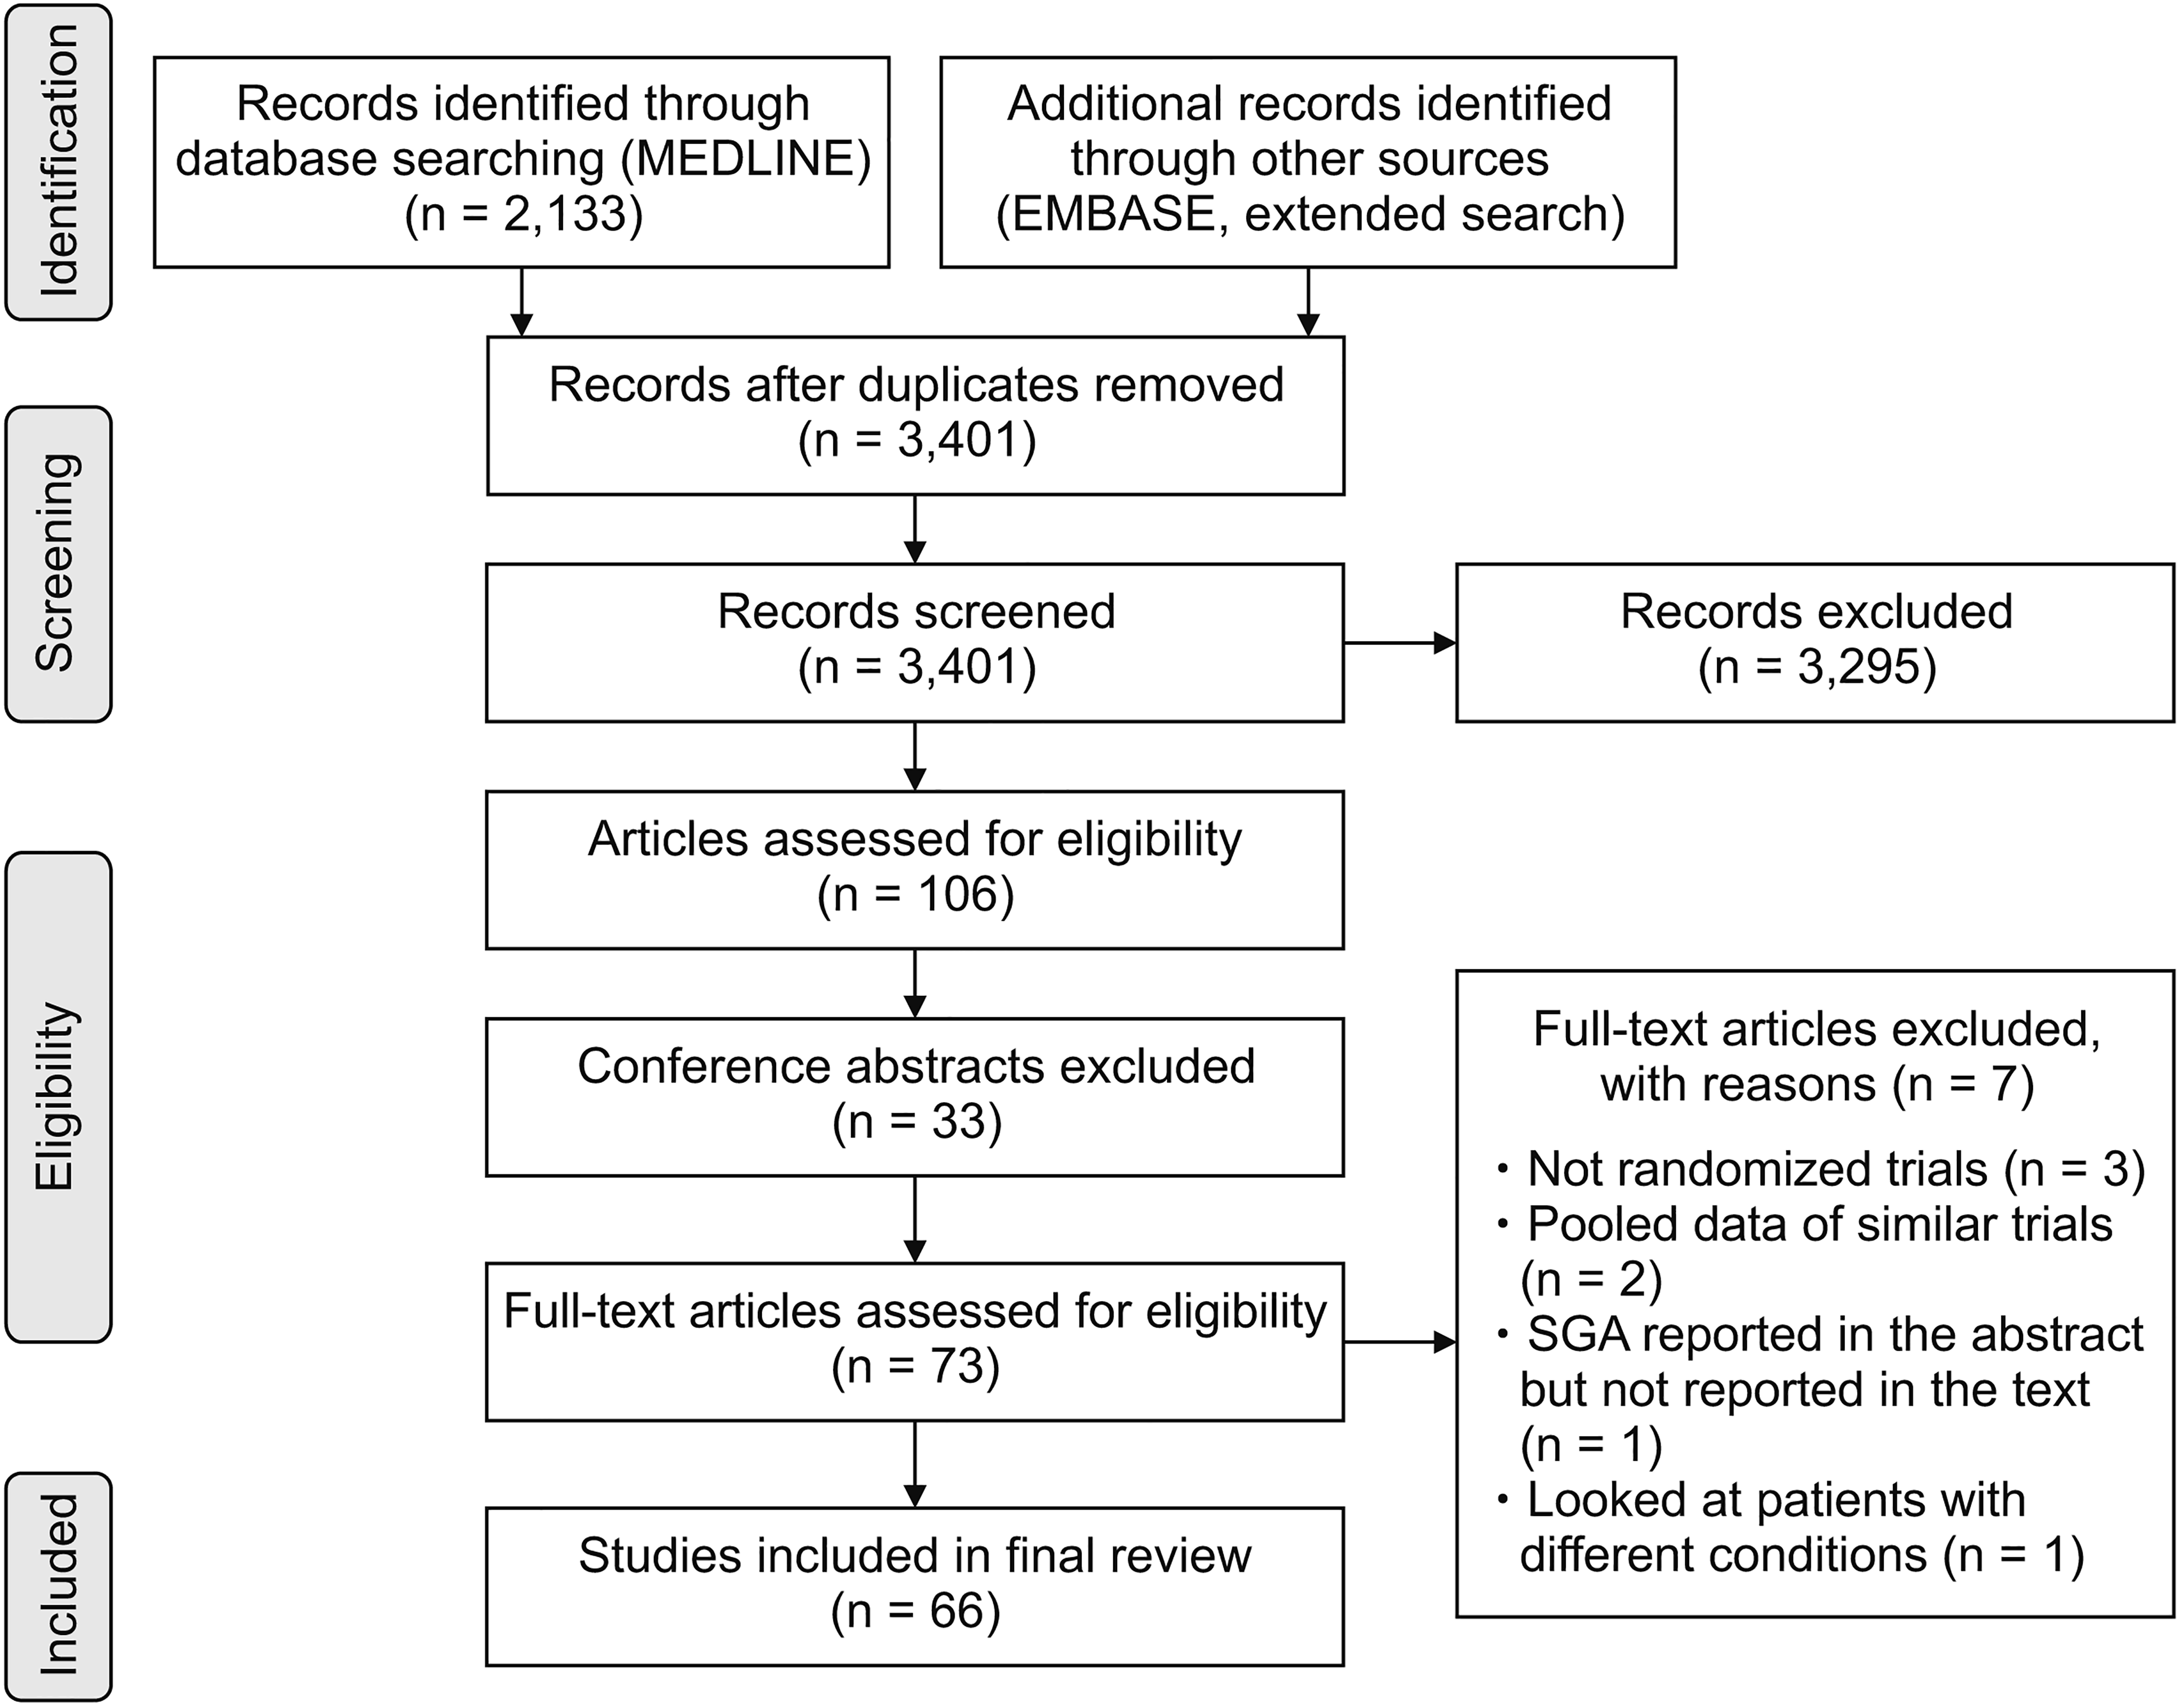
Two reviewers screened 3,401 titles and abstracts. Of these, 106 publications were potentially identified as eligible. However, 33 articles were conference abstracts, and were thus excluded (Fig. 1). The full texts of the remaining 73 studies were retrieved and screened. Sixty-six RCTs were included in the final review, based on the study’s eligibility criteria. The descriptions of included studies are reported in Table 1, Appendix 3.
The inter-rater agreements (Kappa values) for the assessment of the quality of SGAs, the determinant of subgroup claims, and the risk of bias assessment were 0.72 (95% confidence interval [CI]: 0.57-0.87), 0.76 (95% CI: 0.60-0.92), and 0.70 (95% CI: 0.51-0.89), respectively, representing substantial agreement.
Thirty seven out of 66 studies (56.1%) were industry-funded, and 36 (54.5%) were multi-center trials. Within the 66 included studies in the final review, the total number of SGAs reported was 177 (range = 51), and 68.8% of the included studies performed only one SGA. Of these, 52 (29.4%) claimed a subgroup effect. Thirty-two studies (48.5%) performed SGAs using a statistical test for interaction, and the remaining 34 studies (51.5%) performed statistical tests within individual subgroups and compared the results without an interaction test. The frequency of the SGAs, based on the performance of an interaction test (yes or no), is presented in Table 2. Among all SGAs, the quality of only 15 (8.5%) was evaluated as high (score ≥ 6 out of 10), and none of the SGAs met all the credibility criteria.
Table 2 also presents the frequency of the SGAs that reported subgroup interactions, which were either positive or negative. Among the 30 (16.9%) SGAs that reported positive results (claimed subgroup effects) using an appropriate method of performing interaction tests, the credibility of only 5 of these SGAs was assessed as high.
Table 3 further indicates the proportion of the above-mentioned 30 SGAs that met each credibility criteria. In 3 SGAs, the subgroup variable was not a characteristic measured at baseline. Additionally, only 1 SGA reported the subgroup variable as a stratification factor at randomization, and only 11 SGAs clearly indicated an a priori hypothesis regarding a subgroup effect. Of the 30 claims, only 5 (16.7%) correctly pre-specified the direction of the subgroup effect.

1. Statistical analyses

1) Regression analyses of study variables

We did not find any significant associations using univariate and multivariable regression analyses evaluating the association between the quality of SGAs and the study characteristics (risk of bias, funding sources, sample size, and latest impact factor). The summary of the analyses is presented in Table 4.
We assessed the goodness of fit for the final model using the Homer and Lemeshow test. The statistical analysis showed that the Chi-square of 2.241 with 8 degrees of freedom was not significant (P value = 0.973). Therefore, the null hypothesis (H0: The model is appropriate) was rejected and this indicated that the model is appropriate.

DISCUSSION

1. Summary and interpretation of findings

In this methodological study, we assessed the quality and credibility of SGAs performed in CNCP trials published between 2012 and 2018. SGAs aim to detect a subset of the patient population with improved efficacy when compared to the whole trial population, based on specific patients or intervention characteristics. Of the 66 included studies that reported at least one SGA, a higher proportion of the included studies was industry-funded, indicating that a higher proportion of industry-funded trials reported an SGA compared to non-industry funded trials.
Another variable influencing the quality of SGAs is sample size. Lachenbruch [16] suggested a simple method of calculating a trial’s sample size for it to be eligible to test for subgroup interactions using the contrast(s) for the interaction and a normal distribution. A required sample size of approximately 500 has also suggested by previous studies [17]. Based on these two rationales, 79% of the included studies did not meet the requirements and were considerably underpowered to detect any significant subgroup effects. This issue highlights the lack of power for performing SGAs.
The quality of SGAs is also influenced by the number of the subgroup hypotheses that were tested. In this study, approximately two-thirds of the included studies performed only one SGA and 7.5% of the studies performed more than 5 SGAs, leading them to exceed the quality criterion that less than 5 subgroup hypotheses should be tested. Performing many interaction tests in one study could suggest a significant inflation of type I error, which could enhance the probability of reporting spurious results.
Additionally, in slightly less than 50% of the studies, the authors expressed that they undertook an interaction test for analyzing subgroups, and reported a P value for interaction. A test for interaction, which examines if the treatment effect varies across subgroup categories, is the only reliable statistical approach to claim that the existing difference between subgroups cannot be explained by chance [10,18].
Overall, the quality of SGAs performed in the 66 included studies was low. Among the 177 SGAs identified, the quality of only 15 (8.5%) was high. Of the 30 SGAs that claimed a subgroup effect using an appropriate test for interaction, the credibility of only 5 SGAs was evaluated as high. According to Table 3, approximately two-thirds of the SGAs claiming a subgroup effect failed to clearly indicate an a priori hypothesis for the subgroup effect. Even when subgroup effects were hypothesized a priori, the direction of a majority of subgroup effects (83%) was not correctly hypothesized a priori. One reason for this could be about that 56% of the included studies were post-hoc analyses of RCTs. This result may be explained by the fact that these SGAs were carried out to find significant differences in primary outcome measures in specific patient subgroups when one was not found in an analysis of the whole study population. However, this study did not correlate this parameter of SGA quality with the primary outcome results for the whole study populations of the 44% of studies that did not generate a priori hypotheses. As such, this remains a hypothesis that warrants further study.
Nevertheless, of the studies which performed a test for interaction between subgroups, 90% of them satisfied this criterion that “the subgroup variable was a characteristic that was measured at baseline”. This indicates that most of the SGAs were selected based on characteristics at baseline.
Overall, the results of this study indicate that a total of 52 SGAs reported a subgroup effect. However, in 22 of these subgroup effects, the authors concluded that there was a subgroup effect by reporting a significant treatment effect in one subgroup or by looking for significance in each subgroup separately which cannot be considered as a correct method of claiming a subgroup effect [18].
Independence of the interaction is an important criterion whose fulfillment in performing SGAs can increase the credibility of subgroup effects. When a study tests multiple hypotheses, the analyses might produce more than one significant interaction which might be associated with each other and explained by a common factor [10]. This issue can be addressed by including all significant and non-significant interactions in the regression model to see if the interaction terms are still significant. In our study, of the 30 claims, 14 (46.7%) met this criterion by performing regression models to check if the interaction term was independent.

2. Strengths and limitations of the study

To our knowledge, the current study is the first methodological review conducted to assess the quality of SGAs among all non-cancer chronic pain trials after the publication of the 10 criteria to assess SGA validity in 2012 [4]. There is just one similar review [8]; however, our study differs in two important regards. Firstly, our study evaluated the quality of SGAs reported in all non-cancer chronic pain trials while the scope of the previous review was narrower and included specifically low back pain trials with SGAs. Secondly, our study assessed the quality and the credibility of all SGAs reported (positive and negative) rather than just looking at those with a claim of a subgroup effect. As such, we deem our review of the literature to be more robust.
Furthermore, given the variety of studies with different forms of SGAs, we divided the SGAs into 4 categories based on the test of interaction performed and the result of the SGAs (positive-negative) and evaluated the quality or credibility of each subgroup based on the number of criteria applied in each category. The previously available tools were designed to assess the credibility of subgroup effects claimed in the RCTs; however, there was no standard tool to take into consideration the quality of performing all SGAs rather than only those which reported a claim. As such, our approach allowed for a more stratified and appropriate evaluation of the SGAs performed.
Our study is also presented with two limitations. Firstly, based on the initial study protocol, we searched MEDLINE starting with 2013. Due to not obtaining the required sample size (60), we expanded our search to EMBASE and to the year 2012 to obtain more eligible studies. Since we limited the literature search to studies published in or after 2012 to coincide with the publication of the guidelines created by Sun et al. [4] and for it to thus have been possible for the SGAs to have been designed in accordance to those guidelines, we were only able to include 66 RCTs.
The results of our study are consistent with the findings of previous studies conducted on this issue [8]. Previous searches of the literature have also demonstrated the poor quality of SGAs and the low credibility of subgroup claims.
Contrary to what we expected, no significant association was found between the quality of SGAs, and the risk of bias, the source of funding, the sample size, or the journal impact factor. This finding indicates that the quality of SGAs might not be affected by study characteristics. One reason for this could be the small sample size which might have made our study underpowered to reach actual associations between study variables. Other studies have also reported a lack of association between study characteristics and SGA quality [8,17]. However, the source of funding was not a study characteristic included in the previous multivariable regressions published in the literature.
The results of the current study, in keeping with the results of previous studies [19,20] show that a larger proportion of included trials were funded by industry. It is possible that this result indicates that, in the presence of non-significant results (73% vs. 27% in our study), industry funded trials may be more likely to attempt to seek statistically significant findings in patient subgroups. However, our multiple regression analyses did not prove this claim.

3. Conclusion

The findings of this study indicated that the overall quality of SGAs and the credibility of subgroup effects in CNCP trials is low. This study emphasizes the importance of utilizing appropriate scientific methodology to investigate subgroup effects and highlights the following issues: Those conducting trials should utilize the standardized criteria, specifically in the process of trial planning. Utilizing experienced statisticians to include SGAs in the analyses planning is highly recommended. Journal editors should also consider the developed criteria to assess the credibility of subgroup claims reported in the submitted manuscripts. Finally, knowledge users should also take caution in their interpretation of the results of SGAs and their application of the treatment in question to specific subpopulations.

Notes

Author contributions: Mahmood AminiLari: Methodology; Vahid Ashoorian: Investigation; Alexa Caldwell: Investigation; Yasir Rahman: Data curation; Robby Nieuwlaat: Supervision; Jason W. Busse: Proposal preparation, Analysis plan; Lawrence Mbuagbaw: Supervision.

CONFLICT OF INTEREST

No potential conflict of interest relevant to this article was reported.

FUNDING

No funding to declare.

REFERENCES

1. Ospina M, Harstall C. 2002. Prevalence of chronic pain: an overview. Alberta Heritage Foundation for Medical Research;Edmonton:
2. Elzahaf RA, Tashani OA, Unsworth BA, Johnson MI. 2012; The prevalence of chronic pain with an analysis of countries with a Human Development Index less than 0.9: a systematic review without meta-analysis. Curr Med Res Opin. 28:1221–9. DOI: 10.1185/03007995.2012.703132. PMID: 22697274.
crossref
3. Venekamp RP, Rovers MM, Hoes AW, Knol MJ. 2014; Subgroup analysis in randomized controlled trials appeared to be dependent on whether relative or absolute effect measures were used. J Clin Epidemiol. 67:410–5. DOI: 10.1016/j.jclinepi.2013.11.003. PMID: 24508145.
crossref
4. Sun X, Briel M, Busse JW, You JJ, Akl EA, Mejza F, et al. 2012; Credibility of claims of subgroup effects in randomised controlled trials: systematic review. BMJ. 344:e1553. DOI: 10.1136/bmj.e1553. PMID: 22422832.
crossref
5. Varadhan R, Wang SJ. 2014; Standardization for subgroup analysis in randomized controlled trials. J Biopharm Stat. 24:154–67. DOI: 10.1080/10543406.2013.856023. PMID: 24392983. PMCID: PMC4313927.
crossref
6. Byth K, Gebski V. 2004; Factorial designs: a graphical aid for choosing study designs accounting for interaction. Clin Trials. 1:315–25. DOI: 10.1191/1740774504cn026oa. PMID: 16279257.
crossref
7. McCormack R, Lamontagne M, Vannabouathong C, Deakon RT, Belzile EL. 2017; Comparison of the 3 different injection techniques used in a randomized controlled study evaluating a cross-linked sodium hyaluronate combined with triamcinolone hexacetonide (Cingal) for osteoarthritis of the knee: a subgroup analysis. Clin Med Insights Arthritis Musculoskelet Disord. 10:1179544117725026. DOI: 10.1177/1179544117725026. PMID: 28839449. PMCID: PMC5560514.
crossref
8. Saragiotto BT, Maher CG, Moseley AM, Yamato TP, Koes BW, Sun X, et al. 2016; A systematic review reveals that the credibility of subgroup claims in low back pain trials was low. J Clin Epidemiol. 79:3–9. DOI: 10.1016/j.jclinepi.2016.06.003. PMID: 27297201.
crossref
9. Oxman AD, Guyatt GH. 1992; A consumer's guide to subgroup analyses. Ann Intern Med. 116:78–84. DOI: 10.7326/0003-4819-116-1-78. PMID: 1530753.
crossref
10. Sun X, Briel M, Walter SD, Guyatt GH. 2010; Is a subgroup effect believable? Updating criteria to evaluate the credibility of subgroup analyses. BMJ. 340:c117. DOI: 10.1136/bmj.c117. PMID: 20354011.
crossref
11. Oxman A, Guyatt G, Cook D, Montori V. Guyatt G, Rennie D, editors. 2002. Summarizing the evidence. Users' guides to the medical literature: a manual for evidence-based clinical practice. AMA Press;Chicago: p. 155–173.
12. Akl EA, Sun X, Busse JW, Johnston BC, Briel M, Mulla S, et al. 2012; Specific instructions for estimating unclearly reported blinding status in randomized trials were reliable and valid. J Clin Epidemiol. 65:262–7. DOI: 10.1016/j.jclinepi.2011.04.015. PMID: 22200346.
crossref
13. Hosmer DW, Lemeshow S. 1980; Goodness of fit tests for the multiple logistic regression model. Commun Stat Theory Methods. 9:1043–69. DOI: 10.1080/03610928008827941.
crossref
14. Landis JR, Koch GG. 1977; The measurement of observer agreement for categorical data. Biometrics. 33:159–74. DOI: 10.2307/2529310. PMID: 843571.
crossref
15. Harris RJ, Quade D. 1992; The minimally important difference significant criterion for sample size. J Educ Stat. 17:27–49. DOI: 10.3102/10769986017001027.
crossref
16. Lachenbruch PA. 1988; A note on sample size computation for testing interactions. Stat Med. 7:467–9. DOI: 10.1002/sim.4780070403. PMID: 3368673.
crossref
17. Mistry D, Patel S, Hee SW, Stallard N, Underwood M. 2014; Evaluating the quality of subgroup analyses in randomized controlled trials of therapist-delivered interventions for nonspecific low back pain: a systematic review. Spine (Phila Pa 1976). 39:618–29. DOI: 10.1097/BRS.0000000000000231. PMID: 24480951.
18. Rothwell PM. 2005; Treating individuals 2. Subgroup analysis in randomised controlled trials: importance, indications, and interpretation. Lancet. 365:176–86. DOI: 10.1016/S0140-6736(05)17709-5. PMID: 15639301.
19. Sun X, Briel M, Busse JW, You JJ, Akl EA, Mejza F, et al. 2011; The influence of study characteristics on reporting of subgroup analyses in randomised controlled trials: systematic review. BMJ. 342:d1569. DOI: 10.1136/bmj.d1569. PMID: 21444636. PMCID: PMC6173170.
crossref
20. Barton S, Peckitt C, Sclafani F, Cunningham D, Chau I. 2015; The influence of industry sponsorship on the reporting of subgroup analyses within phase III randomised controlled trials in gastrointestinal oncology. Eur J Cancer. 51:2732–9. DOI: 10.1016/j.ejca.2015.08.030. PMID: 26608121.
crossref

Fig. 1
Study flow diagram. SGA: subgroup analysis.
kjp-34-2-139-f1.tif
Table 1
Characteristics of 66 included studies
Study characteristic Category Frequency
Trial type Single center 30 (45.5)
Multi-center 36 (54.5)
Source of funding Industry 37 (56.1)
Non-industry 25 (37.9)
Both 1 (1.5)
Not reported 3 (4.5)
Primary outcome (pain) Yes 43 (65.2)
No 23 (34.8)
Post-hoc analysis Yes 37 (56.1)
No 29 (43.9)
Treatment effect of primary outcome (main trial) Positive 24 (36.4)
Negative 42 (63.6)
Risk of bias Higha 38 (57.6)
Lowb 28 (42.4)
Table 2
Frequency of SGAs categorized based on the result, and performing interaction testa
Test of interaction (yes or no)/SGA result (positive or negative) Frequency Quality of SGAs Frequency
Yes/Positive 30 (16.9) High 5 (16.7)
Low 25 (83.3)
Yes/Negative 96 (54.2) High 3 (3.1)
Low 93 (96.9)
No/Positive 22 (12.4) High 1 (4.5)
Low 21 (95.5)
No/Negative 29 (16.4) High 6 (20.7)
Low 23 (79.3)
Table 3
Proportion of 30 subgroup analyses claiming a subgroup effect which met each criterion
Criteria No (criterion not met) Yes (criterion met)
1. Is the subgroup variable a characteristic measured at baseline? 3 (10.0) 27 (90.0)
2. Was the subgroup variable a stratification factor at randomisation? 29 (96.7) 1 (3.3)
3. Was the hypothesis specified a priori? 19 (63.3) 11 (36.7)
4. Was the subgroup analysis one of small number of subgroup hypotheses tested (≤ 5)? 10 (33.3) 20 (66.7)
5. Was the test of interaction significant (interaction P < 0.05)? 0 30 (100)
6. Was the significant interaction effect independent, if there were multiple significant interactions? 16 (53.3) 14 (46.7)
7. Was the direction of subgroup effect correctly pre-specified? 25 (83.3) 5 (16.7)
8. Was the subgroup effect consistent with evidence from previous studies? 20 (66.7) 10 (33.3)
9. Was the subgroup effect consistent across related outcomes? 20 (66.7) 10 (33.3)
10. Was there indirect evidence to support the apparent subgroup effect (biological rationale, laboratory tests, animal studies)? 28 (93.3) 2 (6.7)
Table 4
Association between quality of SGAs with studies’ characteristics using multiple linear regression models
Variable Univariable analysis Multivariable analysis


B (95% CI) P value B (95% CI) P value
Risk of bias 0.33 (–0.24, 0.91) 0.258 0.16 (–0.45, 0.78) 0.591
Source of funding –0.005 (–0.61, 0.60) 0.986 –0.05 (–0.71, 0.61) 0.880
Sample size 0.15 (–0.41, 0.73) 0.586 –1.81 (–0.99, 0.63) 0.658
Journal impact factor 0.33 (–0.24, 0.91) 0.258 0.23 (–0.39, 0.85) 0.461
TOOLS
Similar articles