Journal List > Korean J Pain > v.33(3) > 1159151

Mendonça, Noll, Santos, Rodrigues, and Silveira: High prevalence of musculoskeletal pain in individuals with severe obesity: sites, intensity, and associated factors

Abstract

Background

Musculoskeletal pain is associated with obesity; however, information on factors associated with pain in adults with obesity and severe obesity is limited. The purpose of this study was to assess the prevalence of musculoskeletal pain by site and intensity of pain and associated factors in individuals with severe obesity (body mass index ≥ 35.0 kg/m2).

Methods

Baseline data from the DieTBra Trial study evaluating pain symptoms in nine body regions over the last seven days using the Nordic Questionnaire on Musculoskeletal Symptoms and Numerical Pain Scale. The variables analyzed using multiple Poisson regression with hierarchical analysis were: sociodemographic, lifestyle, food consumption, clinical, and anthropometric, and the outcome was moderate and intense pain.

Results

In 150 participants, there was a high prevalence of ankle and foot pain (68.7%), lower back pain (62.7%), pain in the knees (53.3%) and upper back pain (52.0%), with a predominance of intense pain. Factors associated with pain according to specific sites were: type 2 diabetes with hand/wrist pain; sedentary time with hip pain; insomnia with pain in the hip and knee; edema in the lower limbs with pain in the lower back and ankles/feet; degree of obesity with ankle/foot pain; and percentage of total fat with ankle/foot pain.

Conclusions

There was a high prevalence of pain and intense pain in individuals with severe obesity and an association with clinical variables, the degree of obesity, and sedentary lifestyle.

INTRODUCTION

Recent data from the World Health Organization indicate that global obesity has almost tripled between 1975 and 2016 [1]. Severe obesity (body mass index [BMI] ≥ 35.0 kg/m2) is a complex multifactorial problem involving public, political, and social health issues [2], and is associated with health risks, including chronic diseases such as type 2 diabetes, cardiovascular diseases, certain types of cancer, and depression [3]. Some scientific evidence also points to the association of obesity with musculoskeletal pain [4,5].
Obesity and chronic pain are comorbidities that negatively impact the population [5]. Several potential mechanisms may link the relationship between pain and obesity, including mechanical/structural factors, inflammatory status, family factors, depression, sleep, lifestyle, and dietary modifications [4,5]. Obesity may also be related to the increase in the number of pain sites over time [6]. However, evidence between musculoskeletal pain in individuals with obesity and associations with sociodemographic, anthropometric, lifestyle, and clinical variables are scarce, especially in individuals with severe obesity [3,6].
Besides, most of the international studies evaluated specific pain sites (knees, feet, and upper back), so there is no information available in the same study evaluating all body regions and potential associations with different types of variables [3,6]. Studies that address pain intensity are also scarce in the literature [7]. In this context, the aim of this study was to evaluate the prevalence of musculoskeletal pain in adults with severe obesity, by sites and intensity of pain, as well as to investigate whether sociodemographic variables, lifestyle, food consumption, clinical variables, body composition, and anthropometry are associated with moderate and intense pain.

MATERIALS AND METHODS

1. Study design

Musculoskeletal pain in individuals with severe obesity (BMI ≥ 35.0 kg/m2) was investigated according to the baseline analysis of the clinical trial ‘DieTBra Trial’, registered on the ClinicalTrials.gov platform (NCT02463435) [8,9]. The Severe Obesity Study Group conducted the study at the Nutrition in Severe Obesity Outpatient Clinic of the Clinics Hospital of the Federal University of Goiás, Goiânia, Goiás, Brazil [8,9]. Data were collected between June 2015 and February 2016. The study was approved by the Research Ethics Committee (Universidade Federal de Goiás) under the protocol 747.792/2014. All subjects who participated in the study signed an informed consent form.

2. Inclusion and exclusion criteria

Adult patients (aged between 18 and 65 yr) with a BMI ≥ 35.0 kg/m2, who were referred to our outpatient clinic via primary care by the Unified Health System from Goiânia, were included in the study. Individuals undergoing bariatric surgery, those who had been under nutritional treatment for weight loss for the past 2 years or were currently taking antiobesity or anti-inflammatory medication, pregnant and lactating female, people with physical disabilities that prevented locomotion, people with chronic obstructive pulmonary disease, and those with cancer and metal in the body (stems and pins) were excluded from the study sample.

3. Sociodemographic, lifestyle, and food consumption data

Sociodemographic and lifestyle data were collected using a standardized and previously tested questionnaire. The sociodemographic variables were: sex, age, skin color, marital status (living with or without partner), occupation (formal, informal, autonomous, retired, housekeeper), head of the family, and economic class by the Economical Classification Criteria Brazil from the Brazilian Association of Companies and Research (sum of the items of residence and schooling of the head of the family) [10].
Lifestyle variables were: smoking (whether patients were current or past smokers), alcohol consumption (binge drinking) (consumption of more than five doses for male and four doses for female, of beer, wine, whiskey, or sugarcane liquor in a single day) which was evaluated by a simplified version (adapted to the present study) of the questionnaire from Gender, Alcohol and Culture: an International Study - GENACIS [11], and sedentary behavior.
The Actigraph wGT3X triaxial accelerometer (ActiGraph LLC., Pensacola, FL) was used for the sedentary behavior variable. Patients were instructed to use the device 24 hours a day for six consecutive days on the non-dominant wrist. The accelerometer frequency was set at 30 Hz. The devices were configured, and the data downloaded into the ActiLife 6 software (https://www.actigraphcorp.com/support/software/actilife/). The data were processed using the package named GGIR of R statistical software 3.6.3 (http://cran.r-project.org), and expressed in an equivalent unit called milligravity (mg). The variable time of sedentary behavior (< 50 mg) (without bout) in minutes per day was used and categorized, using the median: < 1,182.15 minutes per day as lower sedentary time and ≥ 1,182.15 minutes per day as higher sedentary time.
The variables of food consumption were: consumption of fruits and vegetables. Daily consumption of cooked or boiled vegetables (pumpkin, okra, chuchu, cauliflower, broccoli, and others) and fresh fruits were evaluated by a food frequency questionnaire [12].

4. Clinical variables

Clinical variables were a positive family history of depression, hypertension, and diabetes; symptoms of anxiety and depression; use of medications; and biochemical tests. Difficulty sleeping or insomnia, arthritis/arthrosis, elevated uric acid, lower limb edema, a fall in the last 12 months, and fracture have also been studied. These last variables were collected through the following questions: “Do you have difficulty sleeping or insomnia?”; “Have you ever had a fracture in your life?”; “Have you suffered any fall in the last 12 months?”; “Report if your doctor has already said that you have any of the following: arthritis/arthrosis/joint problems; swelling in the legs (edema in lower limbs)”. For the evaluation of anxiety and depression symptoms, the Hospital Anxiety and Depression Scale was used [13]. The diagnosis of type 2 diabetes was based on the criteria of the American Diabetes Association, which included fasting glycemia ≥ 126 mg/dL, glycated hemoglobin ≥ 6.5%, and/or use of hypoglycemic agents [14]. We considered having arthritis or osteoarthritis if the patient mentioned that he had a medical report.
The drugs used by patients were classified according to the Anatomical Therapeutic Chemical Classification System (ATC codes) in groups with similar mechanisms of action [15]: analgesics, non-steroidal anti-inflammatory drugs (NSAIDs), statins, and muscle relaxants.
The blood for the biochemical tests was collected after 12 hours of fasting. The analyzed parameters and their respective reference values were: uric acid (male 2.5-7.0 mg/dL and female 1.5-6 mg/dL) [16]; C-reactive protein (CRP) > 6 mg/dL; hemoglobin (male 13.5-17.5 g/dL and female 11.5-15.5 g/dL) [17]; inadequate total cholesterol total ≥ 240 mg/dL, inadequate high-density lipoprotein (HDL) ≤ 59 mg/dL, and inadequate low-density lipoprotein ≥ 160 mg/dL [18].

5. Anthropometry and body composition

Body weight was measured using a digital scale with a capacity of 200 kg and an accuracy of 100 g (Welmy, São Paulo, Brazil). Height was measured by a stadiometer coupled to the scale with a precision of 0.1 cm, performed according to the protocol of Lohman et al. [19]. Weight and height were used to calculate BMI, classified as severe obesity (BMI 35.0-39.9 kg/m2), morbid obesity (BMI 40.0-49.9 kg/m2) and superobesity (BMI ≥ 50.0 kg/m2) [20].
Body composition was assessed by Dual X-ray Absorptiometry (DXA) (Lunar DPX NT; GE Healthcare, Madison, WI). The percentage of total fat (%) was categorized in tertiles. DXA was not performed in subjects weighing 130 kg or more due to equipment capacity limit.

6. Musculoskeletal pain

The Nordic Questionnaire of Musculoskeletal Symptoms (NQMS), validated and adapted for Brazilian culture, was used to evaluate the symptoms of musculoskeletal pain [21-23]. The questionnaire covers nine anatomical regions: the neck, shoulders, elbows, upper back, lower back, wrist/hands, hips/thighs, knees, and ankles/feet [21-23]. For the analysis of the data of pain prevalence by body segments and intensity of pain, we considered the symptoms experienced in the last seven days [21]. The numerical pain rating scale, which ranges from 0 to 10, was used to assess pain intensity in the nine anatomical regions in the presence of pain. The intensity of pain was classified considering: no pain (0), mild pain (≤ 5), moderate pain (6 and 7), and intense pain (≥ 8) [24]. For the analysis of the prevalence data by body segments and association, we considered only moderate pain and intense pain.

7. Statistical analysis

The database was built in EPI DATA® ver. 3.1 (EpiData Association, Odense, Denmark), with double-entry typing and data validation. Statistical analyzes were performed in the statistical package Stata ver. 13.0 (StataCorp LP, College Station, TX). Statistical significance was set at 5%.
The descriptive analyzes are presented in absolute number (n) and relative frequency (%), mean and standard deviation. In the bivariate analysis, the Wald test or Fisher’s exact test was applied. Poisson regression was used to calculate the prevalence ratio (PR) and 95% confidence interval (CI). The variables with a significance level of P < 0.20 in the bivariate analysis were included in the Poisson multiple regression analysis with robust variance [25]. The multiple regression was performed under an hierarchical model where the independent variables were clustered into three levels: (I) sex, age, skin color, years of schooling, economic class, and occupation; (II) sedentary time, vegetable consumption; and (III) positive family history of depression, fall in the last 12 months, fracture, difficulty sleeping or insomnia, depression, anxiety, arthritis/arthrosis, type 2 diabetes, lower limb edema, use of analgesics, use of NSAIDs, use of muscle relaxant, CRP, obesity degree, and percentage of total fat. A multiple regression model was used for each of the nine body segments, which were considered outcome variables.
Variables without statistical power, that is, variables that after stratification by body segment had n < 10 in any of the strata, were excluded from the multiple regression analysis [26]. The excluded variables and their respective outcomes were (a) sex - upper back, hip, and knee; (b) economy class - shoulder and hip; (c) sedentary lifestyle/fruit consumption - neck; (d) family history of hypertension - shoulder, upper back, and ankle and feet; (e) family history of diabetes - shoulder and upper back; (f) difficulty sleeping and insomnia - elbow; (g) depression - neck, shoulder, and wrist/hands; (h) anxiety - neck, shoulder, and hip; (i) arthritis/arthrosis - elbow; (j) lower limb edema - neck, wrist/hands, upper back, hip, and knee; (k) muscle relaxant - elbow; (l) CRP - wrist/hand; (m) hemoglobin - shoulder; (n) total cholesterol - elbow and lower back; (o) HDL - upper back; (p) degree of obesity - lower back.

RESULTS

We analyzed 150 individuals with severe obesity. The mean age was 39.6 ± 0.7 years, mean BMI was 46.1 ± 0.5 kg/m2, and 85.3% of the study participants were female. The characteristics of the studied population and the prevalence of moderate and intense pain by body sites are presented in Tables 1 and 2. The overall prevalence of pain was 89.3%; 91.4% in women, and 77.3% in men (P = 0.062).
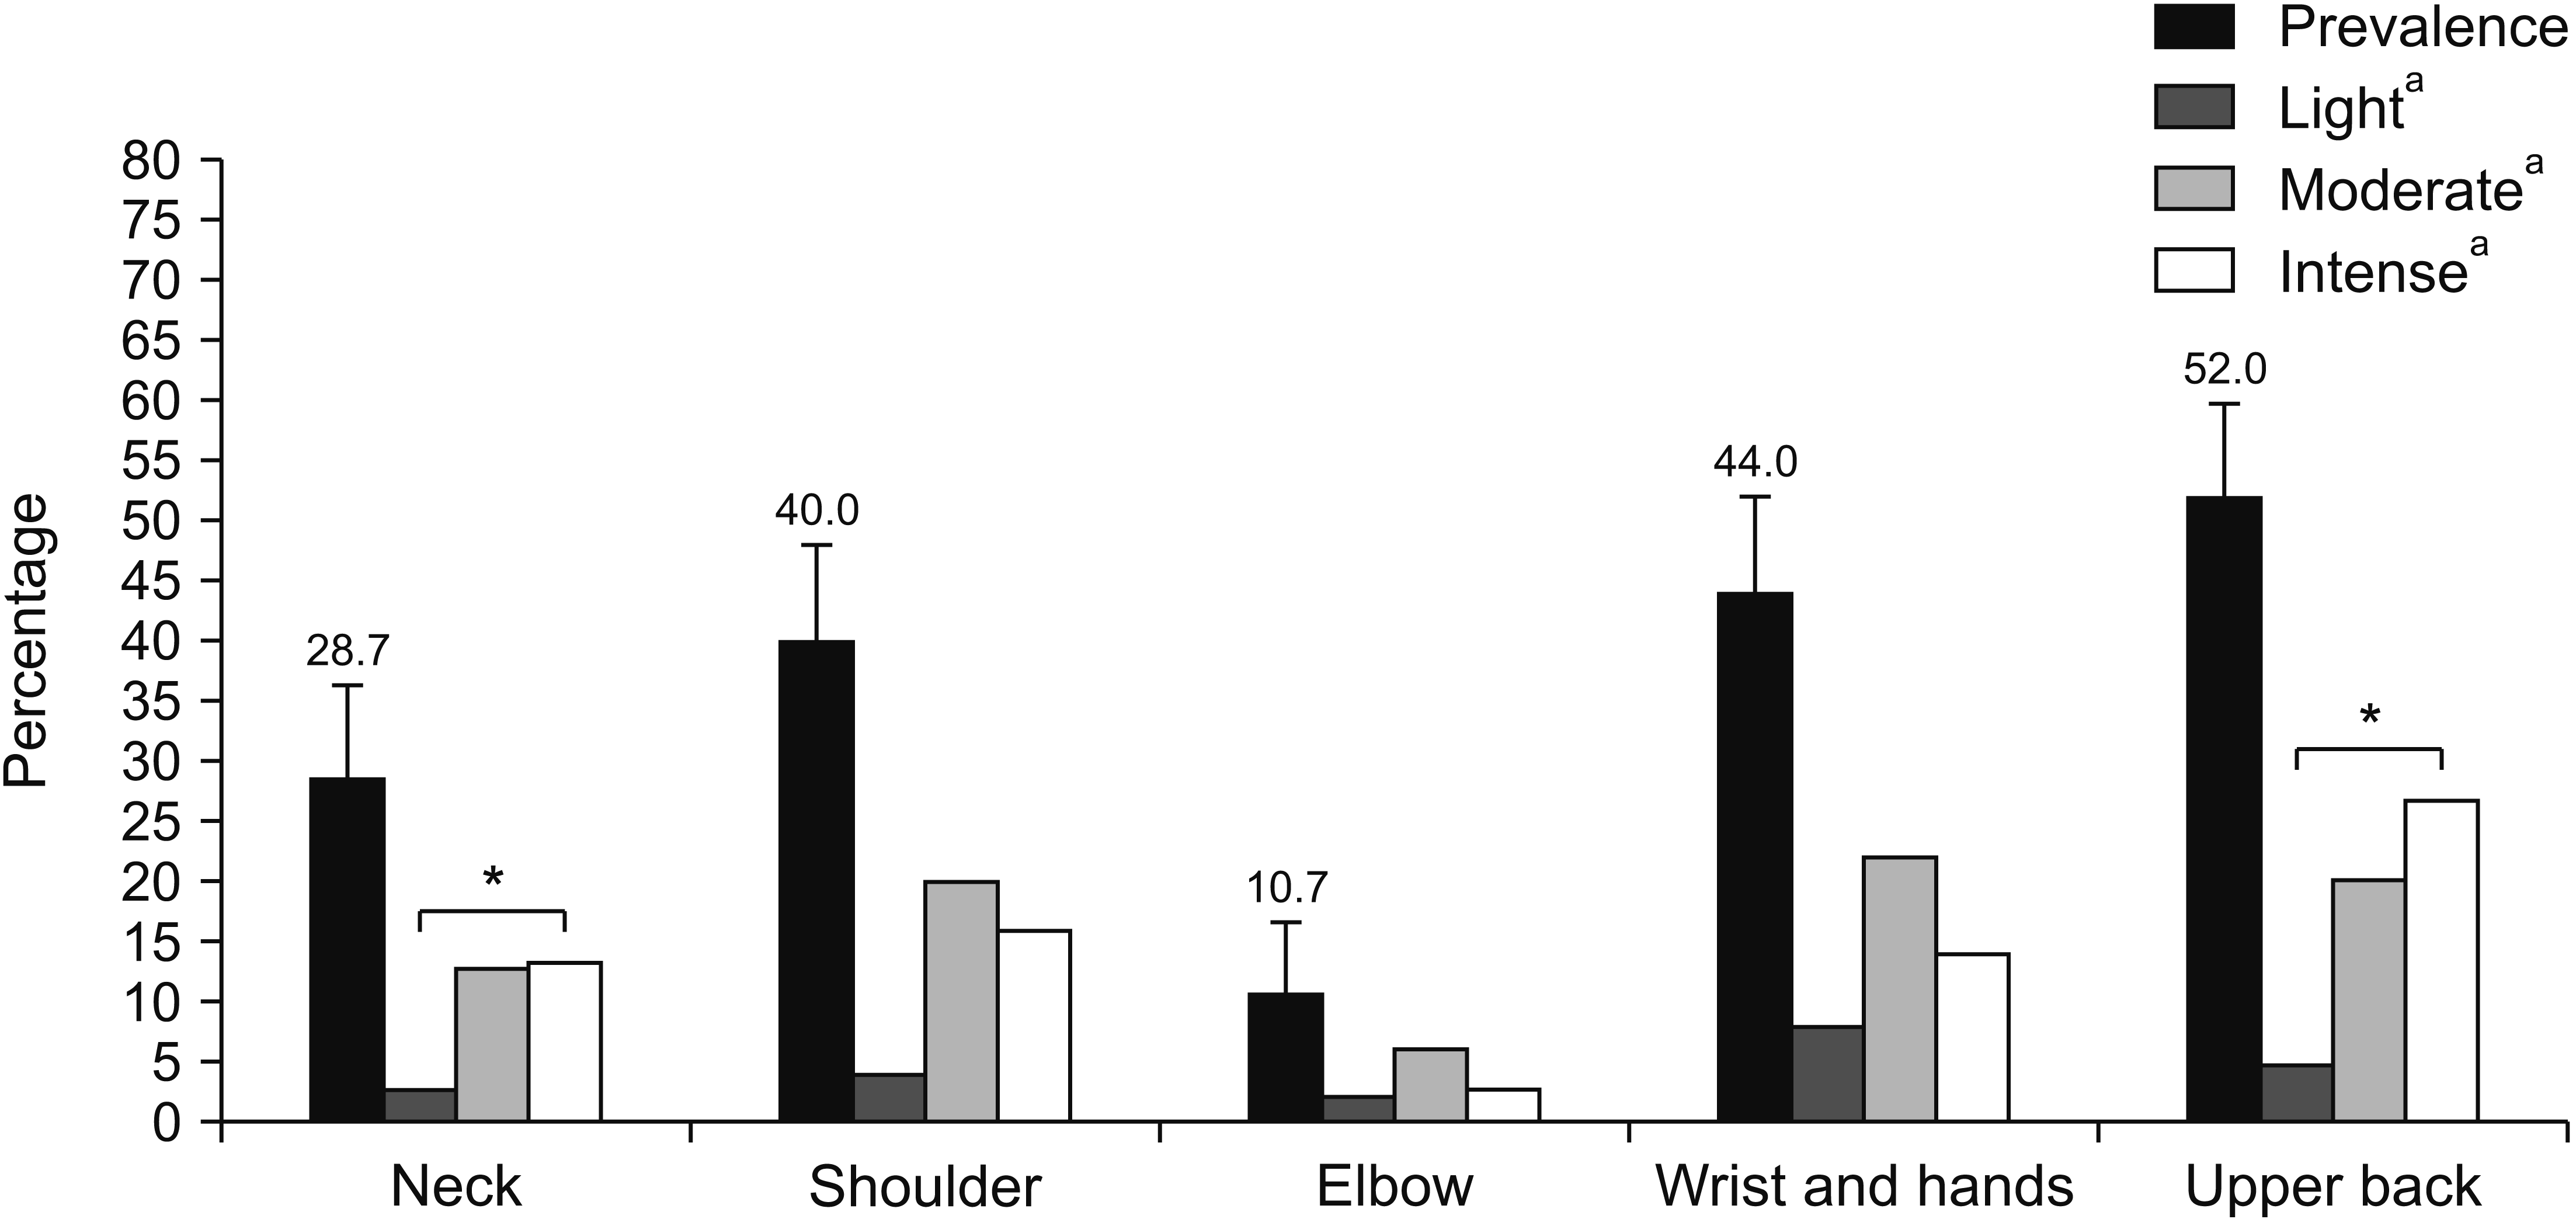
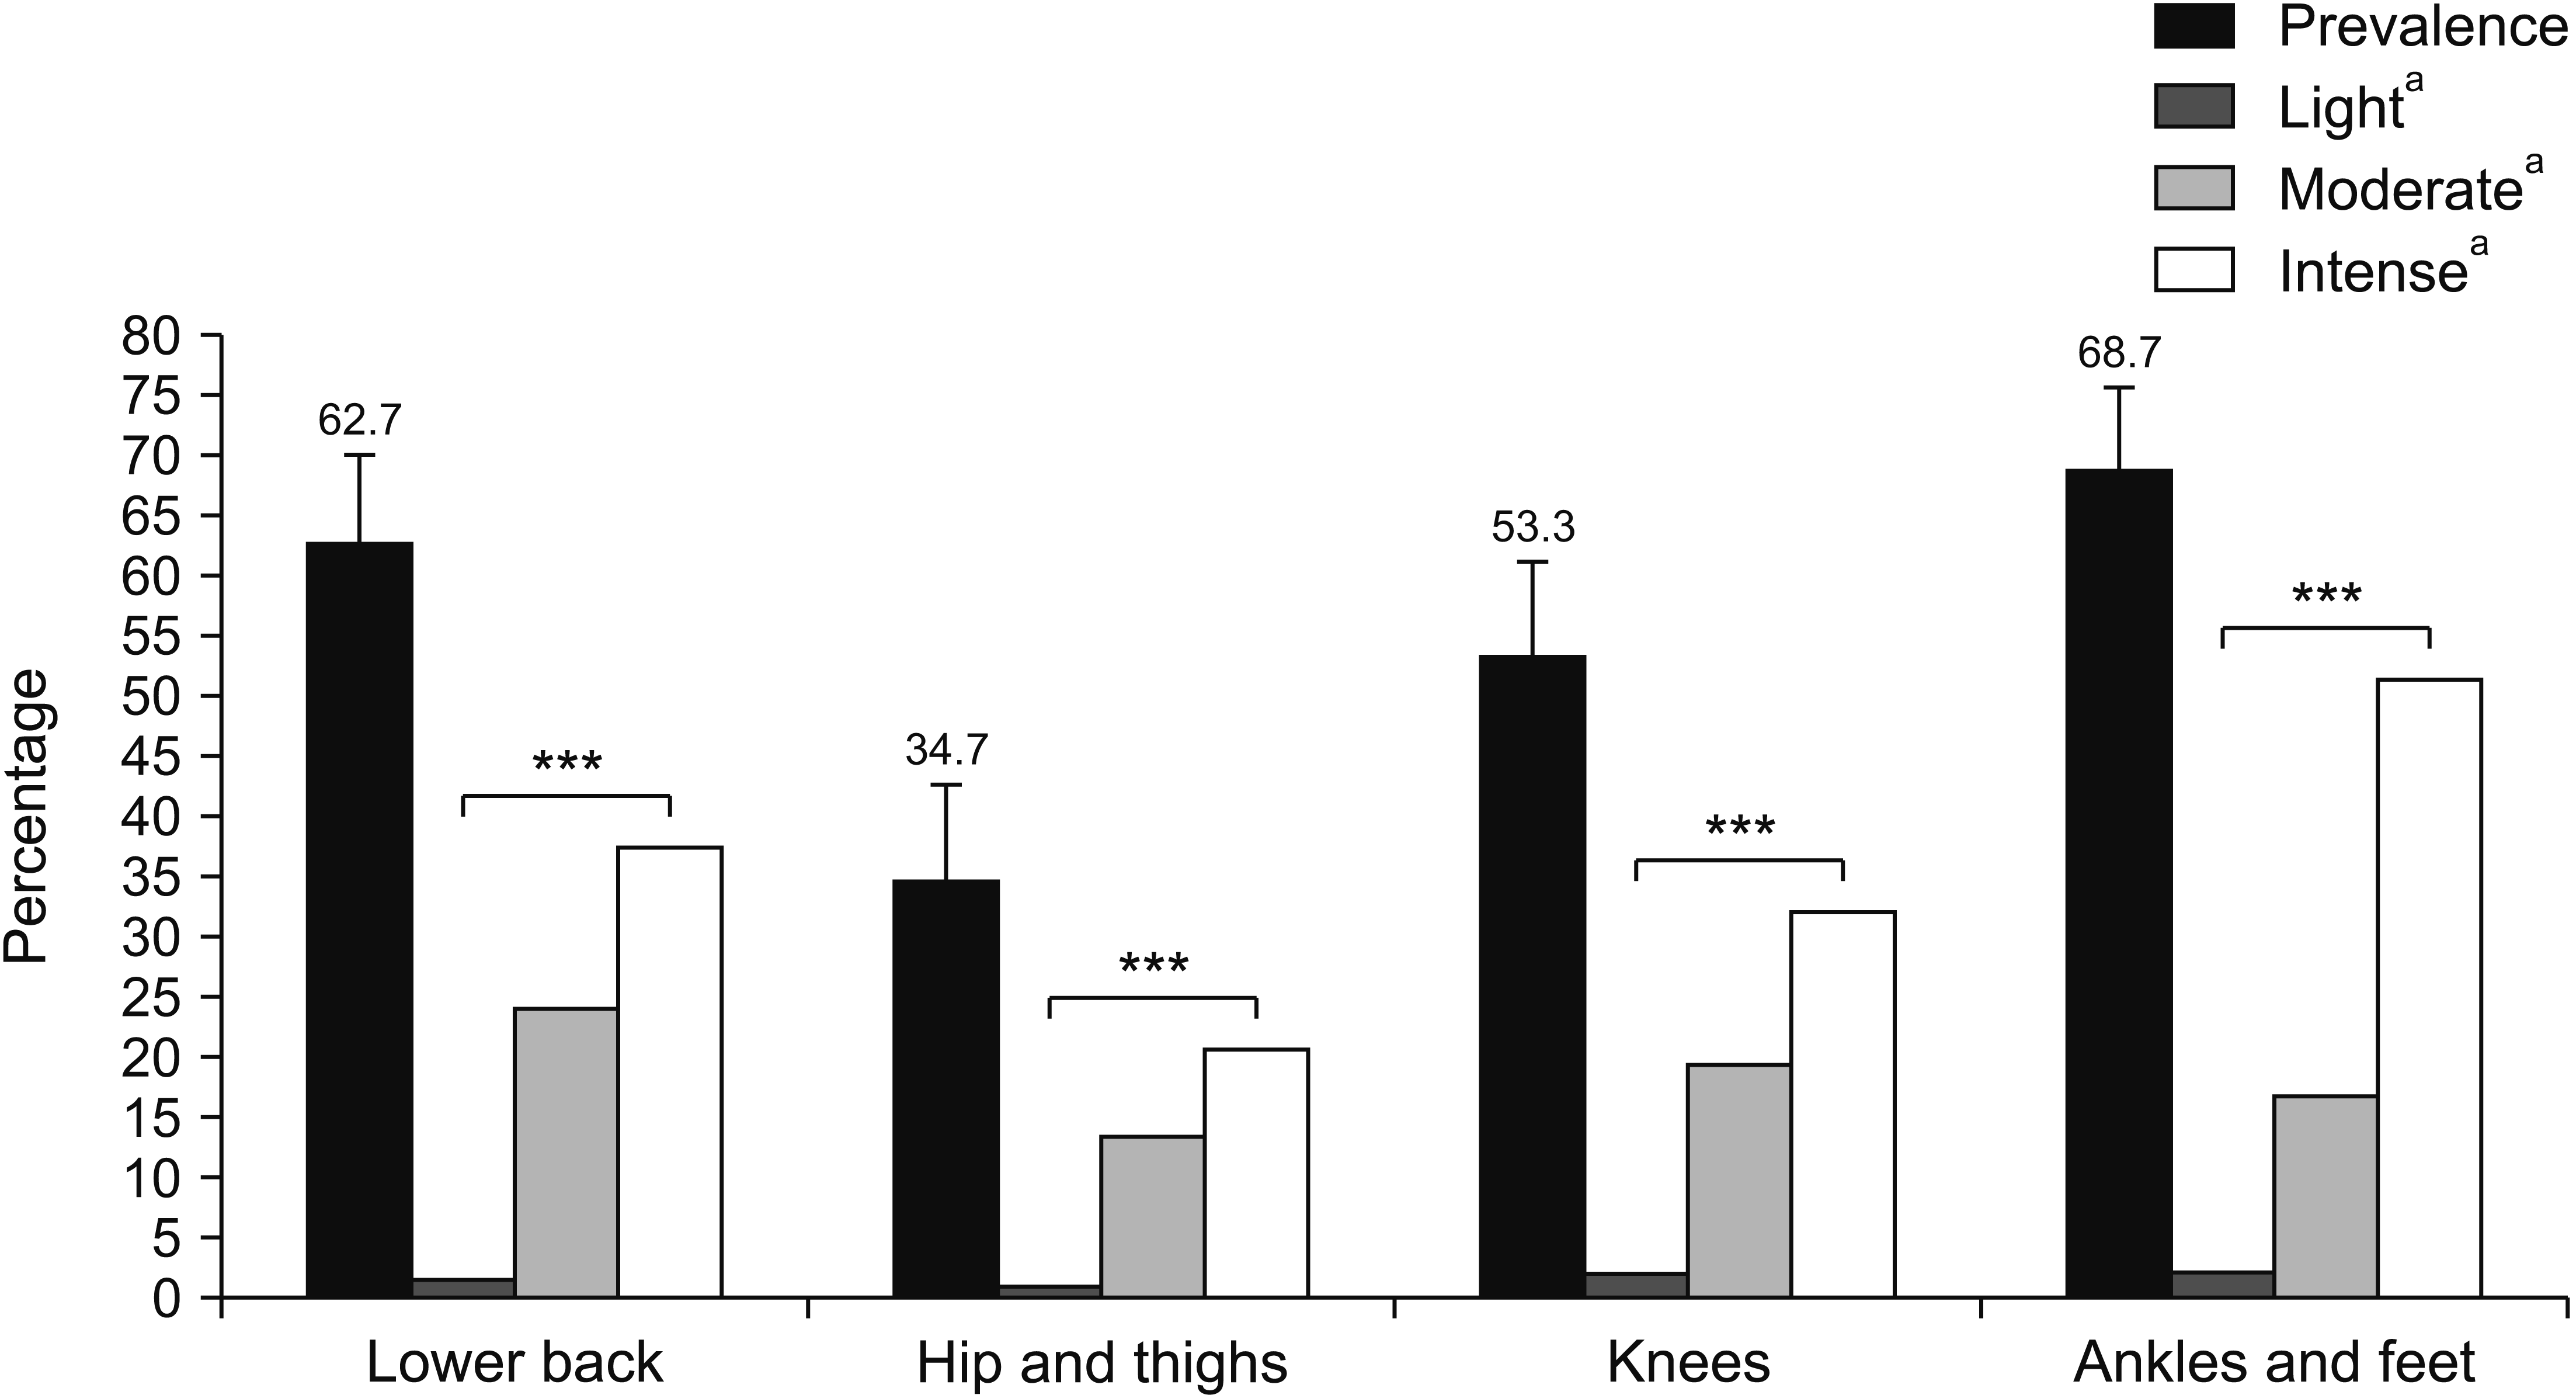
Body sites with higher prevalence of pain were: ankle/feet (68.7%), lower back (62.7%), knees (53.3%), and upper back (52.0%) (Figs. 1, 2). There was significant difference between the prevalence of light, moderate, and intense pain for the neck and upper back (P < 0.05, Fig. 1) and lower back, hips/thighs, knees, and ankles/feet (P < 0.001, Fig. 2).
The bivariate analysis revealed a significant association of: age ≥ 40 years with hip pain (P = 0.031); low economic class with hip pain (PR, 3.4; 95% CI, 1.37-8.41; P = 0.008) and knee (P = 0.034); occupation – retired/housekeeper with knee pain (P = 0.029); lower sedentary time with neck pain (P = 0.004), shoulder pain (P = 0.029), and hip pain (P = 0.035); difficulty sleeping or insomnia with hip pain (P = 0.011) and knee pain (P = 0.003); depression with shoulder pain (P = 0.024), hand/wrist pain (P = 0.032), and ankle/feet pain (P = 0.049); and anxiety with hand/wrist pain (P = 0.019) and hip pain (P = 0.024) (Supplementary Tables 1, 2).
There was also an association of arthritis/arthrosis with shoulder pain (P = 0.037), elbow pain (P = 0.037), wrist/hands (P = 0.019), hip pain (P = 0.003), knee pain (P = 0.006), lower back pain (P = 0.023), pain in the knee (P = 0.020), and pain in ankle/foot (P = 0.003); normal total cholesterol with lower back pain (P = 0.025); degree of obesity – BMI between 40.0-49.9 kg/m2 with lower back pain (P = 0.048) and ankle/foot pain (P = 0.038); and total fat with upper back pain (P = 0.013) (Supplementary Tables 1, 2).
The variables, included in the multiple regression analysis according to each outcome, are presented in Tables 3 and 4. After multiple regression analysis, type 2 diabetes remained associated with wrist/hand pain (P = 0.029). Lower sedentary time remained associated with hip pain (P = 0.032). Difficulty sleeping or insomnia remained associated with hip pain (P = 0.004) and knee pain (P = 0.021). Edema in the lower limbs remained associated with lower back pain (P = 0.026) and pain in the ankles/feet (P = 0.005). BMI between 40.0-49.9 kg/m2 remained associated with ankle/foot pain (P = 0.013). The lower percentage of total fat remained associated with ankle/foot pain (P = 0.016).

DISCUSSION

To the best of our knowledge, this is the first study to evaluate the factors associated with moderate and intense pain, considering nine anatomical regions in adults with severe obesity (BMI ≥ 35.0 kg/m2). This study brings essential information and contributions to the area of pain studies in individuals with severe obesity, showing a high prevalence of pain and intense pain mainly in the ankles/feet, lower and upper back, and knees, in addition to the associated factors in each anatomical region. Among the associated factors, we highlight hand/wrist pain with type 2 diabetes; lower back and ankle pain with lower limb edema; hip pain with sedentary time; hip and knee pain with insomnia; pain in the ankles/feet with a BMI of 40.0-49.9 kg/m2 and a lower percentage of total fat.
The high prevalence of intense pain, especially in areas with an increased mechanical load such as the ankles/feet, lower back, and knees, is in agreement with a previous study conducted in Brazil in adults with severe obesity [27]. The prevalence of lower back pain (62.7%) was close to the values found by the Brazilian (53.7%) [27], Australian (63.0%), [28] and Irish (72.5%) [6] studies. The prevalence of knee pain (53.3%) was higher than other studies performed in Brazil (46.3%) [27], Ireland (46.9%) [6], and France (14.1%) [29]. The prevalence of upper back pain (52.0%) was higher than that reported in the literature (43.9%) [27]. All these studies were performed with individuals who were obese, or suffered from severe obesity. It is important to acknowledge that weight gain is associated with an increase in the prevalence of musculoskeletal pain in different body sites [30,31], and that being overweight or obese increase the risk of developing musculoskeletal disorders [32]. In addition, individuals with severe obesity are also more likely to report pain in various places [33].
A high prevalence of moderate and intense pain in female, mainly in the ankles/feet, knee, lower back, and upper back, agrees with other studies reporting that female sex and obesity were factors significantly associated with the persistence or development of musculoskeletal pain [34,35], and with higher intensity [36]. We stress that previous studies did not specify the sites with the highest prevalence of pain [34,35].
In the present study, wrist/hand pain was associated with type 2 diabetes, which is in agreement with other studies reporting musculoskeletal manifestations on the hand in patients with diabetes mellitus [37,38]. The hands are the target of several complications related to type 2 diabetes [38,39]. The most common musculoskeletal manifestations are: rigid hands syndrome, neuropathic joints, carpal tunnel syndrome, and Dupuytren’s contracture [38,39]. These manifestations can be explained by the effect of adipose tissue, which releases adipokines that promote an inflammatory reaction. In diabetic individuals, insulin resistance can be added to this mechanism, which can damage cartilage, bones and synovial tissue, generating pain [40].
There was an association between pain in the lower back and ankles/feet with edema in the lower limb. There were no detailed investigations of edema, skin appearance, turgor, and risk of deep venous thrombosis. Studies that analyzed the association between the presence of pain in the lower back and ankle/feet and lower limb edema in obese or non-obese patients were not found in the literature review. However, one hypothesis to explain this association is that as the BMI increases, the ambulation and muscle contraction that aid in the transport of the fluid decreases [41], and this may increase the amount of lymph in the leg, generating pain from the limb overload.
Hip pain was associated with lower sedentary time. We did not find studies that addressed the association between hip pain in adults with obesity and sedentary time or other variables related to physical activity. However, there are studies that show that sedentary behavior contributes to the development of musculoskeletal pain [42], including chronic low back pain [43]. Besides, chronic musculoskeletal pain is a limiting factor for physical activity, also correlating for sedentary behavior [44]. It is important to highlight the importance of assessing sedentary behavior and other variables on the level of physical activity and its association with pain in individuals with severe obesity, mainly using reliable methods such as accelerometry applied in this study.
There was an association of hip and knee pain with insomnia. These findings were consistent with previous studies with non-obese women showing associations of hip and knee pain with insomnia [45,46]. The relationship between pain and insomnia is probably reciprocal once sleep disorders promote increased pain intensity, and pain promotes sleep disturbances [45]. On the other hand, pain may also arise after a period of rest, and may be indicative of inflammation in the joints, commonly associated with osteoarthritis [46,47]. The prolonged rest period may worsen inflammation and, consequently, increase the intensity of the pain [47,48].
Ankle/foot pain was associated with a BMI of 40.0-49.9 kg/m2. These data are consistent with other studies evaluating the degree of obesity in adults [49,50]. High body weight and ankle/foot weight overload may increase the risk of and worsen joint pain [50]. Other studies comparing different categories of BMI found an association between increased BMI levels and increased pain prevalence [30,31]. The lower percentage of total fat was also associated with ankle/foot pain. No studies were found to support this association.
Memory bias for the use of NQMS and the numerical pain scale may be a possible limitation of our study. However, to minimize this bias we opted for the report of pain in the last seven days. Another possible limitation may be the statistical power to assess the associated factors in the nine body regions. Despite this, considering previous studies [6,27] with obese populations, our number of individuals is substantial.
The strengths of the study relate to the strict control used at all stages of this research, which is part of a randomized clinical trial. Another relevant aspect is the evaluation of the intensity of musculoskeletal pain, considering the last seven days, the evaluation of moderate and intense pain in nine anatomical regions, and analysis of several variables not previously investigated. We believe that our study is the first to make such complex and in-depth analysis.
Data on musculoskeletal pain and associated factors can provide critical insights to health professionals working with patients with severe obesity in the elaboration of treatment plans, and in the referral of specialized services in the treatment of pain. It is an important step to stimulate initiatives of prevention and pain management in the treatment of obesity as well as control of the associated factors. This study may also contribute as a reference for future research on pain in individuals with obesity.
In conclusion, we found a high prevalence of musculoskeletal pain and intense pain in the severely obese, especially in the ankles/feet, lower back, knees, and upper back. Factors associated with pain in adults with severe obesity are related to clinical conditions, sedentary lifestyle, the degree of obesity, and total body fat.

Supplemental Materials

ACKNOWLEDGMENTS

To the Fundação de Amparo à Pesquisa no Estado de Goiás (FAPEG) for the partial financing of research and scholarship provided to the first author. The authors also thank the management of the Clinical Research Unit (UPC/HC/UFG) for making the physical infrastructure available. To participants and researchers who contributed to the DieTBra Trial study. To the Department of Epidemiology of the Universidade Federal de Pelotas and Prof. Dr. Pedro Rodrigues Curi Hallal for the partnership with the accelerometers. To the Department of Chronic-Degenerative Diseases of the Municipal Health Department (SMS) of Goiânia.

Notes

Author contributions: Carolina Rodrigues Mendonça: Writing/manuscript preparation; Matias Noll: Writing/manuscript preparation; Annelisa Silva e Alves de Carvalho Santos: Writing/manuscript preparation; Ana Paula dos Santos Rodrigues: Writing/manuscript preparation; Erika Aparecida Silveira: Writing/manuscript preparation.

CONFLICT OF INTEREST

No potential conflict of interest relevant to this article was reported.

FUNDING

Fundação de Amparo à Pesquisa no Estado de Goiás (FAPEG) for the partial financing of research and scholarship provided to the first author.

REFERENCES

1. World Health Organization (WHO). 2017. . Obesity and overweight [Internet]. World Health Organization (WHO);Geneva: Available at: https://www.who.int/news-room/fact-sheets/detail/obesity-and-overweight.
2. Arbex AK, Rocha DR, Aizenberg M, Ciruzzi MS. 2014; Obesity epidemic in Brazil and Argentina: a public health concern. J Health Popul Nutr. 32:327–34. PMID: 25076669. PMCID: PMC4216968.
3. Bihari V, Kesavachandran C, Pangtey BS, Srivastava AK, Mathur N. 2011; Musculoskeletal pain and its associated risk factors in residents of National Capital Region. Indian J Occup Environ Med. 15:59–63. DOI: 10.4103/0019-5278.90375. PMID: 22223951. PMCID: PMC3249791.
crossref
4. Stone AA, Broderick JE. 2012; Obesity and pain are associated in the United States. Obesity (Silver Spring). 20:1491–5. DOI: 10.1038/oby.2011.397. PMID: 22262163.
crossref
5. Okifuji A, Hare BD. 2015; The association between chronic pain and obesity. J Pain Res. 8:399–408. DOI: 10.2147/JPR.S55598. PMID: 26203274. PMCID: PMC4508090.
crossref
6. MacLellan GA, Dunlevy C, O'Malley E, Blake C, Breen C, Gaynor K, et al. 2017; Musculoskeletal pain profile of obese individuals attending a multidisciplinary weight management service. Pain. 158:1342–53. DOI: 10.1097/j.pain.0000000000000918. PMID: 28383311.
crossref
7. Hashimoto Y, Matsudaira K, Sawada SS, Gando Y, Kawakami R, Kinugawa C, et al. 2017; Obesity and low back pain: a retrospective cohort study of Japanese males. J Phys Ther Sci. 29:978–83. DOI: 10.1589/jpts.29.978. PMID: 28626304. PMCID: PMC5468219.
crossref
8. Santos ASAC, Rodrigues APS, Rosa LPS, Sarrafzadegan N, Silveira EA. 2020; Cardiometabolic risk factors and Framingham Risk Score in severely obese patients: baseline data from DieTBra trial. Nutr Metab Cardiovasc Dis. 30:474–82. DOI: 10.1016/j.numecd.2019.10.010. PMID: 31791637.
crossref
9. Rodrigues APS, Rosa LPS, Silveira EA. 2018; PPARG2 Pro12Ala polymorphism influences body composition changes in severely obese patients consuming extra virgin olive oil: a randomized clinical trial. Nutr Metab (Lond). 15:52. DOI: 10.1186/s12986-018-0289-4. PMID: 30026785. PMCID: PMC6050653.
crossref
10. Associação Brasileira de Empresas de Pesquisa (ABEP). 2012. Critério de classificação econômica Brasil [Internet]. Associação Brasileira de Empresas de Pesquisa (ABEP);São Paulo: Available at: http://www.abep.org/Servicos/Download.aspx?.id=03.
11. Kanny D, Naimi TS, Liu Y, Lu H, Brewer RD. 2018; Annual total binge drinks consumed by U.S. adults, 2015. Am J Prev Med. 54:486–96. DOI: 10.1016/j.amepre.2017.12.021. PMID: 29555021. PMCID: PMC6075714.
crossref
12. Thompson FE, Subar AF. Coulston AM, Boushey CJ, editors. 2008. Dietary assessment methodology. Nutrition in the prevention and treatment of disease. 2nd ed. Academic Press;San Diego:
crossref
13. Zigmond AS, Snaith RP. 1983; The hospital anxiety and depression scale. Acta Psychiatr Scand. 67:361–70. DOI: 10.1111/j.1600-0447.1983.tb09716.x. PMID: 6880820.
crossref
14. American Diabetes Association. 2017; Standards of medical care in diabetes-2017 abridged for primary care providers. Clin Diabetes. 35:5–26. DOI: 10.2337/cd16-0067. PMID: 28144042. PMCID: PMC5241768.
15. WHO Collaborating Centre for Drug Statistics Methodology. 2018. ATC/DDD index 2018 [Internet]. WHO Collaborating Centre for Drug Statistics Methodology;Oslo: Available at: https://www.whocc.no/atc_ddd_index/.
16. Jin M, Yang F, Yang I, Yin Y, Luo JJ, Wang H, et al. 2012; Uric acid, hyperuricemia and vascular diseases. Front Biosci (Landmark Ed). 17:656–69. DOI: 10.2741/3950. PMID: 22201767.
crossref
17. Colgrove KC. 2016. Med-surg success: a Q&A review applying critical thinking to test taking. 3rd ed. F.A. Davis;Philadelphia:
18. Xavier HT, Izar MC, Faria Neto JR, Assad MH, Rocha VZ, Sposito AC, et al. 2013; [V Brazilian guidelines on dyslipidemias and prevention of atherosclerosis]. Arq Bras Cardiol. 101(4 Suppl 1):1–20. Portuguese. DOI: 10.5935/abc.2013S010. PMID: 24217493.
19. Lohman TG, Roche AF, Martorell R. 1988. Anthropometric standardization reference manual. . Human Kinetics Books;Champaign:
crossref
20. World Health Organization (WHO). 2000. Obesity: preventing and managing the global epidemic. . Geneva:
21. Pinheiro FA, Tróccoli BT, Carvalho CV. 2002; [Validity of the Nordic Musculoskeletal Questionnaire as morbidity measurement tool]. Rev Saude Publica. 36:307–12. Portuguese. DOI: 10.1590/S0034-89102002000300008. PMID: 12131969.
22. Mendonça CR, Noll M, Silveira EA. 2018; Adaptation and validation of body maps for musculoskeletal pain location in patients with severe obesity. Korean J Pain. 31:268–76. DOI: 10.3344/kjp.2018.31.4.268. PMID: 30310552. PMCID: PMC6177535.
crossref
23. Kuorinka I, Jonsson B, Kilbom A, Vinterberg H, Biering-S©ªrensen F, Andersson G, et al. 1987; Standardised Nordic questionnaires for the analysis of musculoskeletal symptoms. Appl Ergon. 18:233–7. DOI: 10.1016/0003-6870(87)90010-X.
crossref
24. Boonstra AM, Stewart RE, Köke AJ, Oosterwijk RF, Swaan JL, Schreurs KM, et al. 2016; Cut-off points for mild, moderate, and severe pain on the numeric rating scale for pain in patients with chronic musculoskeletal pain: variability and influence of sex and catastrophizing. Front Psychol. 7:1466. DOI: 10.3389/fpsyg.2016.01466. PMID: 27746750. PMCID: PMC5043012.
crossref
25. Greenland S, Daniel R, Pearce N. 2016; Outcome modelling strategies in epidemiology: traditional methods and basic alternatives. Int J Epidemiol. 45:565–75. DOI: 10.1093/ije/dyw040. PMID: 27097747. PMCID: PMC4864881.
crossref
26. Peduzzi P, Concato J, Kemper E, Holford TR, Feinstein AR. 1996; A simulation study of the number of events per variable in logistic regression analysis. J Clin Epidemiol. 49:1373–9. DOI: 10.1016/S0895-4356(96)00236-3.
crossref
27. Calenzani G, Santos FFD, Wittmer VL, Freitas GKF, Paro FM. 2017; Prevalence of musculoskeletal symptoms in obese patients candidates for bariatric surgery and its impact on health related quality of life. Arch Endocrinol Metab. 61:319–25. DOI: 10.1590/2359-3997000000237. PMID: 28225991.
crossref
28. Brady SR, Mamuaya BB, Cicuttini F, Wluka AE, Wang Y, Hussain SM, et al. 2015; Body composition is associated with multisite lower body musculoskeletal pain in a community-based study. J Pain. 16:700–6. DOI: 10.1016/j.jpain.2015.04.006. PMID: 25958316.
crossref
29. Evanoff A, Sabbath EL, Carton M, Czernichow S, Zins M, Leclerc A, et al. 2014; Does obesity modify the relationship between exposure to occupational factors and musculoskeletal pain in men? Results from the GAZEL cohort study. PLoS One. 9:e109633. DOI: 10.1371/journal.pone.0109633. PMID: 25330397. PMCID: PMC4201453.
crossref
30. Hashimoto Y, Matsudaira K, Sawada SS, Gando Y, Kawakami R, Sloan RA, et al. 2018; Association between objectively measured physical activity and body mass index with low back pain: a large-scale cross-sectional study of Japanese men. BMC Public Health. 18:341. DOI: 10.1186/s12889-018-5253-8. PMID: 29523128. PMCID: PMC5845261.
crossref
31. Koçyiğit BF, Okyay RA. 2018; The relationship between body mass index and pain, disease activity, depression and anxiety in women with fibromyalgia. PeerJ. 6:e4917. DOI: 10.7717/peerj.4917. PMID: 29868295. PMCID: PMC5978395.
crossref
32. Faghri PD, Chin WS, Huedo-Medina TB. 2015; The link between musculoskeletal pain, lifestyle behaviors, exercise self-efficacy, and quality of life in overweight and obese individuals. Int J Phys Med Rehabil. 3:255. DOI: 10.4172/2329-9096.1000255. PMID: 29250572. PMCID: PMC5730077.
crossref
33. Hitt HC, McMillen RC, Thornton-Neaves T, Koch K, Cosby AG. 2007; Comorbidity of obesity and pain in a general population: results from the Southern Pain Prevalence Study. J Pain. 8:430–6. DOI: 10.1016/j.jpain.2006.12.003. PMID: 17337251.
crossref
34. Yoo JJ, Cho NH, Lim SH, Kim HA. 2014; Relationships between body mass index, fat mass, muscle mass, and musculoskeletal pain in community residents. Arthritis Rheumatol. 66:3511–20. DOI: 10.1002/art.38861. PMID: 25185757.
crossref
35. Park IY, Cho NH, Lim SH, Kim HA. 2018; Gender-specific associations between fat mass, metabolic syndrome and musculoskeletal pain in community residents: a three-year longitudinal study. PLoS One. 13:e0200138. DOI: 10.1371/journal.pone.0200138. PMID: 29985938. PMCID: PMC6037368.
crossref
36. Masheb RM, White MA, Grilo CM. 2016; Sex differences and correlates of pain in patients with comorbid obesity and binge eating disorder. Eur Eat Disord Rev. 24:247–50. DOI: 10.1002/erv.2432. PMID: 26841114. PMCID: PMC4821688.
crossref
37. Adeniyi AF, Sanya AO, Fasanmade AA, Borodo M, Uloko AE. 2010; Relationship between duration of diagnosis and neuromusculoskeletal complications of middle-aged type 2 diabetes patients. West Afr J Med. 29:393–7. DOI: 10.4314/wajm.v29i6.68274. PMID: 21465447.
crossref
38. Velázquez-Rueda ML, Hernández-Méndez-Villamil E, Mendoza-Muñoz M, Rivas-Montero JA, Espinosa-Gutiérrez A. 2018; [Strength and function of hand before and after release of carpal tunnel in patients with type 2 diabetes mellitus by open and endoscopic approach. Case-control study]. Acta Ortop Mex. 32:22–7. Spanish. PMID: 30182542.
39. Oktayoglu P, Nas K, Kilinç F, Tasdemir N, Bozkurt M, Yildiz I. 2015; Assessment of the presence of carpal tunnel syndrome in patients with diabetes mellitus, hypothyroidism and acromegaly. J Clin Diagn Res. 9:OC14–8. DOI: 10.7860/JCDR/2015/13149.6101. PMID: 26266148. PMCID: PMC4525537.
crossref
40. Duclos M. 2016; Osteoarthritis, obesity and type 2 diabetes: the weight of waist circumference. Ann Phys Rehabil Med. 59:157–60. DOI: 10.1016/j.rehab.2016.04.002. PMID: 27211819.
crossref
41. Greene AK, Grant FD, Maclellan RA. 2015; Obesity-induced lymphedema nonreversible following massive weight loss. Plast Reconstr Surg Glob Open. 3:e426. DOI: 10.1097/GOX.0000000000000398. PMID: 26180727. PMCID: PMC4494496.
crossref
42. Stefansdottir R, Gudmundsdottir SL. 2017; Sedentary behavior and musculoskeletal pain: a five-year longitudinal Icelandic study. Public Health. 149:71–3. DOI: 10.1016/j.puhe.2017.04.019. PMID: 28558304.
crossref
43. Vancampfort D, Stubbs B, Koyanagi A. 2017; Physical chronic conditions, multimorbidity and sedentary behavior amongst middle-aged and older adults in six low- and middle-income countries. Int J Behav Nutr Phys Act. 14:147. DOI: 10.1186/s12966-017-0602-z. PMID: 29078781. PMCID: PMC5658996.
crossref
44. Stubbs B, Patchay S, Soundy A, Schofield P. 2014; The avoidance of activities due to fear of falling contributes to sedentary behavior among community-dwelling older adults with chronic musculoskeletal pain: a multisite observational study. Pain Med. 15:1861–71. DOI: 10.1111/pme.12570. PMID: 25224385.
crossref
45. Finan PH, Goodin BR, Smith MT. 2013; The association of sleep and pain: an update and a path forward. J Pain. 14:1539–52. DOI: 10.1016/j.jpain.2013.08.007. PMID: 24290442. PMCID: PMC4046588.
crossref
46. Taylor SS, Hughes JM, Coffman CJ, Jeffreys AS, Ulmer CS, Oddone EZ, et al. 2018; Prevalence of and characteristics associated with insomnia and obstructive sleep apnea among veterans with knee and hip osteoarthritis. BMC Musculoskelet Disord. 19:79. DOI: 10.1186/s12891-018-1993-y. PMID: 29523117. PMCID: PMC5845198.
crossref
47. Leung YY, Huebner JL, Haaland B, Wong SBS, Kraus VB. 2017; Synovial fluid pro-inflammatory profile differs according to the characteristics of knee pain. Osteoarthritis Cartilage. 25:1420–7. DOI: 10.1016/j.joca.2017.04.001. PMID: 28433814.
crossref
48. Parimi N, Blackwell T, Stone KL, Lui LY, Ancoli-Israel S, Tranah GJ, et al. 2012; Hip pain while using lower extremity joints and sleep disturbances in elderly white women: results from a cross-sectional analysis. Arthritis Care Res (Hoboken). 64:1070–8. DOI: 10.1002/acr.21630. PMID: 22298286. PMCID: PMC3355201.
49. Gay A, Culliford D, Leyland K, Arden NK, Bowen CJ. 2014; Associations between body mass index and foot joint pain in middle-aged and older women: a longitudinal population-based cohort study. Arthritis Care Res (Hoboken). 66:1873–9. DOI: 10.1002/acr.22408. PMID: 25047683. PMCID: PMC4282113.
crossref
50. Walsh TP, Arnold JB, Evans AM, Yaxley A, Damarell RA, Shanahan EM. 2018; The association between body fat and musculoskeletal pain: a systematic review and meta-analysis. BMC Musculoskelet Disord. 19:233. DOI: 10.1186/s12891-018-2137-0. PMID: 30021590. PMCID: PMC6052598.
crossref

Fig. 1
Prevalence and intensity of musculoskeletal pain in upper body segments. Error bars indicate confidence interval. aIntensity of pain. *P < 0.05.
KJP-33-245-f1.tif
Fig. 2
Prevalence and intensity of musculoskeletal pain in lower body segments. Error bars indicate confidence interval. aIntensity of pain. ***P < 0.001.
KJP-33-245-f2.tif
Table 1
Prevalence of Pain according to Body Regions in Severely Obese Individuals and Association with Sociodemographic and Lifestyle Variables (N = 150)
Independent variable Frequency n (%) Prevalence

Neck n (%) Shoulder n (%) Elbow n (%) Wrist/hands n (%) Upper back n (%) Lower back n (%) Hip n (%) Knee n (%) Ankle/feet n (%)
Sex
M 22 (14.7) 3 (13.6) 3 (13.6) 0 (0.0) 2 (9.1) 4 (18.2) 9 (40.9) 3 (13.6) 6 (27.3) 10 (45.4)
F 128 (85.3) 23 (17.9) 33 (25.8) 10 (7.8) 36 (28.1)a 52 (40.6)a 68 (53.1) 38 (29.7)a 59 (46.1)a 83 (64.8)a
Age (yr)
≤ 39 84 (56.0) 11 (13.1) 16 (19.0) 4 (4.8) 19 (22.6) 32 (38.1) 44 (52.4) 17 (20.2) 35 (41.7) 49 (58.3)
≥ 40 66 (44.0) 15 (22.7)a 20 (30.3)a 6 (9.1) 19 (28.8) 24 (36.4) 33 (50.0) 24 (36.4)* 30 (45.4) 44 (66.7)
Skin color
White 46 (30.7) 10 (21.7) 14 (30.4) 4 (8.7) 13 (28.3) 21 (45.6) 21 (45.6) 16 (34.8) 22 (47.8) 29 (63.0)
Brown and black 104 (69.3) 16 (15.4) 22 (21.1) 6 (5.8) 25 (24.0) 35 (33.6)a 56 (53.8) 25 (24.0)a 43 (41.3) 64 (61.5)
Living with partner
No 55 (36.7) 8 (14.5) 11 (20.0) 3 (5.4) 12 (21.8) 19 (34.5) 28 (50.9) 17 (30.9) 26 (47.3) 34 (61.8)
Yes 95 (63.3) 18 (18.9) 25 (26.3) 7 (7.4) 26 (27.4) 37 (38.9) 49 (51.6) 24 (25.3) 39 (41.0) 59 (62.1)
Years of schooling
≤ 10 75 (50.0) 14 (18.7) 18 (24.0) 4 (5.3) 22 (29.3) 32 (42.7) 39 (52.0) 24 (32.0) 33 (44.0) 48 (64.0)
≥ 11 75 (50.0) 12 (16.0) 18 (24.0) 6 (8.0) 16 (21.3) 24 (32.0)a 38 (50.7) 17 (22.7) 32 (42.7) 45 (60.0)
Economic class
A-B 34 (22.7) 5 (14.7) 4 (11.7) 0 (0.0) 5 (14.7) 8 (23.5) 14 (41.2) 5 (14.7) 10 (29.4) 18 (52.9)
C 92 (61.3) 15 (16.3) 23 (25.0) 7 (7.6) 25 (27.2) 36 (39.1) 48 (52.2) 24 (26.1) 40 (43.5) 57 (62.0)
D-E 24 (16.0) 6 (25.0) 9 (37.5)a 3 (12.5) 8 (33.3) 12 (50.0)a 15 (62.5) 12 (50.0)* 15 (62.5)* 18 (75.0)a
Occupation
Formal worker 50 (33.3) 9 (18.0) 13 (26.0) 5 (10.0) 11 (22.0) 18 (36.0) 29 (58.0) 14 (28.0) 19 (38.0) 32 (64.0)
Informal worker/autonomous 52 (34.7) 8 (15.4) 11 (21.2) 3 (5.8) 13 (25.0) 19 (36.5) 25 (48.1) 11 (21.1) 18 (34.6) 30 (57.7)
Retired/housekeeper and othersb 48 (32.0) 9 (18.7) 12 (25.0) 2 (4.2) 14 (29.2) 19 (39.6) 23 (47.9) 16 (33.3) 28 (58.3)* 31 (64.6)
Smoking status
No 101 (67.3) 16 (15.8) 25 (24.7) 5 (4.9) 24 (23.8) 35 (34.6) 49 (48.5) 27 (26.7) 43 (42.6) 60 (59.4)
Yes, former or current smoker 49 (32.7) 10 (20.4) 11 (22.4) 5 (10.2) 14 (28.6) 21 (42.9) 28 (57.1) 14 (28.6) 22 (44.9) 33 (67.3)
Binge drinking
No 107 (71.3) 21 (19.6) 26 (24.3) 6 (5.6) 27 (25.2) 38 (35.5) 53 (49.5) 27 (25.2) 46 (43.0) 68 (63.5)
Yes 43 (28.7) 5 (11.6) 10 (23.3) 4 (9.3) 11 (25.6) 18 (41.9) 24 (55.8) 14 (32.6) 19 (44.2) 25 (58.1)
Sedentary time (min/day)
Lower 71 (50.3) 20 (28.2)* 24 (33.8)* 6 (8.4) 24 (33.8)a 30 (42.2) 41 (57.7) 26 (36.6)* 33 (46.5) 44 (62.0)
Higher 70 (49.6) 5 (7.1) 12 (17.1) 4 (5.7) 14 (20.0) 25 (35.7) 34 (48.6) 14 (20.0) 30 (42.9) 45 (64.3)
Daily fruits intake
No 110 (73.3) 23 (20.9)a 27 (24.5) 7 (6.4) 28 (25.4) 44 (40.0) 59 (53.6) 30 (27.3) 50 (45.4) 68 (61.8)
Yes 40 (26.7) 3 (7.5) 9 (22.5) 3 (7.5) 10 (25.0) 12 (30.0) 18 (45.0) 11 (27.5) 15 (37.5) 25 (62.5)
Daily vegetables intake
No 109 (72.7) 18 (16.5) 23 (21.1) 8 (7.3) 28 (25.7) 41 (37.6) 54 (49.5) 27 (24.8) 48 (44.0) 63 (57.8)
Yes 41 (27.3) 8 (19.5) 13 (31.7)a 2 (4.9) 10 (24.4) 15 (36.6) 24 (58.5) 14 (34.1) 17 (41.5) 30 (73.2)a

Sedentary time n = 141. Wald’s test for all P values, except when frequencies were smaller than five in each case, Fisher's exact test was used. Economic class “Gross average family income in the month in R $ per class”: A-B = > 3,118, C = 896 to 3,117, D-E = ≤ 895.

a P < 0.20, bOthers include: student, rural worker, unemployed, leaning, pensioner, beneficiary of illness aid.

* P < 0.05.

Table 2
Prevalence of Pain according to Body Regions in Severely Obese Individuals and Association with Clinical, Anthropometric and Body Composition Variables (N = 150)
Independent variable Frequency n (%) Prevalence

Neck n (%) Shoulder n (%) Elbow n (%) Wrist/hands n (%) Upper back n (%) Lower back n (%) Hip n (%) Knee n (%) Ankle/feet n (%)
Family history of hypertension
No 17 (11.3) 3 (17.6) 1 (5.9) 1 (5.9) 3 (17.6) 3 (17.6) 7 (41.2) 5 (29.4) 6 (35.3) 7 (41.2)
Yes 133 (88.7) 23 (17.3) 35 (26.3)a 9 (6.8) 35 (26.3) 53 (39.8)a 70 (52.6) 36 (27.1) 59 (44.4) 86 (64.7)a
Family history of diabetes
No 34 (22.7) 7 (20.6) 5 (14.7) 1 (2.9) 8 (23.5) 9 (26.5) 16 (47.1) 10 (29.4) 14 (41.2) 18 (52.9)
Yes 116 (77.3) 19 (16.4) 31 (26.7)a 9 (7.8) 30 (25.9) 47 (40.5)a 61 (52.6) 31 (26.7) 51 (44.0) 75 (64.7)
Family history of depression
No 85 (57.8) 13 (15.3) 16 (18.8) 5 (5.9) 20 (23.5) 32 (37.6) 39 (45.9) 21 (24.7) 35 (41.1) 50 (58.8)
Yes 62 (42.2) 12 (19.3) 18 (29.0) 5 (8.1) 16 (25.8) 23 (37.1) 36 (58.1)a 19 (30.6) 29 (46.8) 41 (66.1)
Fall in the last 12 mo
No 97 (72.9) 17 (17.5) 26 (26.8) 6 (6.2) 28 (28.9) 33 (34.0) 49 (50.5) 25 (25.8) 40 (41.2) 58 (59.8)
Yes 36 (27.1) 7 (19.4) 9 (25.0) 3 (8.3) 9 (25.0) 18 (50.0)a 21 (58.3) 12 (33.3) 19 (52.8) 27 (75.0)a
Fracture
No 95 (71.4) 18 (18.9) 25 (26.3) 6 (6.3) 26 (27.4) 33 (34.7) 47 (49.5) 24 (25.3) 40 (42.1) 58 (61.0)
Yes 38 (28.6) 6 (15.8) 10 (26.3) 3 (7.9) 11 (28.9) 18 (47.4)a 23 (60.5) 13 (34.2) 19 (50.0) 27 (71.0)
Difficulty of sleeping or insomnia
No 77 (56.2) 15 (19.5) 20 (25.0) 3 (3.9) 17 (22.1) 29 (37.7) 37 (48.0) 15 (19.5)* 25 (32.5)* 45 (58.4)
Yes 60 (43.9) 10 (16.7) 16 (26.7) 6 (10.0)a 20 (33.3)a 25 (41.7) 36 (60.0)a 24 (40.0)a 35 (58.3)* 41 (68.3)
Depression
No 55 (36.7) 5 (9.1) 7 (12.7) 3 (5.5) 8 (14.5) 16 (29.1) 25 (45.4) 10 (18.2) 18 (32.7) 28 (50.9)
Yes 95 (63.3) 21 (22.1)* 29 (30.5)* 7 (7.4) 30 (31.6)* 40 (42.1)a 52 (54.7) 31 (32.7)a 47 (49.5)a 65 (68.4)*
Anxiety
No 41 (27.3) 3 (7.3) 5 (12.2) 1 (2.4) 4 (9.8) 13 (31.7) 18 (43.9) 5 (12.2) 13 (31.7) 21 (51.2)
Yes 109 (72.7) 23 (21.1)a 31 (28.4)a 9 (8.3) 34 (31.2)* 43 (39.4) 59 (54.1) 36 (33.0)* 52 (47.7)a 72 (66.1)a
Arthritis/arthrosis
No 118 (78.7) 17 (14.5) 24 (20.5) 5 (4.3) 25 (21.4) 43 (36.7) 59 (50.4) 26 (22.2) 45 (38.5) 69 (59.0)
Yes 32 (21.3) 9 (28.1)a 12 (37.5)* 5 (15.6)* 13 (40.6)a 13 (40.6) 18 (56.2) 15 (46.9)* 20 (62.5)* 23 (71.9)a
Type 2 diabetes
No 90 (60.0) 12 (13.3) 21 (23.3) 6 (6.7) 18 (20.0) 33 (36.7) 48 (53.3) 22 (24.4) 42 (46.7) 52 (57.8)
Yes 60 (40.0) 14 (23.3)a 15 (25.0) 4 (6.7) 20 (33.3)a 23 (38.3) 29 (48.3) 19 (31.7) 23 (38.3) 41 (68.3)a
Edema in lower limbs
No 37 (24.7) 3 (8.1) 6 (16.2) 0 (0.0) 3 (8.1) 7 (18.9) 12 (32.4) 6 (16.2) 9 (24.3) 13 (35.1)
Yes 113 (75.3) 23 (20.3)a 30 (26.5) 10 (8.8) 35 (31.0)* 49 (43.4)* 65 (57.5)* 35 (31.0)a 56 (49.6)* 80 (70.8)*
Use of analgesics
No 84 (56.0) 13 (15.5) 19 (22.6) 5 (5.9) 17 (20.2) 28 (33.3) 44 (52.4) 20 (23.8) 32 (38.1) 49 (58.3)
Yes 66 (44.0) 13 (19.7) 17 (25.8) 5 (7.6) 21 (31.8)a 28 (42.4) 33 (50.0) 21 (31.8) 33 (50.0)a 44 (66.7)
Use of NSAIDs
No 115 (76.7) 19 (16.5) 27 (235) 6 (5.2) 27 (23.5) 42 (36.5) 57 (496) 29 (25.2) 47 (40.9) 67 (58.3)
Yes 35 (23.3) 7 (20.0) 9 (25.7) 4 (11.4) 11 (31.4) 14 (40.0) 20 (57.1) 12 (34.3) 18 (51.4) 26 (74.3)a
Use of statin
No 140 (93.3) 22 (15.7) 33 (23.6) 10 (7.1) 36 (25.7) 52 (37.1) 70 (50.0) 38 (27.1) 60 (42.9) 85 (60.7)
Yes 10 (6.7) 4 (40.0)a 3 (30.0) 0 (00.0) 2 (20.0) 4 (40.0) 7 (70.0) 3 (30.0) 5 (50.0) 8 (80.0)
Use of muscle relaxants
No 68 (45.3) 10 (14.7) 14 (20.6) 2 (2.9) 15 (22.1) 27 (39.7) 32 (47.1) 21 (30.9) 30 (44.1) 37 (54.4)
Yes 82 (54.7) 16 (19.5) 22 (26.8) 8 (9.8)a 23 (28.0) 29 (35.4) 45 (54.9) 20 (24.4) 35 (42.7) 56 (68.3)a
Uric acid (mg/dL)
Adequate 131 (87.3) 23 (17.6) 33 (25.2) 10 (7.6) 34 (25.9) 49 (37.4) 69 (52.7) 35 (26.7) 57 (43.5) 82 (62.6)
Inadequate 19 (12.7) 3 (15.8) 3 (15.8) 0 (0.0) 4 (21.0) 7 (36.8) 8 (42.1) 6 (31.6) 8 (42.1) 11 (57.9)
Vitamin D
Adequate 70 (46.7) 11 (15.7) 15 (21.4) 4 (5.7) 20 (28.6) 27 (38.6) 34 (48.6) 20 (26.3) 30 (42.9) 44 (62.9)
Inadequate 80 (53.3) 15 (18.7) 21 (26.2) 6 (7.5) 18 (22.5) 29 (36.2) 43 (53.7) 21 (26.2) 35 (43.7) 49 (61.2)
C-reactive protein (mg/dL)
Non-reagent 108 (72.0) 19 (17.6) 27 (25.0) 9 (8.3) 31 (28.7)a 43 (39.8) 60 (55.6)a 30 (27.8) 45 (41.7) 68 (63.0)
Reagent 42 (28.0) 7 (16.7) 9 (21.4) 1 (2.4) 7 (16.7) 13 (30.9) 17 (40.5) 11 (26.2) 20 (47.6) 25 (59.5)
Hemoglobin (g/dL)
Adequate 134 (89.9) 24 (17.9) 35 (26.1)a 9 (6.7) 34 (25.4) 50 (37.3) 70 (52.2) 37 (27.6) 58 (43.3) 85 (63.4)
Inadequate 15 (10.1) 2 (13.3) 1 (6.7) 1 (6.7) 4 (26.7) 6 (40.0) 7 (46.7) 4 (26.7) 7 (46.7) 7 (46.7)
Total cholesterol (mg/dL)
Adequate 138 (92.0) 25 (18.1) 34 (24.6) 8 (5.8)a 36 (26.1) 51 (37.0) 68 (49.3)* 39 (28.3) 61 (44.2) 84 (60.9)
Inadequate 12 (8.0) 1 (8.3) 2 (16.7) 2 (16.7) 2 (16.7) 5 (41.7) 9 (75.0) 2 (16.7) 4 (33.3) 9 (75.0)
HDL (mg/dL)
Adequate 15 (10.0) 2 (13.3) 5 (33.3) 1 (6.7) 4 (26.7) 8 (53.3) 8 (53.3) 4 (26.7) 8 (53.3) 10 (66.7)
Inadequate 135 (90.0) 24 (17.8) 31 (23.0) 9 (6.7) 34 (25.2) 48 (35.6)a 69 (51.1) 37 (27.4) 57 (42.2) 83 (61.5)
LDL (mg/dL)
Adequate 138 (93.9) 24 (17.4) 33 (23.9) 10 (7.2) 38 (27.5) 51 (37.0) 69 (50.0) 40 (29.0) 62 (44.9) 85 (61.6)
Inadequate 9 (6.1) 1 (11.1) 2 (22.2) 0 (0.0) 0 (0.0) 4 (44.4) 7 (77.8)a 1 (11.1) 3 (33.3) 6 (66.7)
Body mass index (kg/m2)
35.0-39.9 25 (16.7) 5 (20.0) 9 (36.0) 1 (4.0) 6 (24.0) 7 (28.0) 9 (36.0) 8 (32.0) 10 (40.0) 11 (44.0)
40.0-49.9 84 (56.0) 15 (17.9) 19 (22.6) 6 (7.1) 24 (28.6) 35 (41.7) 51 (60.7)* 24 (28.6) 36 (42.9) 60 (71.4)
>50 41 (27.3) 6 (14.6) 8 (19.5) 3 (7.3) 8 (19.5) 14 (34.1) 17 (41.5) 9 (21.9) 19 (46.3) 22 (53.7)*
Total fat %
1 tercile 38 (34.2) 7 (18.4) 10 (26.3) 2 (5.3) 11 (29.0) 12 (31.6) 21 (55.3) 10 (26.3) 15 (39.5) 24 (63.2)
2 tercile 36 (32.4) 7 (19.4) 8 (22.2) 2 (5.6) 10 (27.8) 11 (30.6) 16 (44.4) 08 (22.2) 14 (38.9) 20 (55.6)
3 tercile 37 (33.3) 9 (24.3) 12 (32.4) 5 (13.5) 11 (29.7) 22 (59.5)* 25 (67.6)a 15 (40.5)a 19 (51.3) 29 (78.4)a

Fall in the last 12 mo and fracture n = 133, LDL n = 147, Total fat % n = 111, Hemoglobin n = 149. Wald’s test for all P values, except when frequencies were smaller than five in each case, Fisher's exact test was used.

NSAIDs: non-steroidal anti-inflammatory drugs.

a P < 0.20.

* P < 0.05.

Table 3
Multiple Regression Analysis of the Association between Pain in Upper Body Regions and Independent Variables in Severely Obese Individuals
Independent variable Neck Shoulder Wrist/hands Upper back


PR (95% CI) P value PR (95% CI) P value PR (95% CI) P value PR (95% CI) P value
1st level
Age (yr) - - - -
≤ 40 1 1 - - - -
≥ 40 1.63 (0.8-3.2) 0.172 1.38 (0.79-2.44) 0.261
Skin color
White - - - - - - 1.45 (0.91-2.31) 0.113
Brown and black - - - - - - 1
Years of schooling
≤ 10 - - - - - - 1.22 (0.78-1.89) 0.383
≥ 11 - - - - - - 1
2nd level
Sedentary time (min/day)
Lower - - 1.76 (0.96-3.23) 0.066 0.59 (0.33-1.06) 0.078 - -
Higher - - 1 1 - -
Daily vegetables intake
No - - 0.73 (0.41-1.29) 0.280 - - - -
Yes - - 1 - - - -
3rd level
Fall in the last 12 mo
No - - - - - - 1
Yes - - - - - - 1.02 (0.62-1.69) 0.927
Fracture
No - - - - - - 1
Yes - - - - - - 1.36 (0.85-2.19) 0.198
Difficulty of sleeping or insomnia
No - - - - 1 - -
Yes - - - - 1.44 (0.85-2.43) 0.176 - -
Depression
No - - - - - - 1
Yes - - - - - - 1.51 (0.83-2.75) 0.180
Arthritis/arthrosis
No - - 1 1 - -
Yes - - 1.57 (0.90-2.73) 0.108 1.39 (0.80-2.43) 0.236 - -
Type 2 diabetes
No 1 - - 1 - -
Yes 1.64 (0.82-3.28) 0.158 - - 1.82 (1.06-3.11) 0.029* - -
Use of analgesics
No - - - - 1
Yes - - - - 1.51 (0.87-2.61) 0.141
Total fat %
1 tercile - - - - - - 1.17 (0.59-2.35) 0.648
2 tercile - - - - - - 1
3 tercile - - - - - - 1.75 (0.95-3.23) 0.073

Wald’s test for all P values. 1st level: distal, 2nd level: intermediate, 3rd level: proximal.

PR: prevalence ratio, CI: confidence interval, –: not available.

* Significant association (P < 0.05).

Table 4
Multiple Regression Analysis of the Association between Pain in Lower Body Regions and Independent Variables in Severely Obese Individuals
Independent variable Lower back Hip Knee Ankle/feet


PR (95% CI) P value PR (95% CI) P value PR (95% CI) P value PR (95% CI) P value
1st level
Sex
M - - - - - - 1
F - - - - - - 1.92 (0.54-6.81) 0.311
Age (yr)
≤ 40 - - 1 - - - -
≥ 40 - - 1.5 (0.92-2.60) 0.100 - - - -
Skin color
White - - 1.36 (0.82-2.24) 0.236 - - - -
Brown and black - - 1 - - - -
Economic class
A-B - - - - 1 1
C - - - - 1.02 (0.59-1.76) 0.943 1.12 (0.80-1.57) 0.499
D-E - - - - 1.54 (0.88-2.71) 0.134 1.25 (0.89-1.77) 0.199
Occupation
Formal worker - - - - 0.94 (0.56-1.56) 0.806 - -
Informal worker/freelance - - - - 1 - -
Retired/domestic worker and othersa - - - - 1.27 (0.81-1.99) 0.303 - -
2nd level
Sedentary time (min/day) - -
Lower - - 1.84 (1.05-3.21) 0.032* - - - -
Higher - - 1 - - - -
Daily vegetables intake
No - - - - - - 0.82 (0.64-1.05) 0.120
Yes - - - - - - 1
3rd level
Family history of depression
No 1 0.532 - - - - - -
Yes 1.10 (0.81-1.49) - - - - - -
Fall in the last 12 mo
No - - - - - - 1
Yes - - - - - - 1.12 (0.89-1.40) 0.329
Difficulty of sleeping or insomnia
No 1 1 1 - -
Yes 1.29 (0.95-1.76) 0.100 2.23 (1.29-3.86) 0.004* 1.59 (1.07-2.35) 0.021* - -
Depression
No - - 1 1 1
Yes - - 1.24 (0.67-2.29) 0.491 1.23 (0.76-1.99) 0.394 0.97 (0.73-1.27) 0.804
Anxiety
No - - - - 1 1
Yes - - - - 1.14 (0.65-1.99) 0.654 1.23 (0.88-1.71) 0.219
Arthritis/arthrosis
No - - 1 1 1
Yes - - 1.46 (0.88-2.43) 0.140 1.44 (0.99-2.09) 0.056 0.97 (0.68-1.38) 0.848
Type 2 diabetes
No - - - - - - 1
Yes - - - - - - 1.09 (0.84-1.43) 0.506
Edema in lower limbs
No 1 - - - - 1
Yes 1.84 (1.07-3.14) 0.026* - - - - 2.07 (1.25-3.43) 0.005*
Use of analgesics
No - - - - 1 - -
Yes - - - - 1.35 (0.94-1.94) 0.104 - -
Use of NSAIDs
No - - - - - - 1
Yes - - - - - - 1.29 (0.97- 1.71) 0.078
Use of statin
No - - - - - - 1
Yes - - - - - - 0.99 (0.77-1.28) 0.968
C-reactive protein (mg/dL)
Non-reagent 1.25 (0.85-1.82) 0.251 - - - - - -
Reagent 1 - - - - - -
Degree of obesity (kg/m2) - -
35.0-39.9 - - - - - - 1
40.0-49.9 - - - - - - 1.91 (1.14-3.18) 0.013*
> 50 - - - - - - 1.44 (0.78-2.66) 0.242
Total fat %
1 tercile 1.31 (0.85-2.02) 0.229 - - - - 1.57 (1.09-2.25) 0.016*
2 tercile 1 - - - - 1
3 tercile 1.45 (0.97-2.18) 0.072 - - - - 1.36 (0.98-1.90) 0.065

Wald’s test for all P values. Economic class “Gross average family income in the month in R $ per class”: A-B = > 3,118, C = 896 to 3,117, D-E = ≤ 895. 1st level: distal, 2nd level: intermediate, 3rd level: proximal.

PR: prevalence ratio, CI: confidence interval, NSAIDs: non-steroidal anti-inflammatory drugs.

a Others include: student, rural worker, unemployed, leaning, pensioner, beneficiary of illness aid.

* Significant association (P < 0.05).

TOOLS
Similar articles