Journal List > Int J Stem Cells > v.7(2) > 1159113

Kamel Ismail, Morcos, Eldin Mohammad, and Gamal Aboulkhair: Enhancement of Neural Stem Cells after Induction of Depression in Male Albino Rats (A histological & Immunohistochemical Study)

Abstract

Background and Objectives:

Depression is one of the most prevalent psychiatric disorders. Endogenous neural stem cells (NSCs) could replace damaged Hippocampal neurons in depression. This work was planned to evaluate Rhodiola rosea (Rr) extract possible role in stimulation of NSCs proliferation and in depression improvement.

Methods and Results:

Thirty adult male albino rats were divided into three groups; control, untreated depressed model and Rr model. After depression induction by chronic mild stress, rats received Rr extract 1.5 g/kg/day for three weeks. The sucrose preference test (SP) was done before, after depression induction and 3 weeks after supplementation of Rr. The brain was removed and processed for H&E and immunohistochemical staining for caspase 3, glial fibrillary acid protein (GFAP) and proliferating cell nuclear antigen (PCNA). Rr group revealed improved sucrose preference, increased undamaged neurons and decreased dark neurons. Moreover, Caspase 3 +ve cells were not detected, GFAP +ve cells increased and PCNA +ve cells were detected only in Rr group.

Conclusions:

This work points to the role of Rr in depression improvement and in stimulation of NSCs proliferation.

Introduction

Depression is one of the most prevalent psychiatric disorders faced by humans. It impairs quality of life due to its high morbidity and recurrence rate. It results from the interaction of nerve-endocrine-immunology system (1).
The recent finding that endogenous NSCs reside in the subventricular zone (SVZ) and dentate gyrus (DG) of the adult mammalian brain opens the possibility of using these resident NSCs for cell replacement therapies in neurological disorders (2).
Oxidative stress including exposure to reactive oxygen species (ROS) inhibits neurogenesis and is associated with cognitive impairments. Consumption of potent anti-oxidants could improve neurogenesis and decrease the impairment of cognitive functions (3).
Rhodiola rosea (Rr) extract belongs to crassulaceae integripetal Rhodiola herb genus. It contains over 40 chemical components including salidroside and rosavins which are considered two of the major active components. The effects of Rhodiola rosea components include anti- oxidative, down-hyperglycemia, anti-tumor, adaptogenic, anti-stress, anti-anoxia, anti- fatigue, immunity improvement and protection of central nervous system and cardiovascular system (4).
This work was planned to evaluate Rr extract possible role in stimulation of NSCs proliferation and in depression improvement.

Materials and Methods

Drugs

Rhodiola: it was purchased from NOW FOODS Company (Glen Ellyn Rd, USA) in the form of a bottle containing 60 capsules each contains 500mg of Rr root extract (3% total rosavins and 1% salidrosides).

Experimental design

Thirty adult male albino rats (180∼200 g) were housed in Kasr AlAiny Animal House & treated according to animal rights committee. Animals were fed on ordinary diet for 1 week (to adapt rats for new housing). Sucrose solution (1% sucrose in distilled H2O) was added (in bottles) for the second week to adapt rats for its taste (sucrose adaptation period). At the beginning of the third week, rats were divided into three groups: Group I: (control group, n. =10 rats). Rats received no treatment for 4 weeks (weeks 3–6) then received distilled water 1.5 ml once daily by gastric gavage for three weeks (weeks 7–9). Group II: (untreated depressed group, n. =10 rats). Induction of depression by Chronic Mild Stress (CMS) was performed for 4 weeks (weeks 3∼6) as described by Dang et al. (5). Then, rats received distilled water 1.5 ml once daily by gastric gavage for 3 weeks (weeks 7∼9). Group III: (Rr group n. =10 rats). Depressed rats were prepared as in group II (weeks 3∼6), then they received Rr extract (1.5 g/kg/day) dissolved in 1.5 ml distilled water by gastric gavage for 3 weeks (weeks 7∼9) according to Chen et al. (1).

Induction of depression

The Chronic Mild Stress (CMS) procedure (eight stressors) was performed to the target rats (groups II and III). Those stressors included: food or water deprivation for 23 hours; cage tilt (45°) for 23 hours; continuous overnight illumination; soiled cage (100 ml of water spilled into the bedding) for 23 hours; cold water swimming (4°C for 5 min); empty water bottles for 23 hours; behavior restraint in a tube (diameter, 8 cm; length, 20 cm) for 2 hours; intermittent illumination (light on and off) every 2 hours. These stressors continued for 4 weeks. Each animal received one stressor per day. Those stressors have been proven to induce depression (5).

Sucrose Preference test

The sucrose preference test was used to detect anhedonia (loss of pleasure of the taste) which is an indicator of depression. It involved 23 hours deprivation of food and water, followed by presentation of 1% sucrose solution and tap water in two different bottles for 1 hour. Intake was calculated by measuring the weight of bottles before and after consumption. The sucrose preference test was done and body weight was measured at the end of week 2, week 6 and week 9. The Sucrose Preference (SP) was calculated according to the following equation: SP=sucrose intake/ (sucrose intake+water intake)×100=X%. Anhedonia was considered when SP was decreased (1, 6).

Dissection and processing of samples

At the end of week 9, the animals were anaesthetized with ketamine (100 mg/kg)/xylazine (10 mg/kg) i.p injection. The chest wall was opened, the descending aorta was ligated and animals were perfused transcardially, via the left ventricle, with 10% formol saline. The right atrium was opened (a small slit opening) once perfusion has started. The perfusion was stopped when the venous return from the right atrium became clear (7).
The brains of all groups were dissected out from the sacrificed rats, fixed in 10% formol saline, kept for 24 hours then serial coronal sections were cut till the hippocampus appeared. The tissue was then dehydrated in ascending grades of alcohol (70%, 95%, 100%), cleared in xylene then embedded into paraffin wax (Histology Department, Faculty of Medicine, Cairo University). Sections of 5 μm thickness were stained with Hematoxylin & Eosin and immunohistochemical staining (8).

Immunohistochemistry

It was done using anti Caspase 3 antibodies to detect apoptotic cells [Primary antibody: Anti-Caspase 3 antibody (ab4051), Abcam Inc., Cambridge, USA], anti GFAP antibodies to detect astrocytes [Primary antibody: GFAP Ab-6 (Clone ASTRO6), Lab Vision Corporation laboratories, CA 94539, USA, catalogue number MS-1376-P] and anti PCNA antibodies to detect proliferating cells [Primary antibody: PCNA Ab-1 (Clone PC10), Lab Vision Corporation laboratories, CA 94539, USA, catalogue number MS-106-P].
Paraffin sections were deparaffinized in xylene for 1∼2 minutes, rehydrated in descending grades of ethanol then brought to distilled water for 5 minutes. Sections were incubated in hydrogen peroxide for 30 minutes then rinsed in PBS (3 times, 2 minutes each). Each section was incubated for 60 minutes with 2 drops (= 100 μl) of the primary antibody (Caspase 3, GFAP or PCNA). Slides were rinsed well in PBS (3 times, 2 min. each), incubated for 20 minutes with 2 drops of biotinylated secondary antibody for each section then rinsed well with PBS. Each section was incubated with 2 drops enzyme conjugate “Streptavidin-Horseradish peroxidase” for 10 minutes at room temperature then washed in PBS. Substrate-chromogen (DAB) mixture (2 drops) was applied to each section and incubated at room temperature for 5–10 min. then rinsed well with distilled water. Slides were counterstained with hematoxylin, dehydrated and mounted. Immunoreactive cells showed brown deposits. All steps were performed in a humidity chamber to prevent drying of the tissues. Non-specific background elimination step was omitted.

Morphometric study

Data were obtained using “Leica Qwin 500 C” image analyzer computer system Ltd. (Cambridge, England). Mean number of neurons (undamaged and dark neurons) / HPF in H&E stained sections and mean area percent of GFAP immunopositive cells were measured in DG of all immunostained hippocampal sections. From each section 10 non overlapping fields were examined using an objective lens ×40 (=total magnification ×400) and the mean value for each slide was obtained.

Statistical methods

Data were tabulated and statistically analyzed to evaluate the difference between the groups as regards the various parameters. The mean, standard deviation and analysis of variance (ANOVA) were calculated using EXCEL and SPSS 9 software. Results were considered statistically significant when p was < 0.05 (9).

RESULTS

I-Body weight (Bw) (Table 1)

The mean Bw values of depressed rats were significantly decreased at the end of week 6 & 9 when compared to control rats. The mean Bw values of Rr group revealed significant increase at the end of week 9 when compared with depressed rats and nonsignificant change when compared with the control rats.

II-Sucrose Preference (SP) (Table 2)

The mean SP values of depressed rats were significantly decreased at the end of week 6 & 9 when compared to control rats. The mean SP values of Rr group revealed significant increase at the end of week 9 when compared with depressed rats. Rr rats returned to the normal level.

III-Histological results

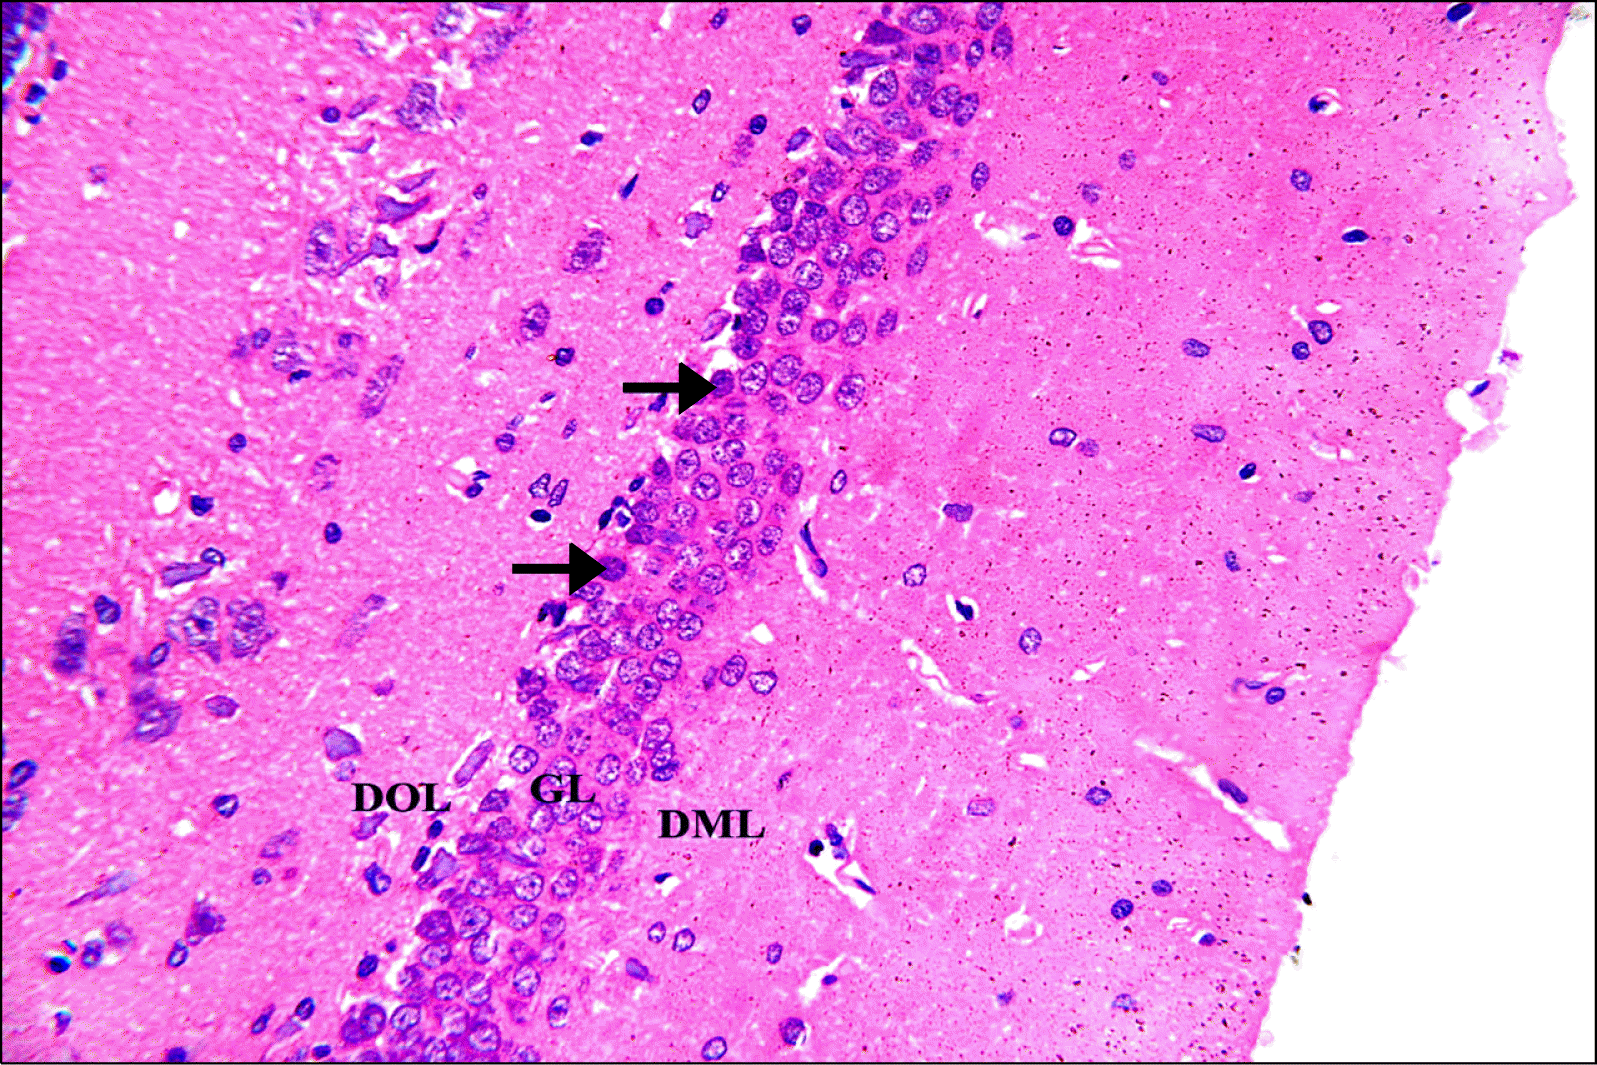
Hematoxylin and Eosin stained hippocampal sections: Control group revealed normal structure of the dentate gyrus (DG). The DG was a C-shape capping the free border of CA4 with upper and lower limbs. The DG consisted of three layers; an outer dentate molecular layer (DML), a principle crowded middle granular layer (GL) and an inner dentate polymorphic layer (DOL). The DOL and DML are the least cellular layers; they are formed of few neurons and glial cells in between many neuronal processes. GL was formed of 5∼6 rows of closely packed neurons with rounded vesicular nuclei, prominent nucleoli and scanty basophilic cytoplasm. Few dark nuclei appeared in the deep layer of granular cells (Fig. 1).
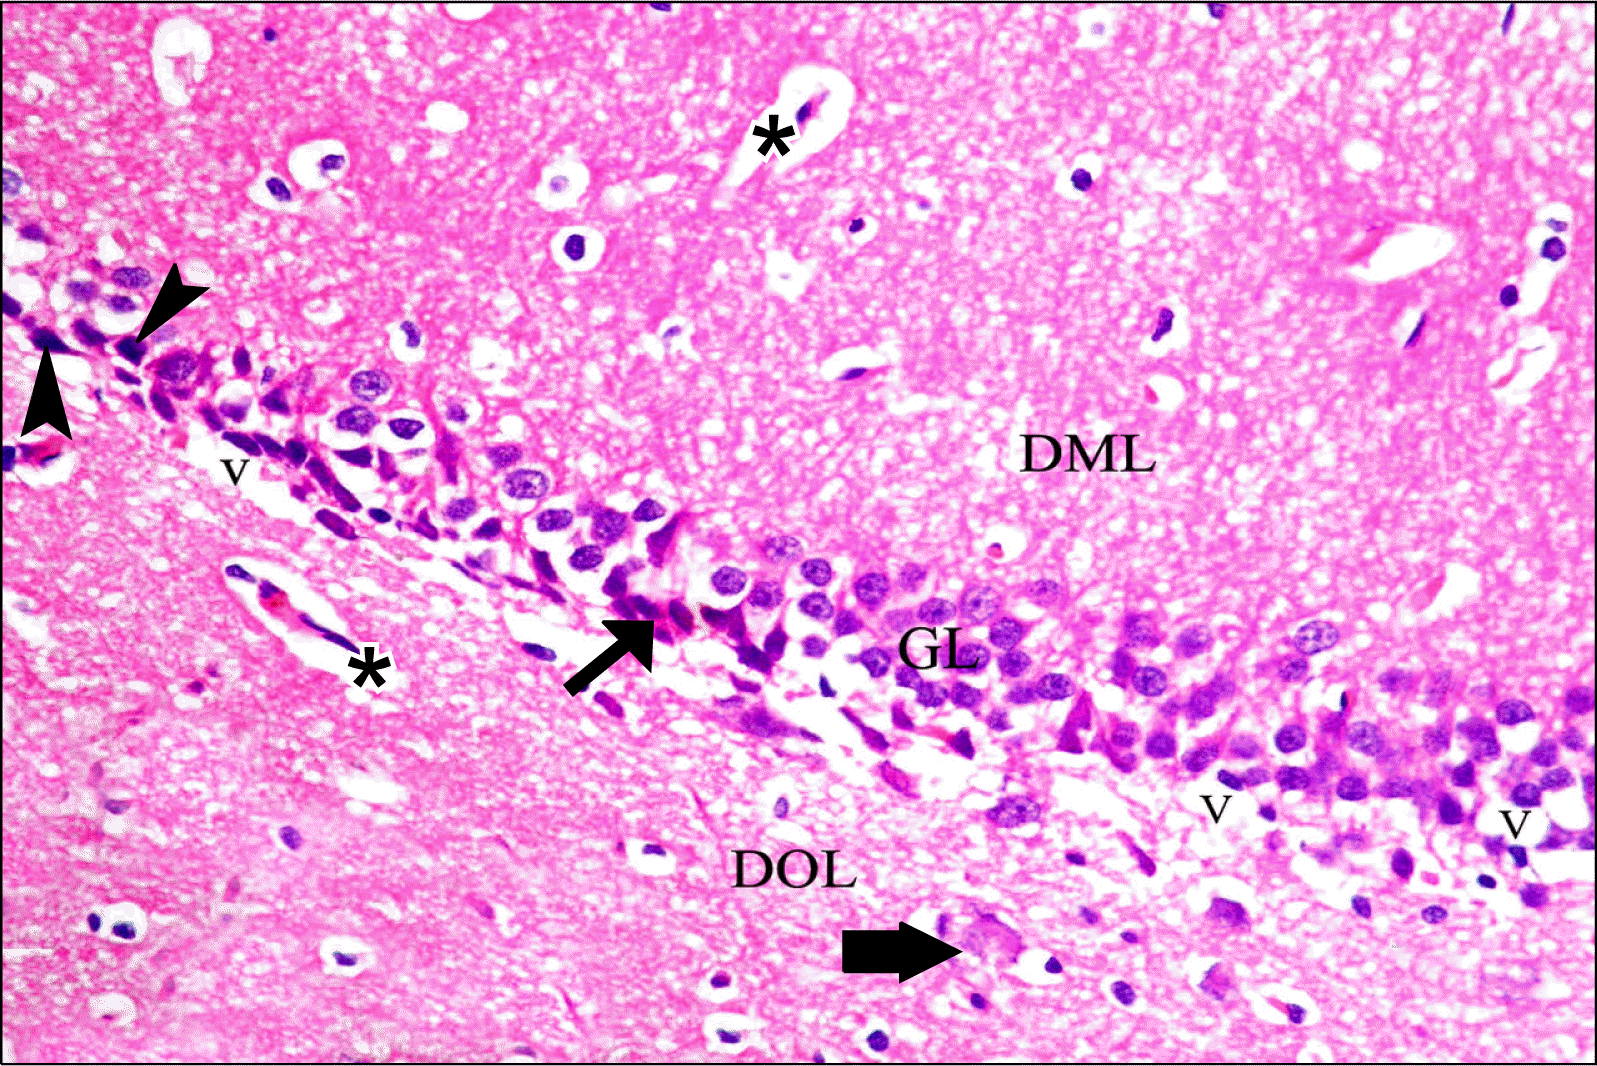
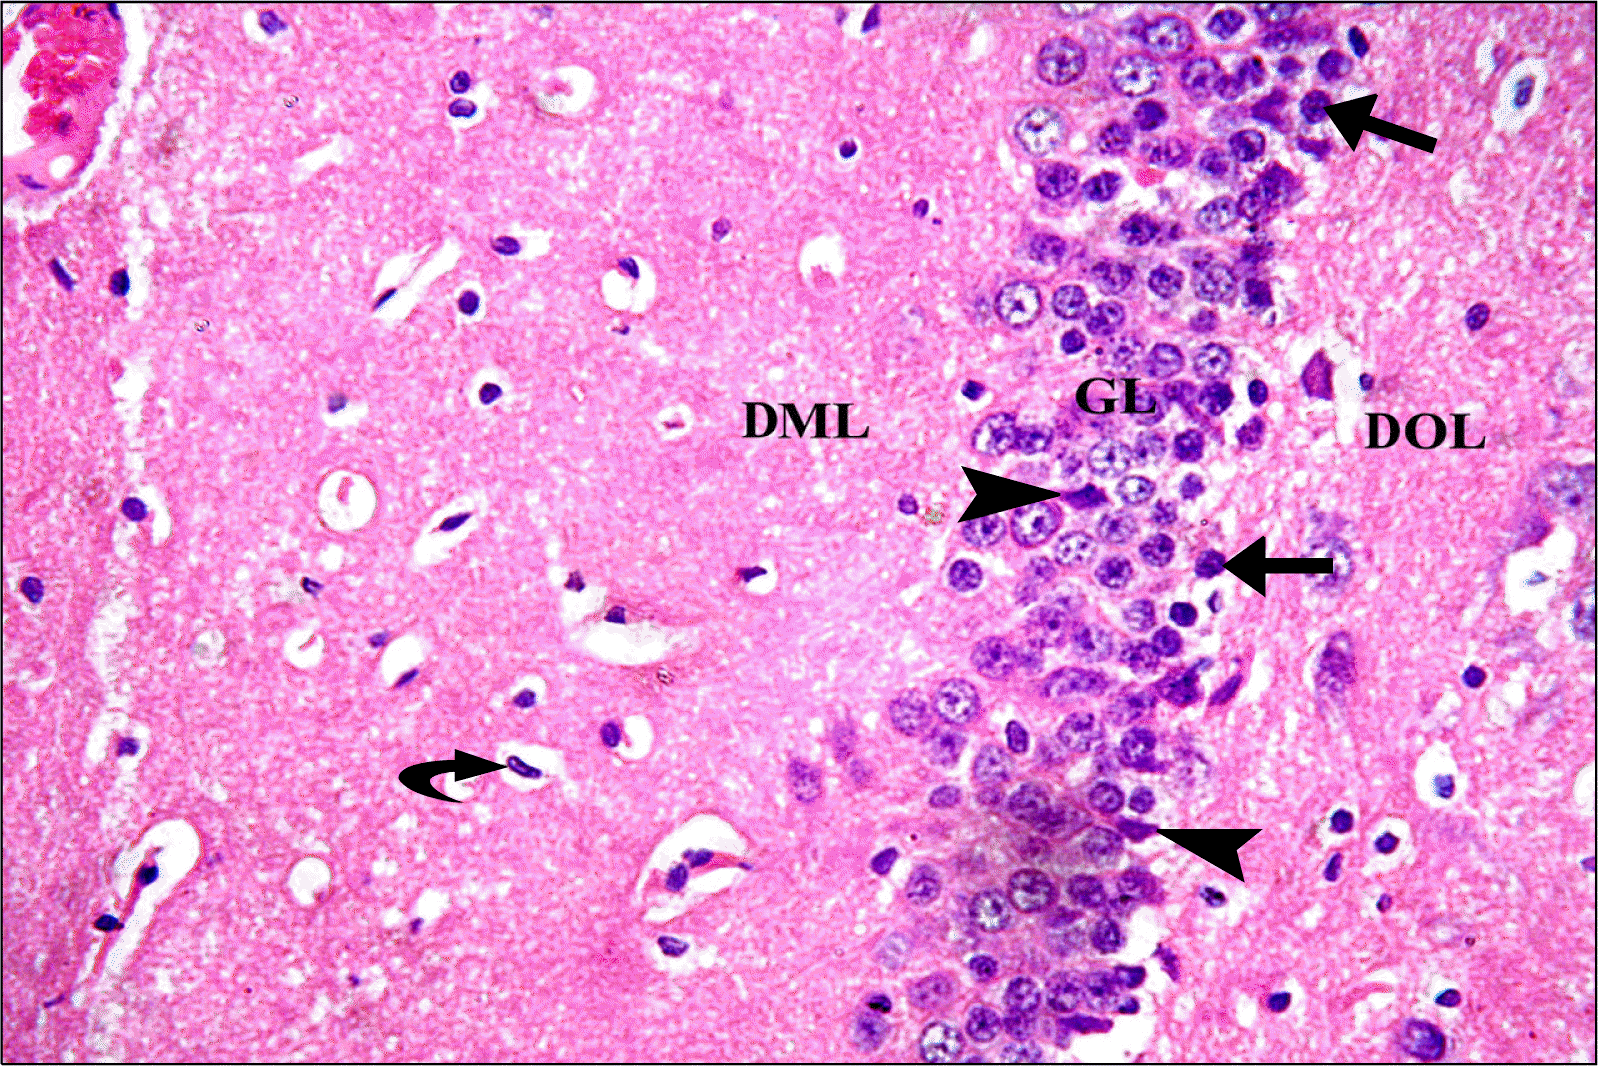
Sections of GL of depressed group showed eosinophilic (degenerating) neurons with darkly stained (pyknotic) nuclei. Swollen cells and many vacuolations were demonstrated. Some dark irregular shrunken neurons were detected. There was apparent decreased cellularity in GL (3∼4 rows) as compared to control group (Fig. 2). Rr group revealed a picture nearly similar to that of control group with apparently more granule cells and less dark neurons as compared to GII (Fig. 3).
Anti-caspase 3 stained hippocampal sections: Hippocampal sections of control & Rr groups revealed -ve immunoreactivity in all layers of DG. Depressed group revealed brown cytoplasmic immunostaining in the majority of DG granule cells mainly in SGZ (Fig. 4).
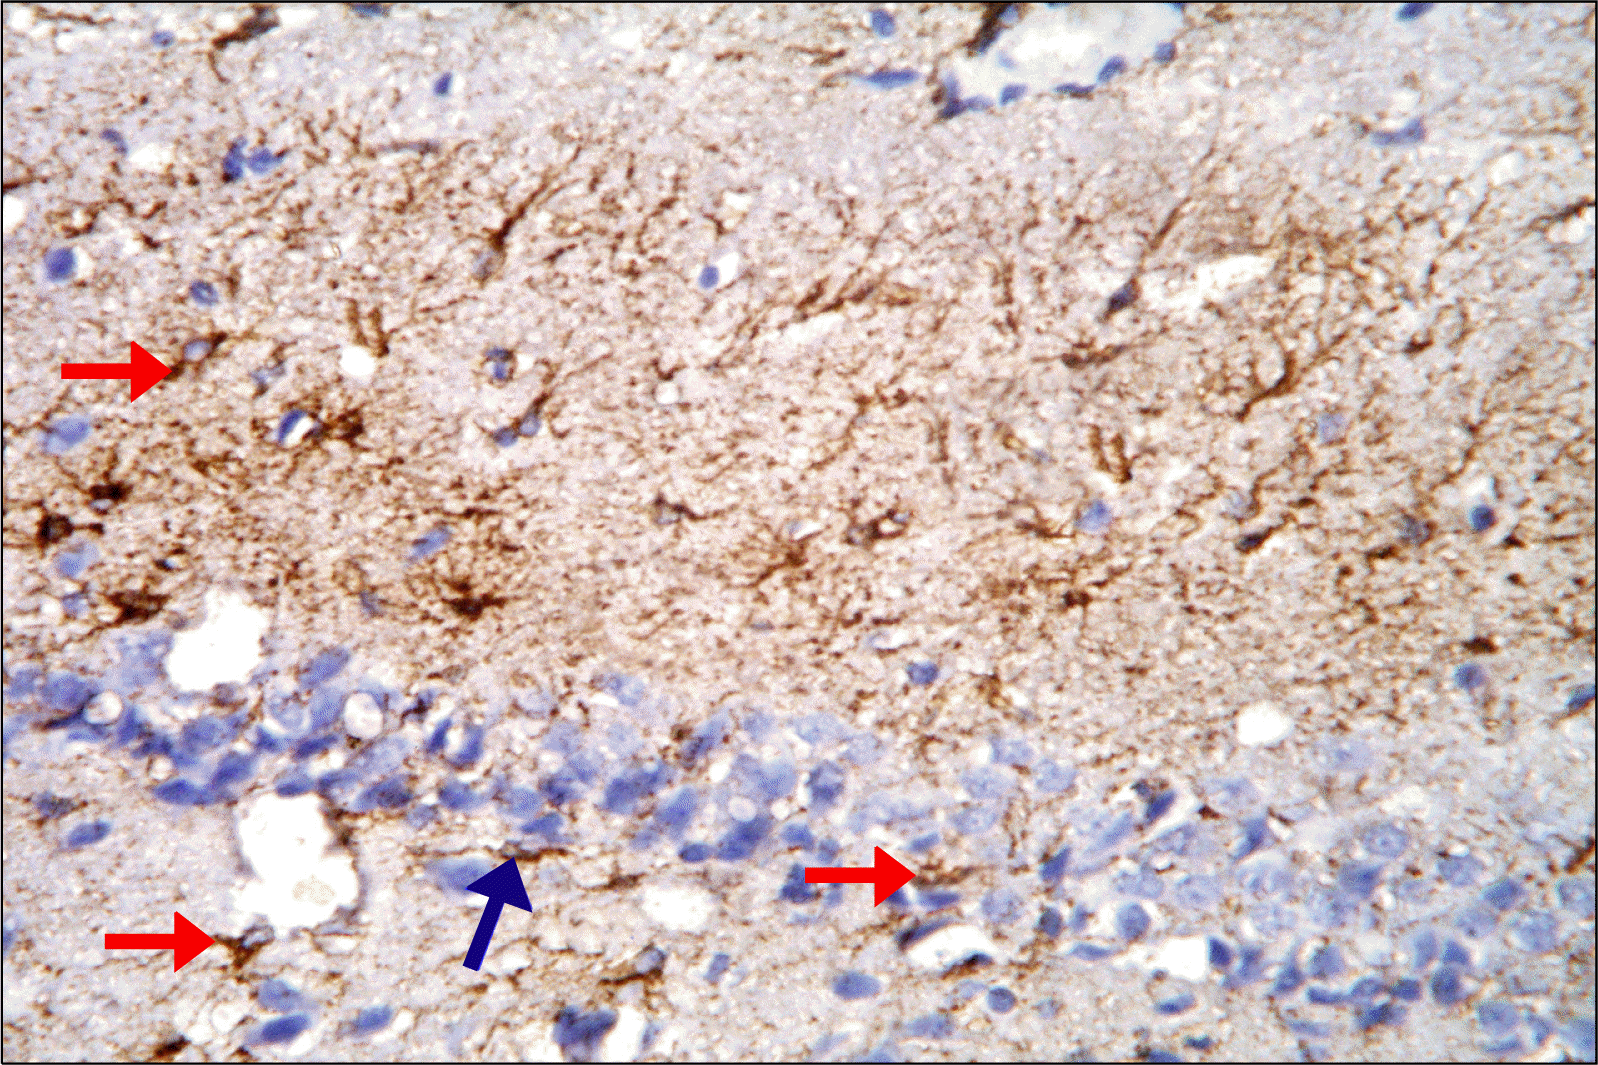
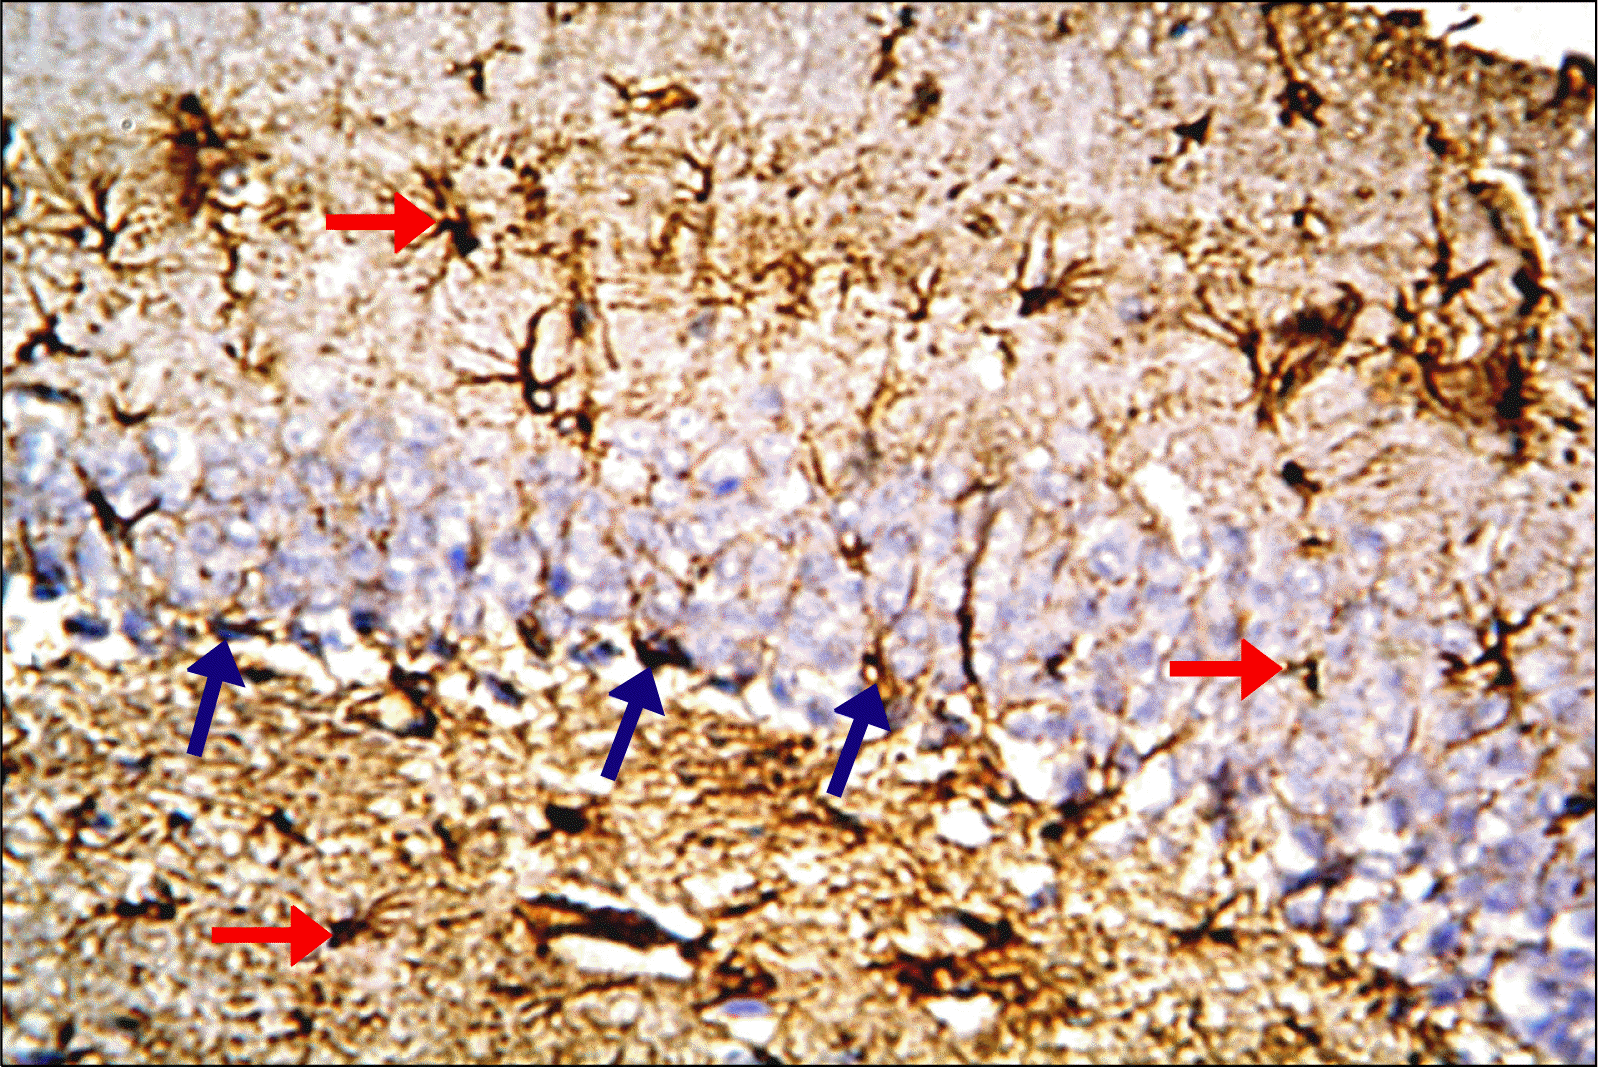
Anti-GFAP stained hippocampal sections: Hippocampal sections of control group revealed brown immunostaining in the cytoplasm and processes of astrocytes in all regions of DG mainly in the (ML, OL). The immunoreactive cells of GL were detected mainly in SGZ (Fig. 5). Depressed group revealed apparently increased immunoreactivity as compared to control; the immunoreactive astrocytes of GL were detected mainly in SGZ closely related to dark cells (Fig. 6). Rr group revealed strong immunoreactive cells of GL that were detected mainly in SGZ. There was an obvious increase in the immunoreactivity as compared to control & depressed groups (Fig. 7).
Anti-PCNA stained hippocampal sections: Hippocampal sections of Control and depressed groups revealed negative immunoreactivity in all layers of DG. Rr group revealed brown nuclear immunoreactivity that was detected in GL of DG mainly in SGZ. Few immunoreactive nuclei were detected in DOL and DML (Fig. 8).

Morphometric results

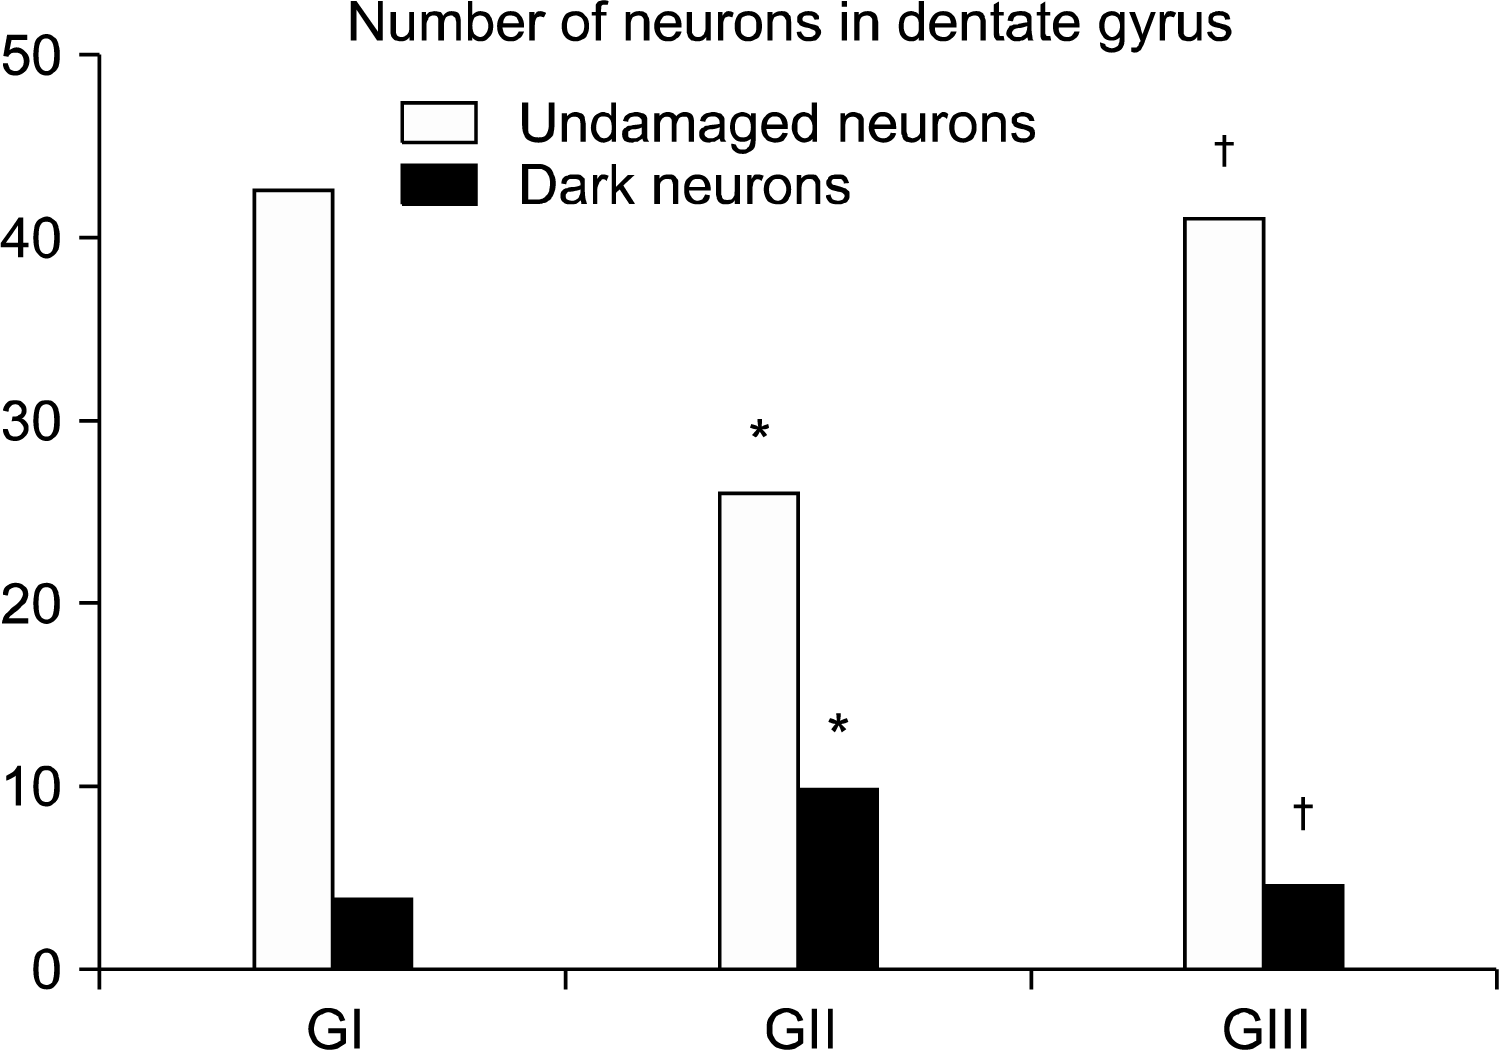
I-Mean number of neurons (undamaged and dark neurons) in DG (Fig. 9): Rr group showed a significant increase in the number of undamaged neurons and a significant decrease in the number of dark neurons when compared to GII.
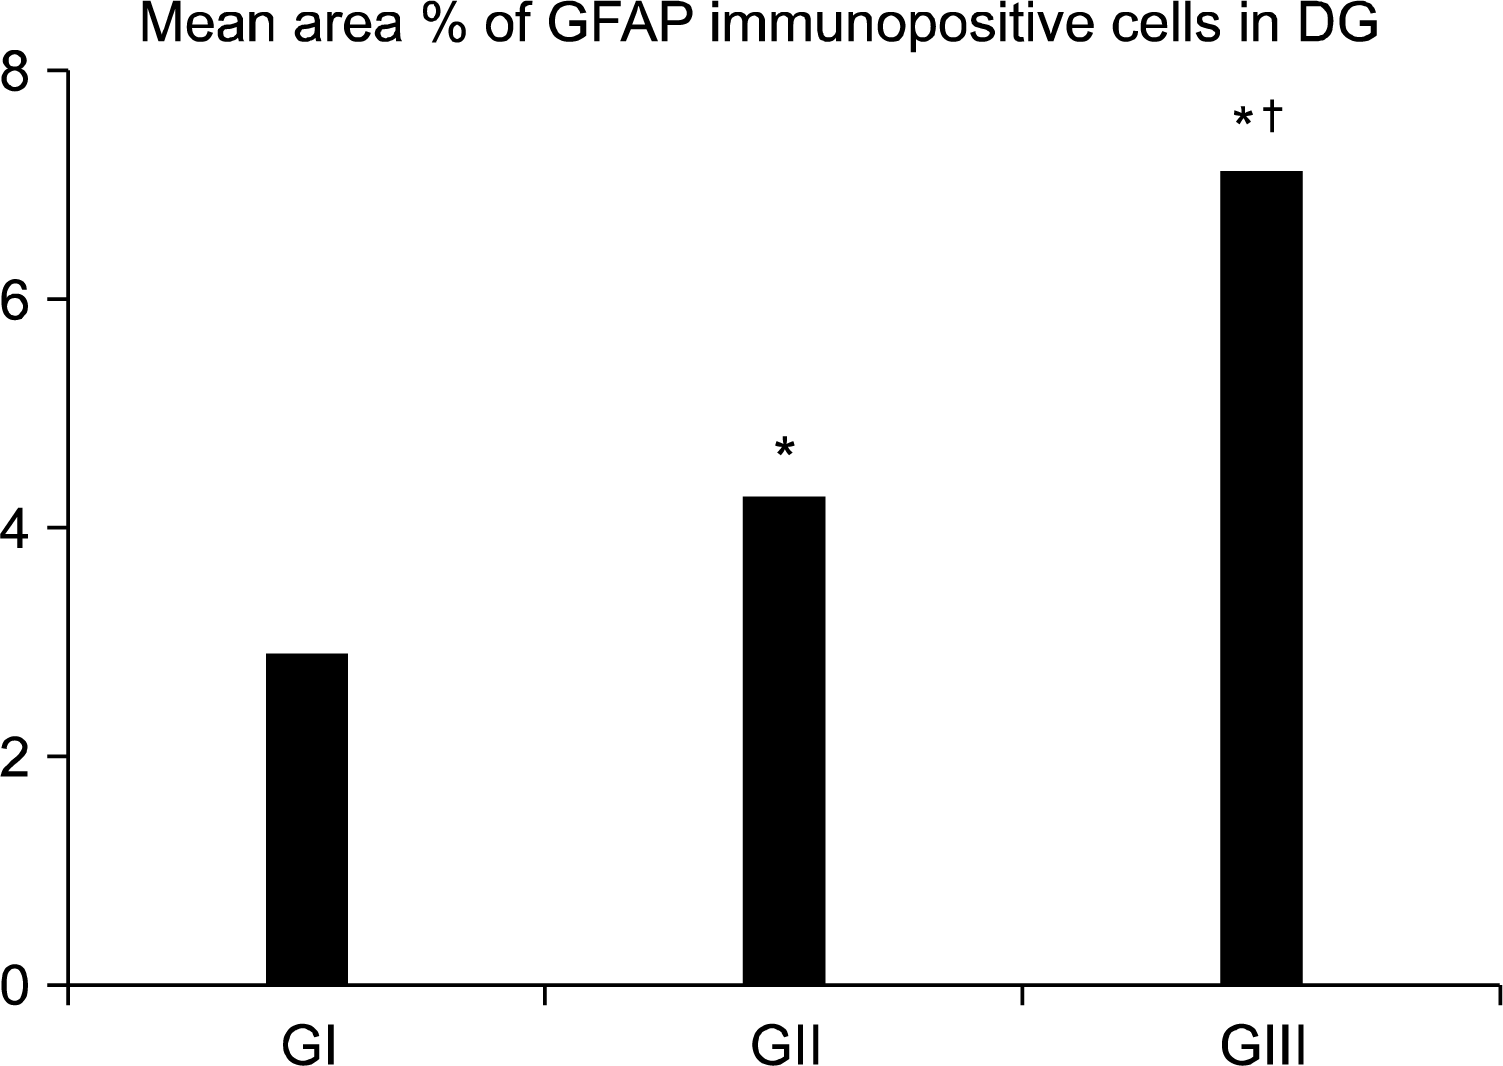
II-Mean area percent of GFAP immunopositive cells in DG (Fig. 10): There was a significant increase in GII & GIII when compared to GI. GIII revealed a significant increase as compared to GII.

Discussion

Chronic mild stress model is the most widely applied model of depression. The CMS model of depression involved the presentation of a series of varied and unpredictable environmental stressors. Following such exposure, animals exhibit a persistent reduction in responsiveness to pleasurable stimuli, measured by a decrease in their consumption of 1% sucrose solution. Decrease in sucrose consumption has been advocated as a reliable behavioral measure that is associated with anhedonia (loss of appetite) of depression (1, 6).
In the present study, SP percent decreased in depressed group confirming occurrence of anhedonia which is a basic sign of depression and so CMS successfully induced depression in the rats.
Chen et al. (1) induced depression by CMS protocol in normal adult rats and confirmed it through several behavioral and physiological changes including decreased sucrose preference percent.
Improvement of SP in Rhodiola group was in accordance with Chen et al. (1) who found that introduction of Rhodiola rosea extract for 3 weeks in depressed rats increased sucrose preference to the normal level.
Going parallel with the present findings is the morphometric examination which showed that 4 weeks CMS procedure caused significant decrease in animals’ body weight. Consistent with these findings, a previous study represented an obvious decrease in the body weight of CMS stressed animals (10). The increase in Bw after Rr supplementation for 3 weeks was in accordance to Chen et al. (1) who found that depression in rats decreased the rate of Bw increase and Rr supplementation for 3 weeks reversed it to reach the normal level.
Hippocampal sections of depressed rats revealed degenerating neurons, dark neurons & many vacuolations. The appearance of neuron degeneration in the present study was similar to “eosinophilic neuron degeneration” described by Garman (11) who mentioned that, the degenerating neurons (sometimes referred to as “red dead neurons” were characterized at the light microscopic level by cell body shrinkage, loss of Nissl substance, intensely stained eosinophilic cytoplasm, and a small/shrunken darkly stained (pyknotic) nucleus that may eventually fragment (undergo karyorrhexis).
Dark neurons might reflect an early cell injury following stress and overexcitation. Early neuronal injury may be due to early damage of cytoskeleton such as micro-tubules or microfilaments. Dark neurons appeared to be in a shrunken or contracted state which may be the result of contraction of cytoskeletal proteins such as actin (12).
In the present study vacuolations could be detected near degenerating neurons which might be attributed to swelling or degeneration of neuronal process. Garman (11) demonstrated that vacuolations adjacent to the degenerating neurons or those overlying molecular layer are probably swelling/degeneration of neuronal processes, swelling of astrocyte cytoplasmic processes, myelin sheath splitting or intramyelinic edema.
Using morphometric measurment for GII, there was a significant decrease in the number of undamaged neurons and a significant increase in the number of dark neurons in GL as compared to control group. Nowak et al. (13) detected a significant decrease in the total number of granule cells and in the volume of the GL in the CMS group.
Hippocampal sections of rats which exposed to CMS followed by Rr (GIII) showed signs of recovery in the form of improved neuronal cellularity with the presence of proliferating cells at the basal layer of GL, and consequently no eosinophilic cells, as compared to GII.
Darbinyan et al. (14) demonestrated that Rr extract alleviates pathological changes in affected hippocampal neurons and promotes survival of the injured hippocampal neurons.
Combining the findings in the present study (GIII) with the previous data reported by others, signals the role of Rr in the improvement of depressed hippocampus through increasing healthy neurons. This may be due to recovery of injured dark neurons or by proliferation of NSCs in DG containing NSCs niche.
Presence of apoptotic cells in GII was confirmed by using anti-CASP 3 immunostaining. The immunoreactivity was detected in the majority of granule cells of DG mainly in SGZ. On the contrary, GI had negative immunoreactivity detected in all layers of DG. This was in accordance with Sima and Li (15) who did not found apoptotic cells in all layers of hippocampus of the control rats using TUNEL immunostaining.
Bachis et al. (16) demonstrated that CMS induced neuronal death through apoptosis as it increased the number of caspase-3 positive neurons in the cerebral cortex. They suggested that increased glucocorticoids secondary to the hyperactivity of the hypothalamic-pituitary-adrenal (HPA) axis in CMS might be responsible for the apoptosis seen in some cortical neurons.
Moreover, Sze et al. (17) found that dexamethasone increased the number of caspase-3 positive cells in DG. It stimulated glucocorticoid receptors which are present in a high density on hippocampal neurons leading to apoptosis. They proved that, the apoptotic cells in DG were mainly neuroprogenitor cells. In the present study, the existence of anti-CASP 3 immunoreactivity mainly in SGZ of DG (NSCs niche) indicates that depression is associated with apoptosis of these cells.
On the contrary to the present study, Nowak et al. (13) could not find differences in the number of Caspase 3 immunopositive cells between the control and CMS rat groups. They explained that their results may be due to exposure to less stressors that failed to decrease the number of hippocampal neurons.
Hippocampal sections of Rr group (GIII) stained with anti-CASP 3 antibody revealed no immunoreactivity in all layers of DG. This was in accordance with Palumbo et al. (18) who showed the neuroprotective effect of Rr in cortical neurons. It significantly increased cell survival, decreased apoptosis and significantly prevented the plasma membrane damage and the morphological disruption caused by oxidative stress.
Sections of depressed rats (GII) stained with anti-GFAP antibody revealed increased immunostaining that were detected in all layers of DG. The astrocytes were extending between granule cells mainly in SGZ of GL. They were closely related to dark cells. Using morphometric measurements, the mean area percent of GFAP immunopositive cells of DG were significantly increased as compared to the controls (GI).
Injured astrocytes become hypertrophic, change their morphology and start to proliferate. They also increase the expression of GFAP, vimentin and nestin. These cells are called reactive astrocytes (19). Contrary to the present results, Li et al. (20) suggested that astrocyte atrophy contributes to the pathogenesis of depression as GFAP mRNA and protein levels in depressed rats were significantly decreased than control rats.
In the present study, presence of astrocytes closely related to dark cells and mainly in SGZ of GL may be for support or phagocytosis of dark neurons. Local astrocytes can offer structural support, secrete regulatory factors and regulate synapse formation and synaptic transmission. Astrocytes are component of SGZ neural stem cell niche and control neurogenesis by stimulation of proliferation and differentiation of NSCs (21). Astrocytes and microglia express certain membrane receptors. These receptors recognize molecules released by altered and degenerating neurons leading to the phagocytosis of these cells and neuronal debris (22).
Sections of Rr treated rats (GIII) revealed prominent immunoreactivity for GFAB as compared to GI & GII. This increase was confirmed by morphometric measurment of GFAP immunopositive cells area percent. This may be for more neuronal protection, support and stimulation of NSCs proliferation & differentiation by astrocytes (21).
In the present study, anti-PCNA antibody was used to detect proliferating cells. Nowak et al. (13) mentioned that proliferating cells in SGZ of the DG represent heterogeneous populations of cells, including progenitor of granule cells, radial and horizontal astrocytes in addition to endothelial cells.
Depressed rats (GII) hippocampal sections stained with anti-PCNA antibody revealed negative immunoreactivity in all layers of DG. This was in accordance to Chen et al. (1) who reported that depression was associated with suppressed proliferation in the rat DG after chronic stress.
Moreover, proliferating cells were not present in control rats. This does not exclude presence of NSCs as they may be in quiescent state and need a marker for quiescent NSCs detection. This also does not exclude presence of glial cells as they do not proliferate in the healthy brain or self-renew when cultured in vitro (19).
In Rr treated rats, nuclear immunoreactivity for PCNA was detected in many granule cells of DG mainly in SGZ. Few immunoreactive nuclei were detected in other layers of DG.
The current results were in accordance to Chen et al. (1) who detected an increase in hippocampus proliferating cells after 3 weeks of Rr extract introduction in rats depressed by CMS. The proliferating cells were present in SGZ (NSCs niche). They concluded that Rr extract could improve 5-HT level, induce neural stem cell proliferation and repair the injured hippocampal neurons of depressed rats.
Salidroside content of Rr is a potent antioxidant. It promotes neurogenesis in the hippocampus. It reduces ROS levels and NSCs death and increases NSCs proliferation and differentiation (23).
In conclusion, Rr extract has a role in affecting the cerebral hippocampal neurons and improving depression in rats. Further studies are required to evaluate the safety/toxicity of Rr and to evaluate their role in preventing human depression.

Notes

Potential conflict of interest

The authors have no conflicting financial interest.

References

1. Chen QG, Zeng YS, Qu ZQ, Tang JY, Qin YJ, Chung P, Wong R, Hägg U. The effects of Rhodiola rosea extract on 5-HT level, cell proliferation and quantity of neurons at cerebral hippocampus of depressive rats. Phytomedicine. 2009. 16:830–838.
crossref
2. Okano H, Sakaguchi M, Ohki K, Suzuki N, Sawamoto K. Regeneration of the central nervous system using endogenous repair mechanisms. J Neurochem. 2007. 102:1459–1465.
crossref
3. Taupin P. A dual activity of ROS and oxidative stress on adult neurogenesis and Alzheimer’s disease. Cent Nerv Syst Agents Med Chem. 2010. 10:16–21.
crossref
4. Brown RP, Gerbarg PL, Ramazanov Z. Rhodiola rosea: a phytomedicinal overview. Herbal Gram. 2002. 56:40–52.
5. Dang H, Chen Y, Liu X, Wang Q, Wang L, Jia W, Wang Y. Antidepressant effects of ginseng total saponins in the forced swimming test and chronic mild stress models of depression. Prog Neuropsychopharmacol Biol Psychiatry. 2009. 33:1417–1424.
crossref
6. Liu M, Hu J, Ma T, Wang S, Ding H. Application of a disposable screen-printed electrode to depression diagnosis for laboratory rats based on blood serotonin detection. Anal Sci. 2011. 27:839–843.
crossref
7. Venkataraman P, Selvakumar K, Krishnamoorthy G, Muthusami S, Rameshkumar R, Prakash S, Arunakaran J. Effect of melatonin on PCB (Aroclor 1254) induced neuronal damage and changes in Cu/Zn superoxide dismutase and glutathione peroxidase-4 mRNA expression in cerebral cortex, cerebellum and hippocampus of adult rats. Neurosci Res. 2010. 66:189–197.
crossref
8. Bancroft JD, Gamble MN. Theory and practice of histological techniques. 6th ed. London, Edinburgh, New York, Philadelphia, St Louis, Sydney and Toronto: Churchill-Livingstone;2007. 179.
9. Emsley R, Dunn G, White IR. Mediation and moderation of treatment effects in randomised controlled trials of complex interventions. Stat Methods Med Res. 2010. 19:237–270.
crossref
10. Li S, Wang C, Wang M, Li W, Matsumoto K, Tang Y. Antidepressant like effects of piperine in chronic mild stress treated mice and its possible mechanisms. Life Sci. 2007. 80:1373–1381.
crossref
11. Garman RH. Histology of the central nervous system. Toxicol Pathol. 2011. 39:22–35.
crossref
12. Kherani ZS, Auer RN. Pharmacologic analysis of the mechanism of dark neuron production in cerebral cortex. Acta Neuropathol. 2008. 116:447–452.
crossref
13. Nowak B, Zadrożna M, Ossowska G, Sowa-Kućma M, Gruca P, Papp M, Dybała M, Pilc A, Nowak G. Alterations in hippocampal calcium-binding neurons induced by stress models of depression: a preliminary assessment. Pharmacol Rep. 2010. 62:1204–1210.
crossref
14. Darbinyan V, Aslanyan G, Amroyan E, Gabrielyan E, Malmström C, Panossian A. Clinical trial of Rhodiola rosea L. extract SHR-5 in the treatment of mild to moderate depression. Nord J Psychiatry. 2007. 61:343–348.
crossref
15. Sima AA, Li ZG. The effect of C-peptide on cognitive dysfunction and hippocampal apoptosis in type 1 diabetic rats. Diabetes. 2005. 54:1497–1505.
crossref
16. Bachis A, Cruz MI, Nosheny RL, Mocchetti I. Chronic unpredictable stress promotes neuronal apoptosis in the cerebral cortex. Neurosci Lett. 2008. 442:104–108.
crossref
17. Sze CI, Lin YC, Lin YJ, Hsieh TH, Kuo YM, Lin CH. The role of glucocorticoid receptors in dexamethasone-induced apoptosis of neuroprogenitor cells in the hippocampus of rat pups. Mediators Inflamm. 2013. 2013:628094.
crossref
18. Palumbo DR, Occhiuto F, Spadaro F, Circosta C. Rhodiola rosea extract protects human cortical neurons against glutamate and hydrogen peroxide-induced cell death through reduction in the accumulation of intracellular calcium. Phytother Res. 2012. 26:878–883.
crossref
19. Robel S, Berninger B, Götz M. The stem cell potential of glia: lessons from reactive gliosis. Nat Rev Neurosci. 2011. 12:88–104.
crossref
20. Li LF, Yang J, Ma SP, Qu R. Magnolol treatment reversed the glial pathology in an unpredictable chronic mild stress- induced rat model of depression. Eur J Pharmacol. 2013. 711:42–49.
crossref
21. Barkho BZ, Song H, Aimone JB, Smrt RD, Kuwabara T, Nakashima K, Gage FH, Zhao X. Identification of astrocyte-expressed factors that modulate neural stem/progenitor cell differentiation. Stem Cells Dev. 2006. 15:407–421.
crossref
22. Noda M, Doi Y, Liang J, Kawanokuchi J, Sonobe Y, Takeuchi H, Mizuno T, Suzumura A. Fractalkine attenuates excito- neurotoxicity via microglial clearance of damaged neurons and antioxidant enzyme heme oxygenase-1 expression. J Biol Chem. 2011. 286:2308–2319.
crossref
23. Qu ZQ, Zhou Y, Zeng YS, Lin YK, Li Y, Zhong ZQ, Chan WY. Protective effects of a Rhodiola crenulata extract and salidroside on hippocampal neurogenesis against streptozotocin-induced neural injury in the rat. PLoS One. 2012. 7:e29641.
crossref

Fig. 1.
A photomicrograph of a section in DG of the hippocampus of an albino rat from control group (GI). The 3 layers; DOL, GL and DML are observed. The DOL and DML show few neurons and glial cells in between neuronal processes. GL is formed of several layers of closely packed neurons with rounded vesicular nuclei, prominent nucleoli and scanty basophilic cytoplasm. Few dark nuclei appear in the deep layer of granular cells (arrows) (H&E, ×400).
ijsc_07_70f1.tif
Fig. 2.
A photomicrograph of a section in DG of the hippocampus of an albino rat from GII showing its three layers DOL, GL and DML. Eosinophilic (degenerating) neurons with darkly stained (pyknotic) nuclei are detected (black arrows). Dark irregular shrunken neurons (arrowheads), a swollen cell (thick arrow), blood vessels (*) and vacuolations (V) (probably swelling/degeneration of GL neuron processes) are demonstrated (H&E, ×400).
ijsc_07_70f2.tif
Fig. 3.
A photomicrograph of a section in DG of the hippocampus of an albino rat from group (GIII). DOL, GL and DML are observed. GL has several layers of closely packed rounded vesicular nuclei with prominent nucleoli and scanty basophilic cytoplasm. Few dark nuclei appear in the deep GL (arrows). Few dark irregular shrunken cells are detected (arrowheads). Note typical rod shaped microglia nucleus (curved arrow) (H&E, ×400).
ijsc_07_70f3.tif
Fig. 4.
Photomicrographs of a section in the hippocampal DG of an albino rat showing -ve immunoreactivity in all layers of DG in GI (A) and GIII (B). Brown cytoplasmic immunostaining is detected in most cells of GL, mainly in SGZ (arrow) in GII (C) (Anti-CASP 3 Immunostaining ×400).
ijsc_07_70f4.tif
Fig. 5.
A photomicrograph of a section in DG of the hippocampus of an albino rat (GI) showing brown immunostaining in astrocyte’s cytoplasm and processes in the three layers of DG mainly in the DML and DOL (red arrows). The immunoreactive cells of GL are detected mainly in SGZ s(blue arrows) (Anti-GFAP Immunostaining ×400).
ijsc_07_70f5.tif
Fig. 6.
A photomicrograph of a section in DG of the hippocampus of an albino rat (GII) showing brown immunostaining in many astrocytes in the three layers of DG (red arrows). The immunoreactive cells of GL are detected mainly in SGZ closely related to dark cells (blue arrows) (Anti-GFAP Immunostaining ×400).
ijsc_07_70f6.tif
Fig. 7.
A photomicrograph of a section in DG of the hippocampus of an albino rat (GIII) showing increased immunoreactivity. Brown immunostaining is detected in the cytoplasm and processes of many astrocytes in all layers of DG (red arrows). The immunoreactive cells of GL are detected mainly in SGZ (blue arrows) (Anti-GFAP Immunostaining ×400).
ijsc_07_70f7.tif
Fig. 8.
Photomicrographs of a section in the hippocampal DG of an albino rat showing -ve immunoreactivity in all layers of DG in GI (A) and GII (B). Many granule cells in GIII (C) show nuclear immunoreactivity. The immunoreactivity occupies mainly SGZ cells (blue arrows). Few immunoreactive nuclei are detected in DML and DOL (red arrows) (Anti-PCNA Immunostaining ×400).
ijsc_07_70f8.tif
Fig. 9.
Histogram comparing the mean number of nerve cells in the control and experimental groups. *p<0.05 compared to GI. P<0.05 compared to GII.
ijsc_07_70f9.tif
Fig. 10.
Histogram comparing the mean area percent of GFAP immunopositive cells in the control and experimental groups. *p<0.05 compared to GI. p<0.05 compared to GII.
ijsc_07_70f10.tif
Table 1.
The mean values (±SD) of Bw of control and experimental groups
Group Values of Bw {Mean±SD (gm)}

End of 2nd week End of 6th week End of 9th week
Control (GI) 190.4±5.5 240.5±6.3 280±6.7
Depressed (GII) 189.6±6.5 218.6±6.1* 240.4±7.2*
Rhodiola (GIII) 190.2±7.2 219.3±6.8* 283.6±8.2

* p<0.05 as compared to GI,

p<0.05 as compared to GII.

Table 2.
The mean values (±SD) of SP percent of control and experimental groups
Group Values of SP {Mean±SD (%)}

End of 2nd week End of 6th week End of 9th week
Control (GI) 86.2±1.5 85.6±1.4 86.02±1.7
Depressed (GII) 85.9±1.2 75.4±3.2* 76.01±1.6*
Rhodiola (GIII) 85.6±1.1 74.5±3.1* 85.7±1.1

* p<0.05 as compared to GI,

p<0.05 as compared to GII.

TOOLS
Similar articles