

 PDF
PDF Citation
 Print
Print


Introduction
Materials and Methods
Experimental design
Sham group (S Group): Included 6 rats receiving anaesthesia but not undergoing injury of gastrocnemius-soleus muscle. S1 subgroup 3 rats sacrificed 2 weeks later. S2 subgroup 3 rats sacrificed 4 weeks later.
Injury group (I Group): Included 10 rats subjected to soleus muscle injury without any treatment procedures, other than the routine care of the wound. Betadine was applied to the wound site and rinsing with normal saline was performed at the site of injury on daily base. To induce anesthesia, ketamine hydrochloride (Ketalar, (Parke Davis Barcelona, Spain) (35 mg/kg) was injected into the gluteus maximus muscle of the animal. Using aseptic techniques, a 3 cm longitudinal skin incision was made along the leg. Then an incision (1 cm in length) was made perpendicular to the orientation of the muscle. The fascia and skin were sutured (9). Daily aseptic dressing was applied on the wound. The animals were subdivided into 2 subgroups:
Microcurrent group (M Group): Included 10 rats subjected to soleus muscle injury by the same protocol as in I group. Micro-current electric stimulator, model EMSI-4250 (made in Taiwan) was used for the treatment. Intensity was 100 microampere (10) and the frequency 10 Hz. Clip electrodes were used and microcurrent therapy was applied 3 sessions/week (11). The negative lead (1.0×1.0 cm) was placed over the muscle injury site, while the positive lead was placed proximally on the thigh region of the same side. The microcurrent was applied for 20 minutes in each session (12). The animals were subdivided into 2 subgroups:
Hematoxylin and eosin (13)
Immunohistochemical (IHC) Study
Morphometric study
Statistical analysis
Results
Histological results
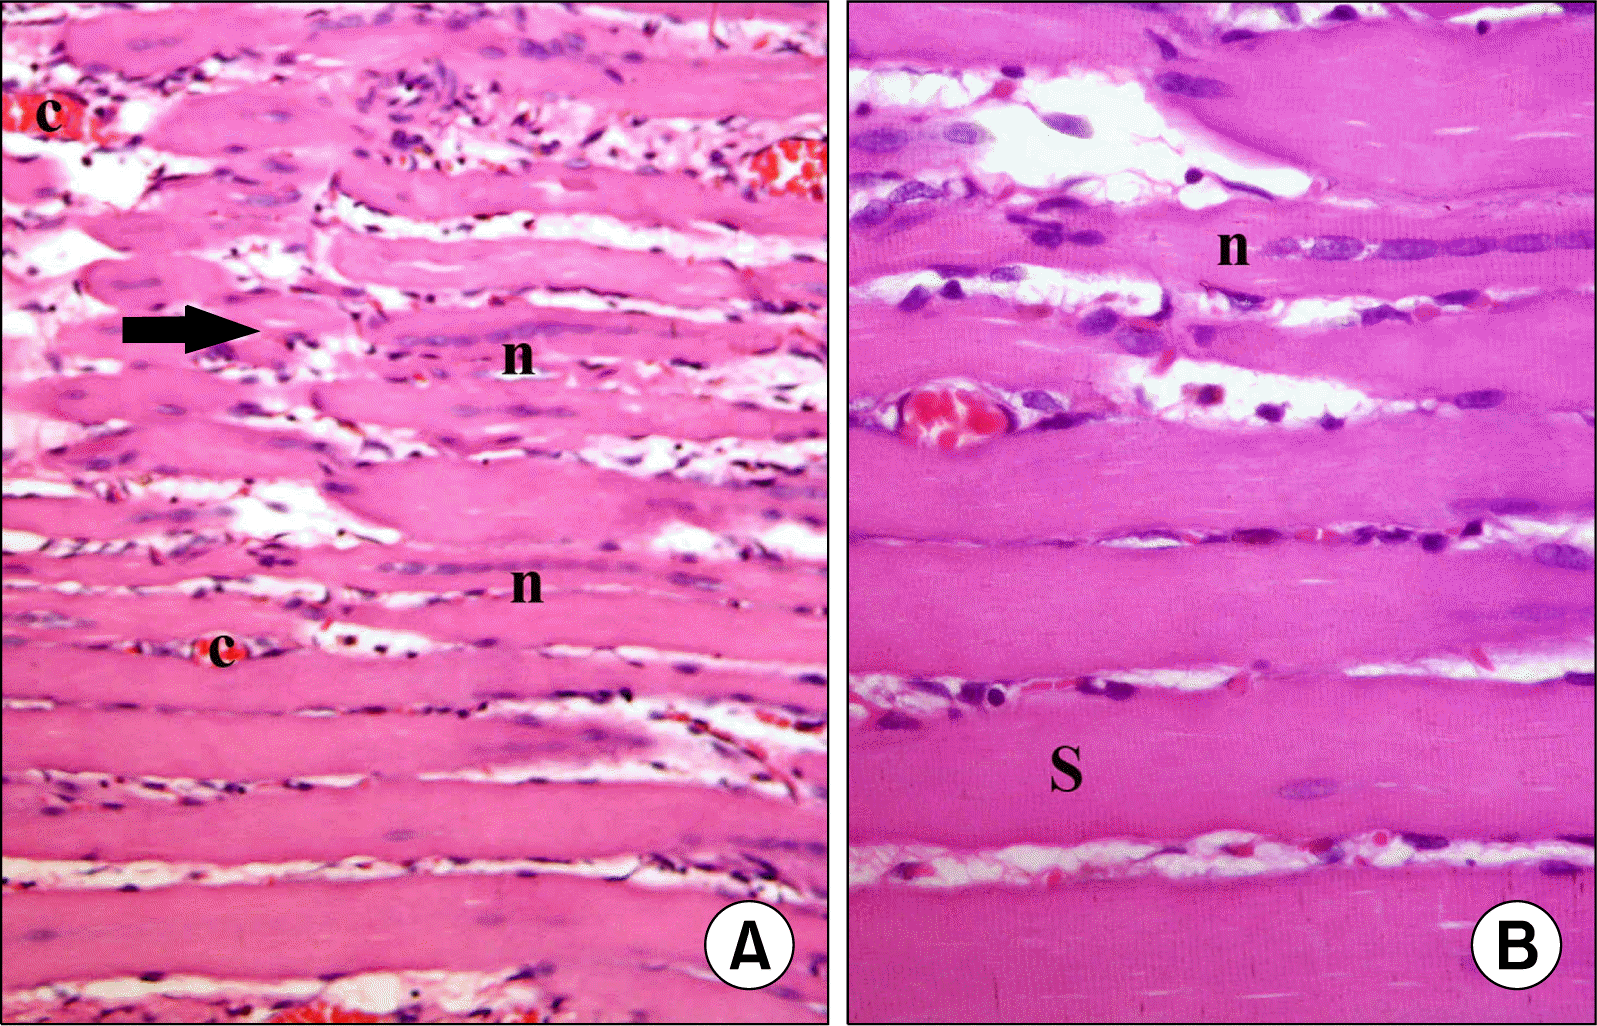
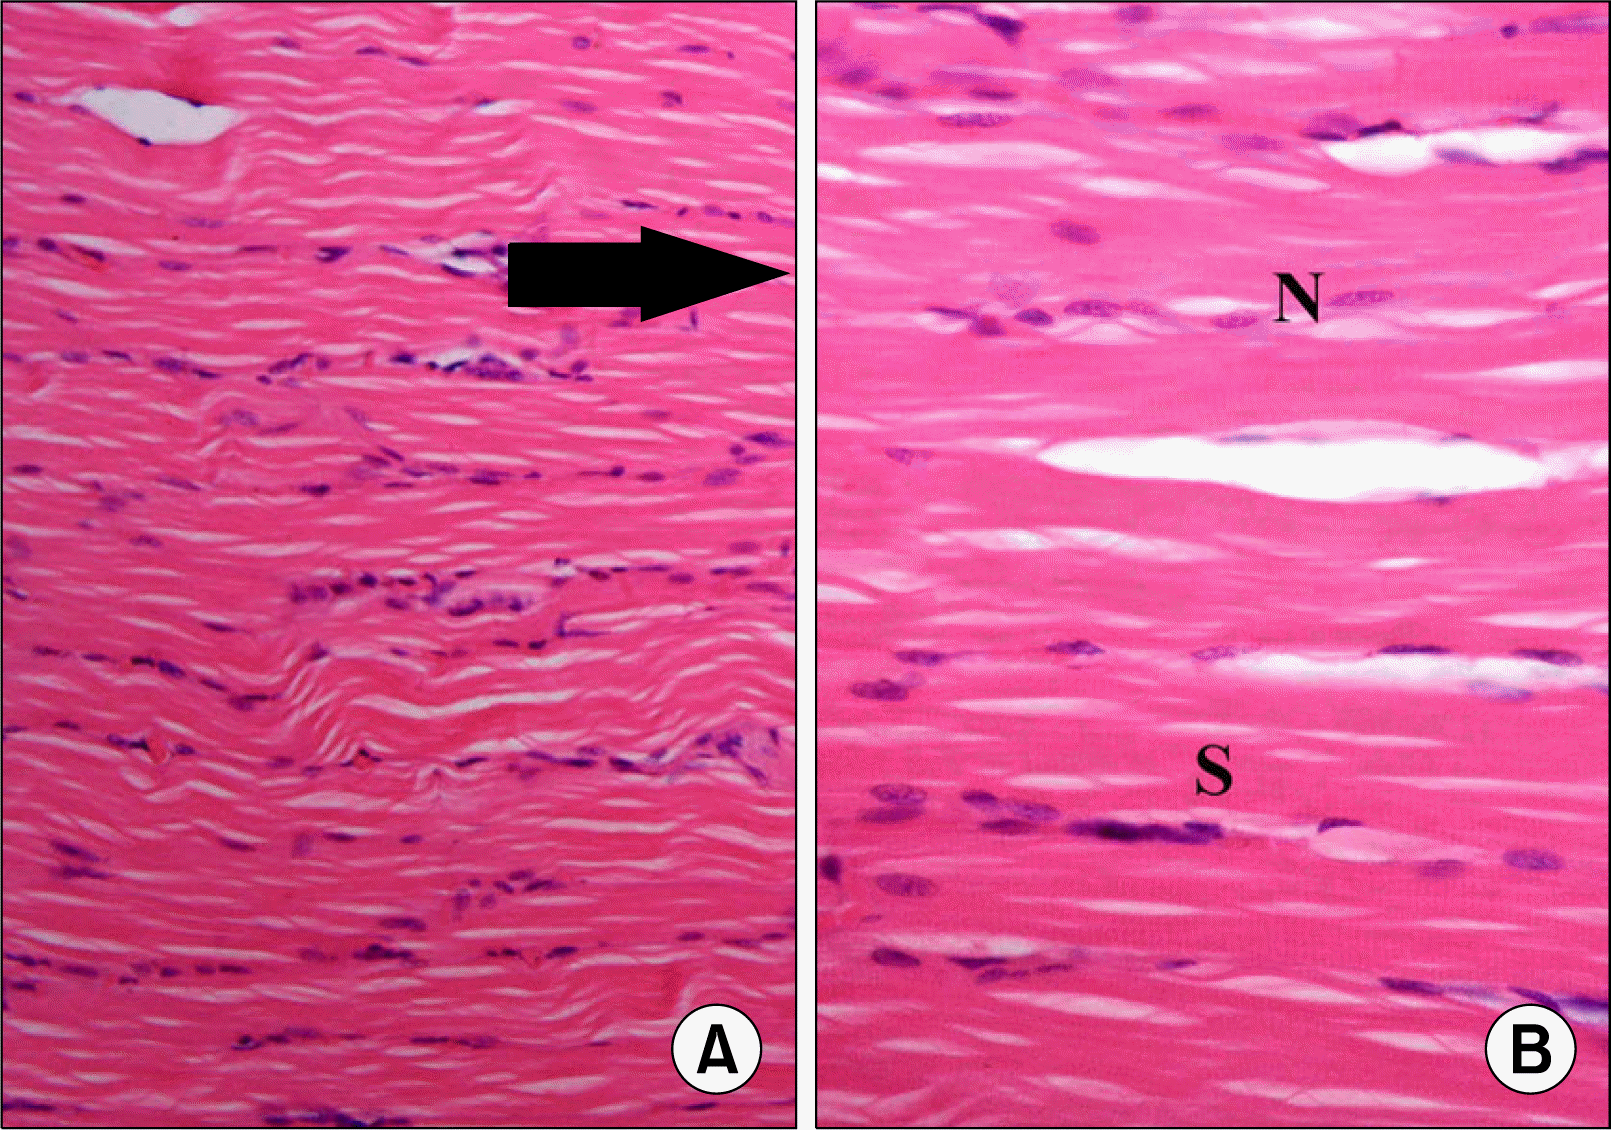 | Fig. 1.(A) Skeletal muscle section of S group showing longitudinal muscle fibers (arrows) (H&E, ×200). (B) Higher magnification of the previous figure showing oval pale nuclei (N) and transverse striations (S) in the sarcoplasm (H&E, ×400).
|
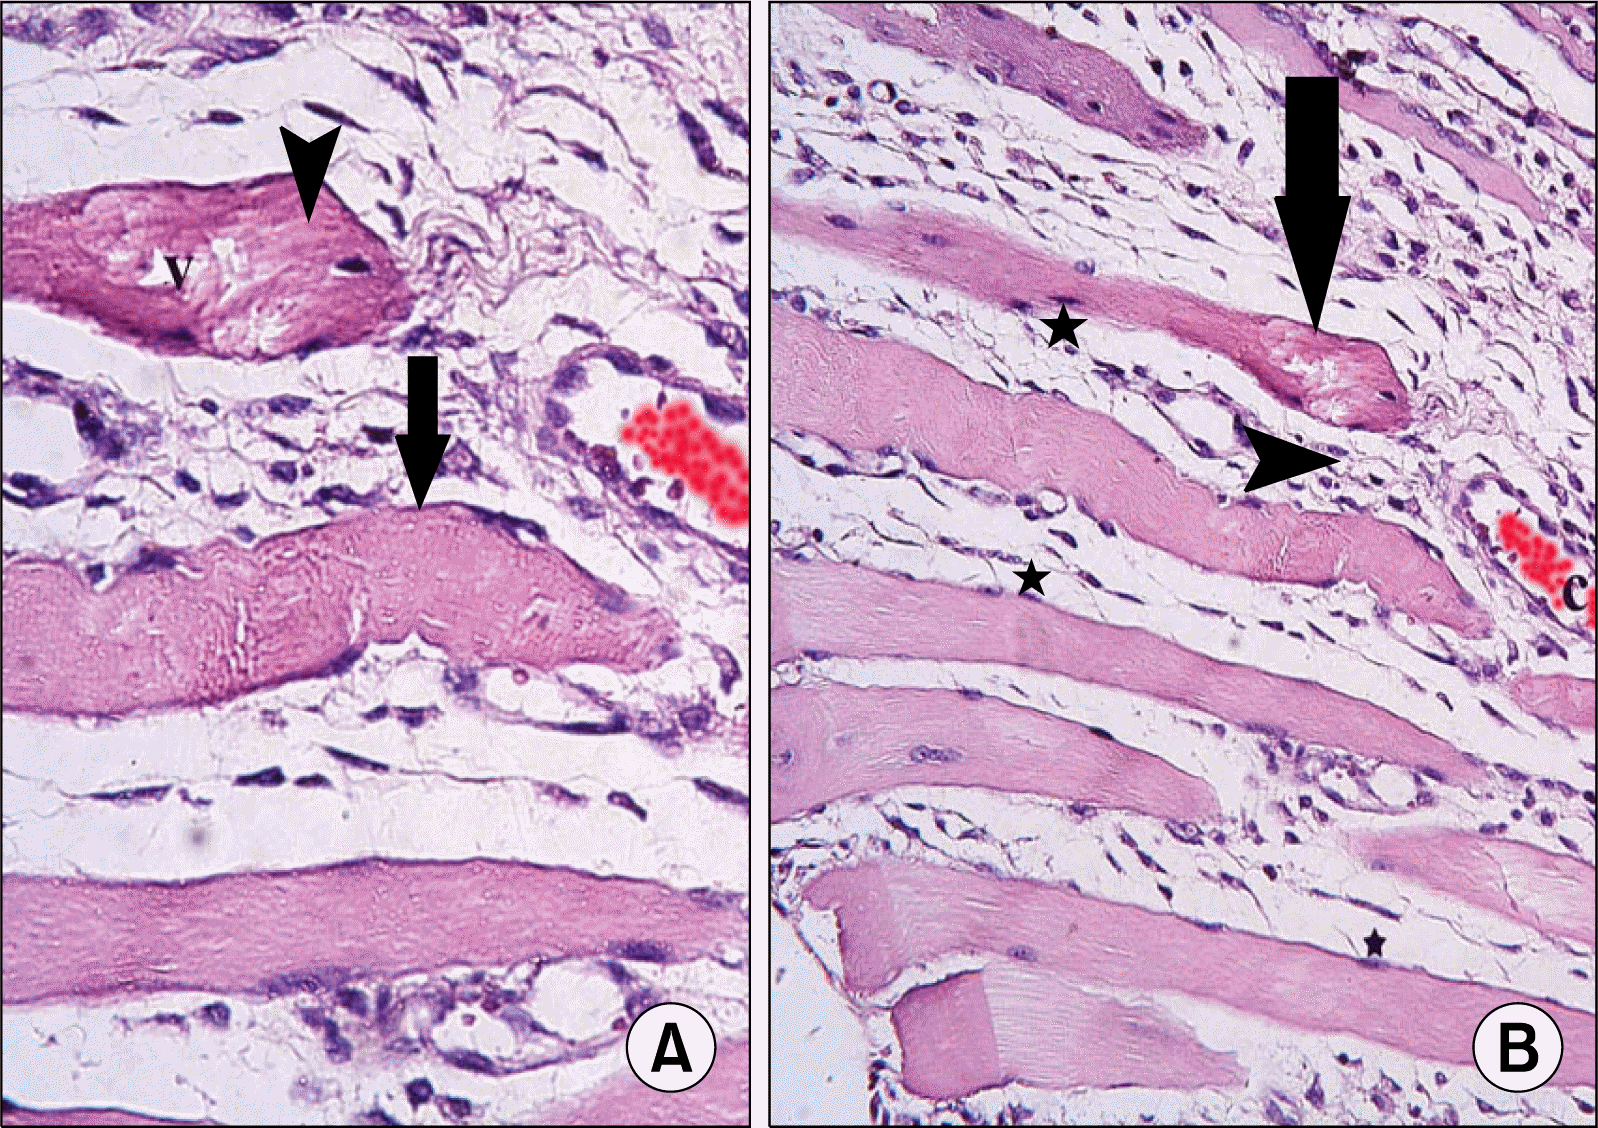 | Fig. 2.(A) Skeletal muscle section of a rat in subgroup I1 showing atypical fibers (arrows) widely separated by infiltrating cells (arrowheads). Most fibers exhibit dark nuclei (*). Note a distended capillary (c) (H&E, ×200). (B) Higher magnification of the previous figure showing two fibers with partial loss of striations (arrows), one fiber exhibits strong acidophilic sarcoplasm (arrowheads) with focal vacuolations (v) (H&E, ×400).
|
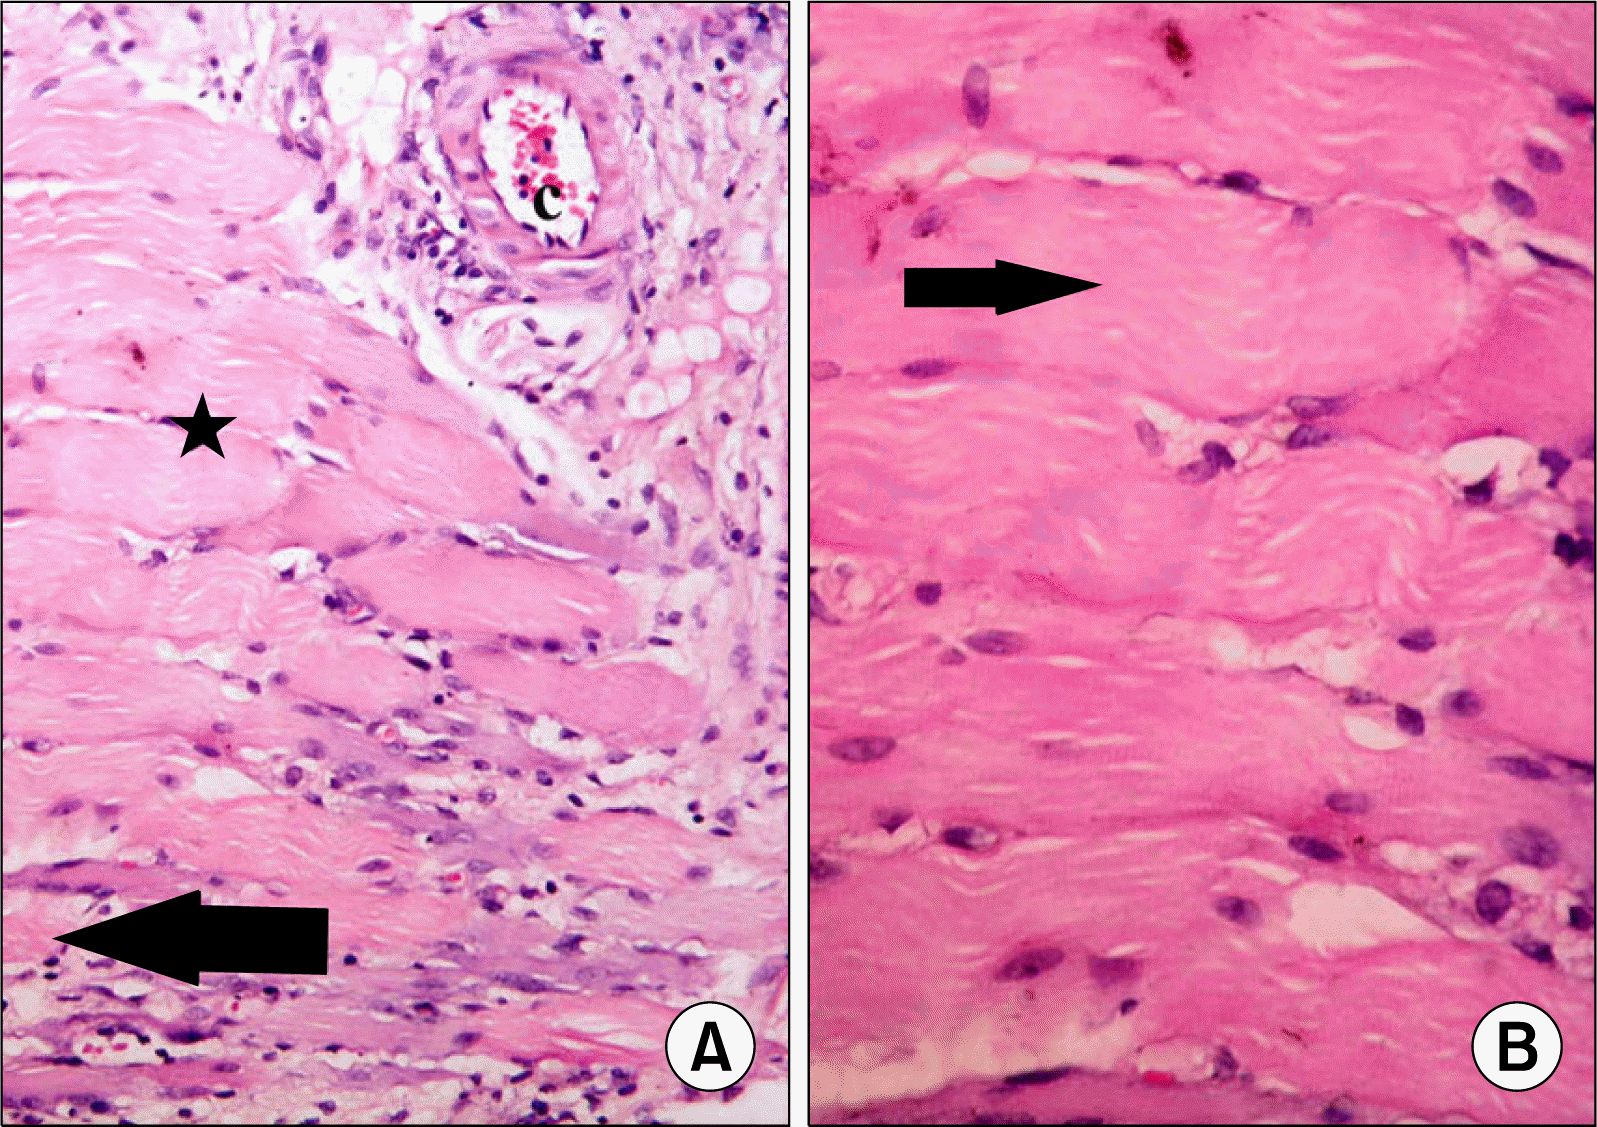 | Fig. 3.(A) Skeletal muscle section of a rat in subgroup I2 showing atypical fibers (arrows) separated by few infiltrating cells (arrowhead). Some fibers exhibit dark nuclei (*) (H&E, ×200). (B) Higher magnification of the previous figure showing some fibers with partial loss of striations (arrows) (H&E, ×400).
|
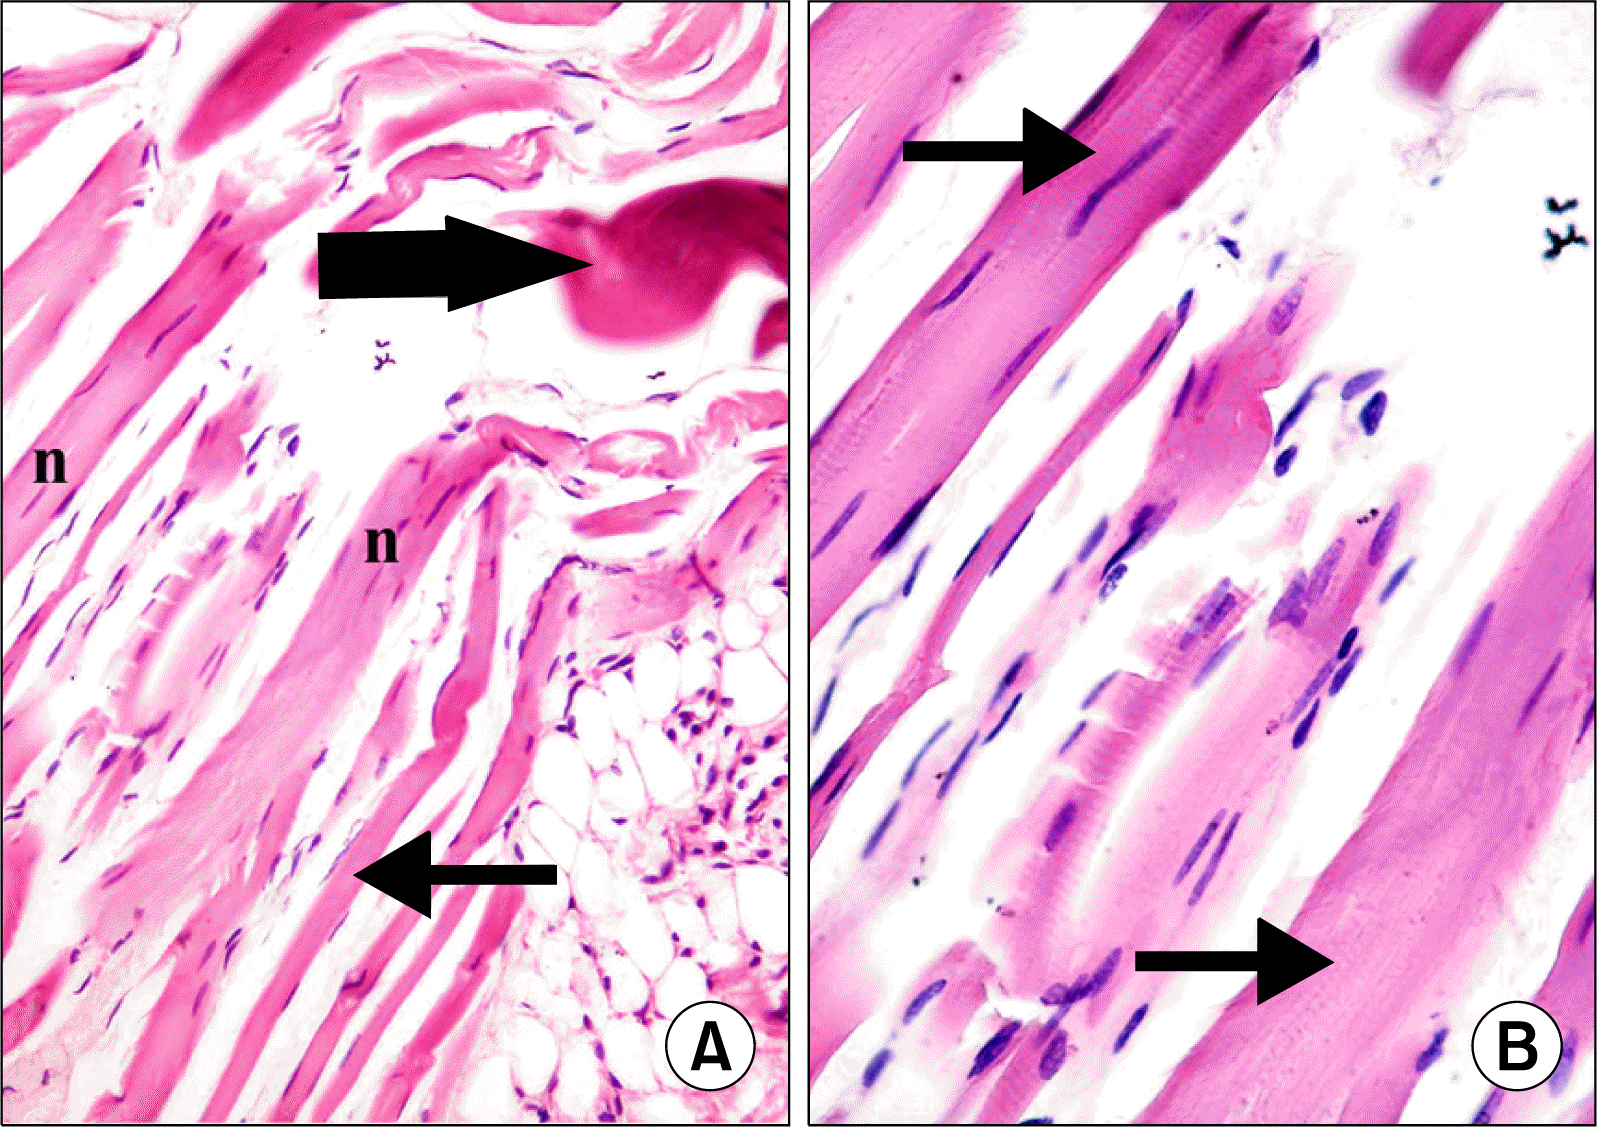 | Fig. 4.(A) Skeletal muscle section of a rat in subgroup M1 showing some fibers exhibiting flat nuclei (thin arrows). Some of the nuclei (n) are centrally located. Note few atypical fibers (thick arrow) (H&E, ×200). (B) Higher magnification of the previous figure showing fibers with striations in some areas of the sarcoplasm (arrows) (H&E, ×400).
|
 | Fig. 5.(A) Skeletal muscle section of a rat in subgroup M2 showing few atypical (arrow) and multiple typical fibers, some of which with centrally located nuclei (n) (H&E, ×200). (B) Higher magnification of the previous figure showing multiple fibers with striations (S) in most areas of the sarcoplasm. Note some fibers with centrally located nuclei (n) (H&E, ×400).
|
Immunohistochemical results
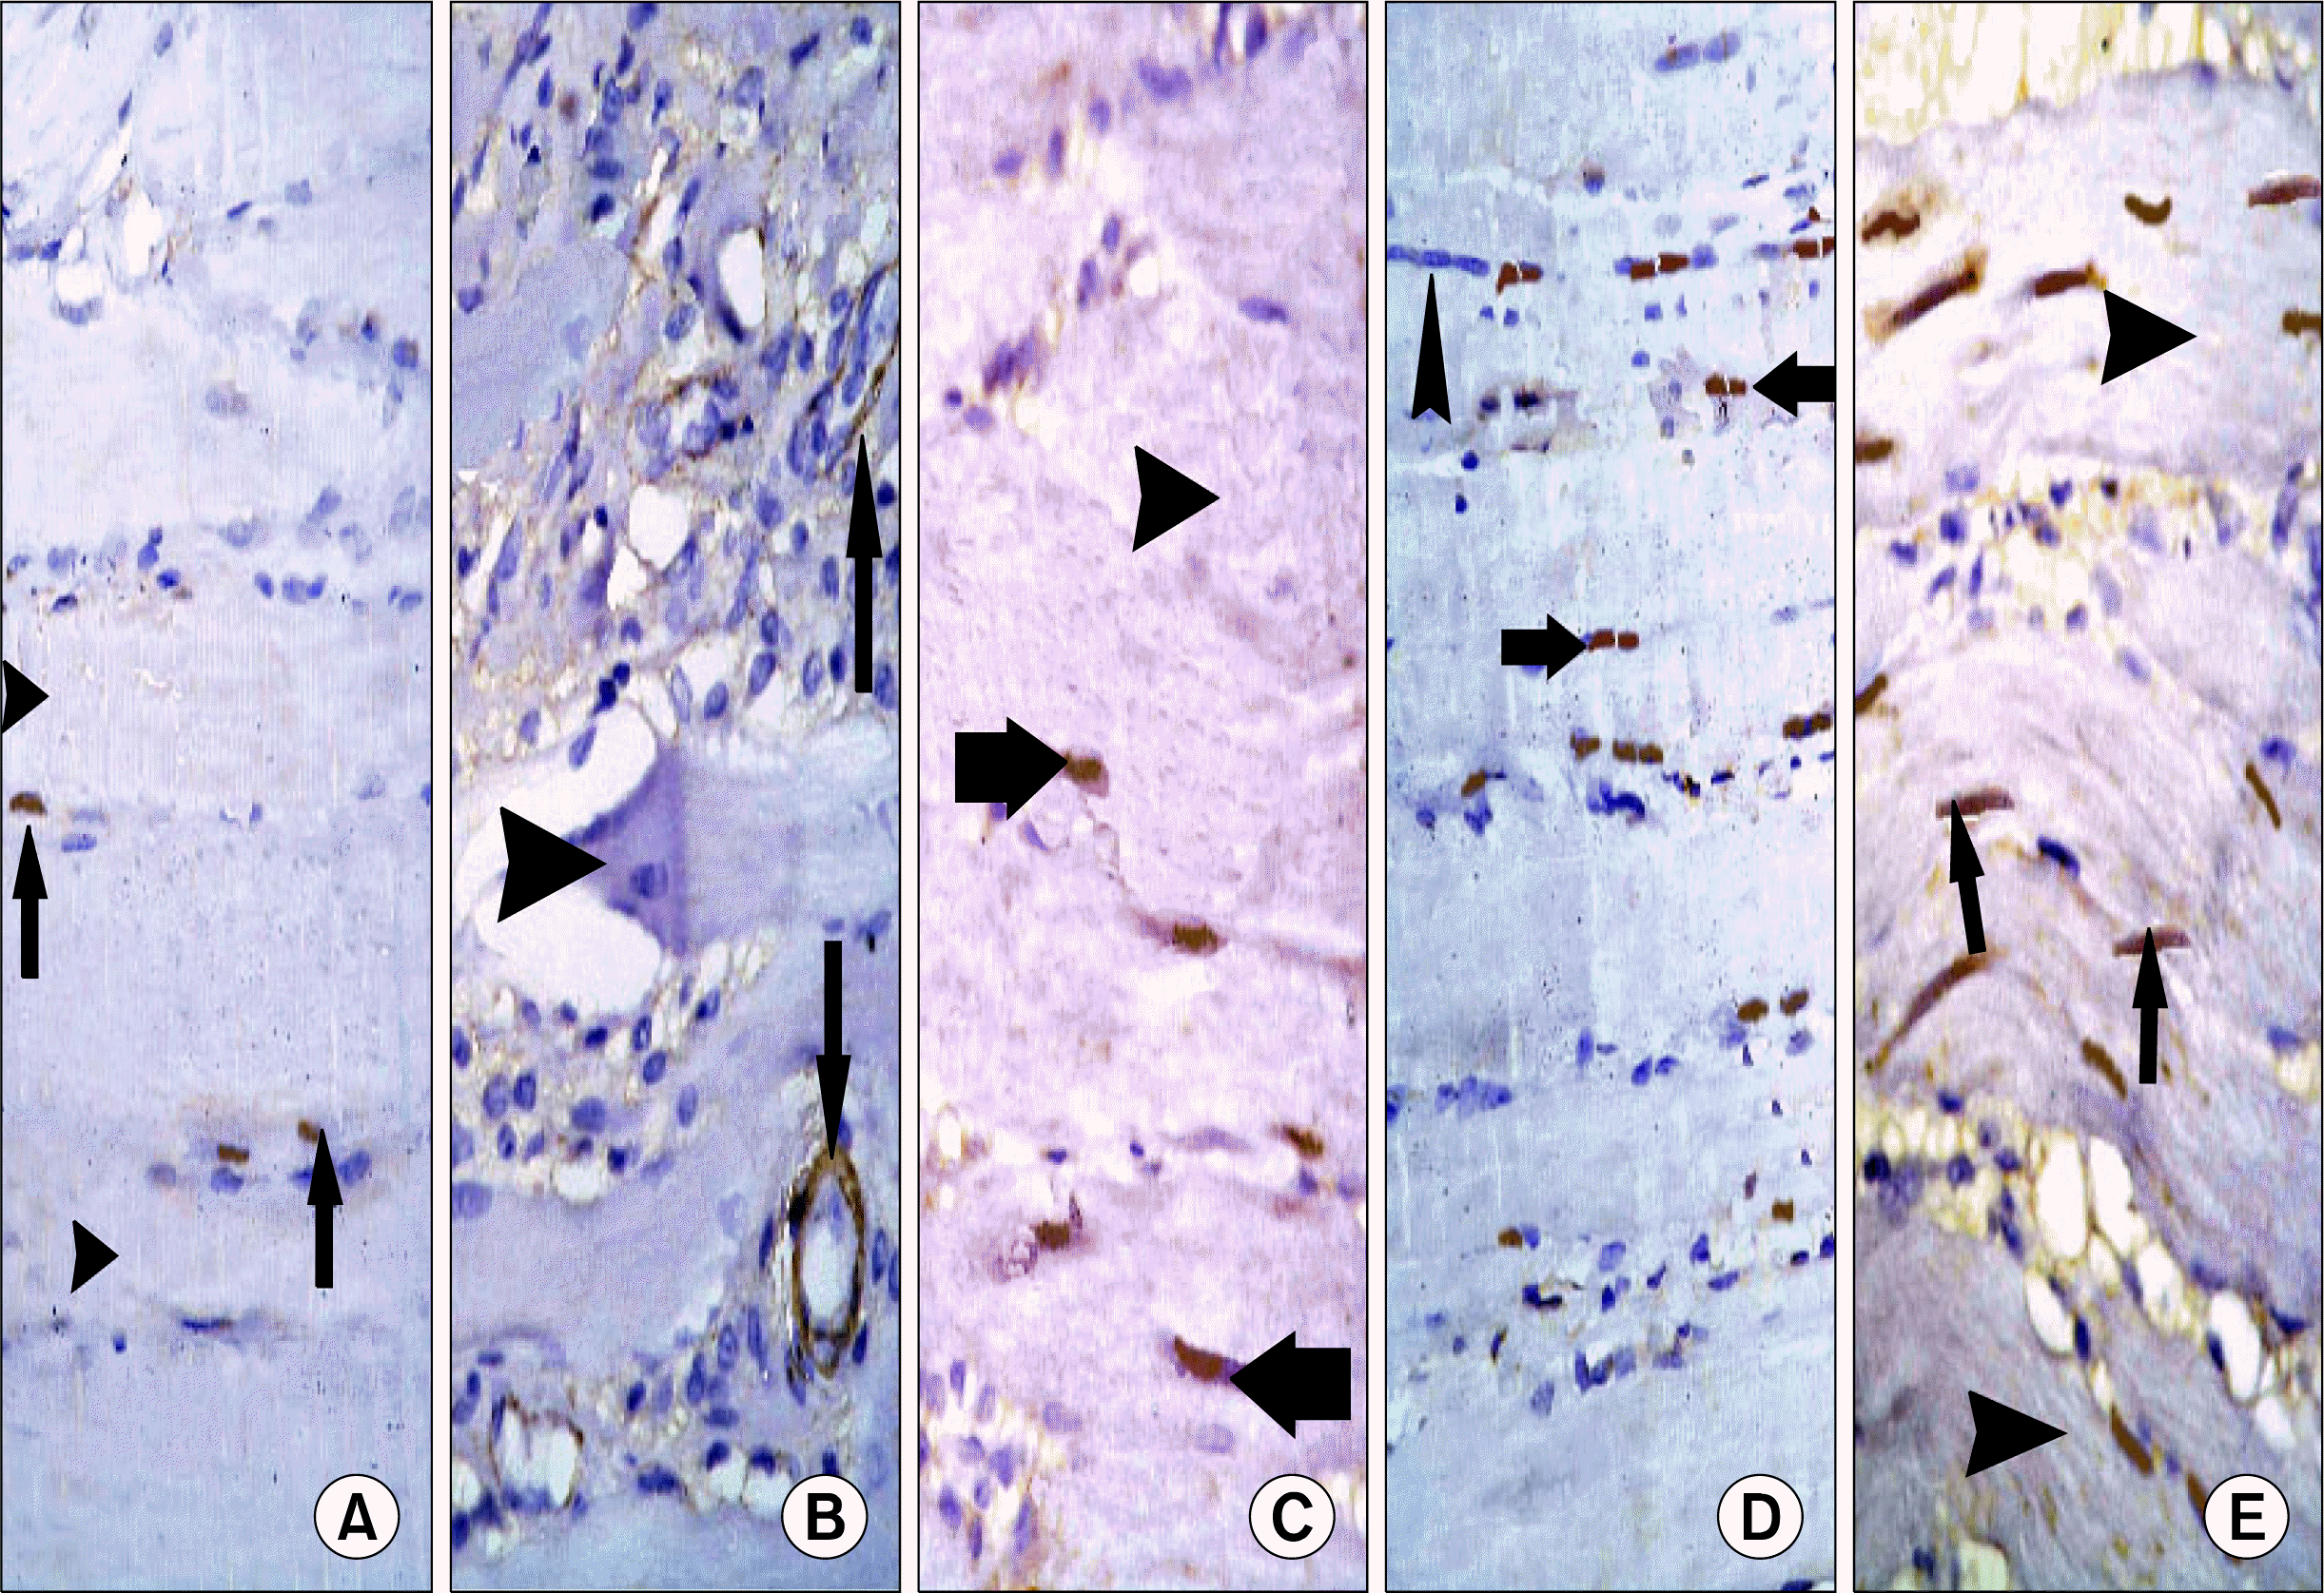 | Fig. 6.(A) Skeletal muscle section of a control rat showing few alpha smooth muscle actin (α SMA) +ve spindle cells (arrows) in between skeletal muscle fibers (arrowheads) (α SMA immunostaining, ×400). (B) Skeletal muscle section of a rat in subgroup I1 showing α SMA +ve spindle cells (arrows) lining 2 blood vessels. Note atypical muscle fibers (arrowheads) (α SMA immunostaining, ×400). (C) Skeletal muscle section of a rat in subgroup I2 showing few α SMA +ve spindle cells (arrows) among some fibers with partial loss of striations (arrowheads) (α SMA immunostaining, ×400). (D) Skeletal muscle section of a rat in subgroup M1 showing some α SMA +ve spindle cells (arrows) among some muscle fibers with centrally located nuclei (arrowheads) (α SMA immunostaining, ×400). (E) Skeletal muscle section of a rat in subgroup M2 showing multiple α SMA +ve spindle cells (arrows) among muscle fibers with striations in most areas of sarcoplasm (arrowheads) (α SMA immunostaining, ×400).
|
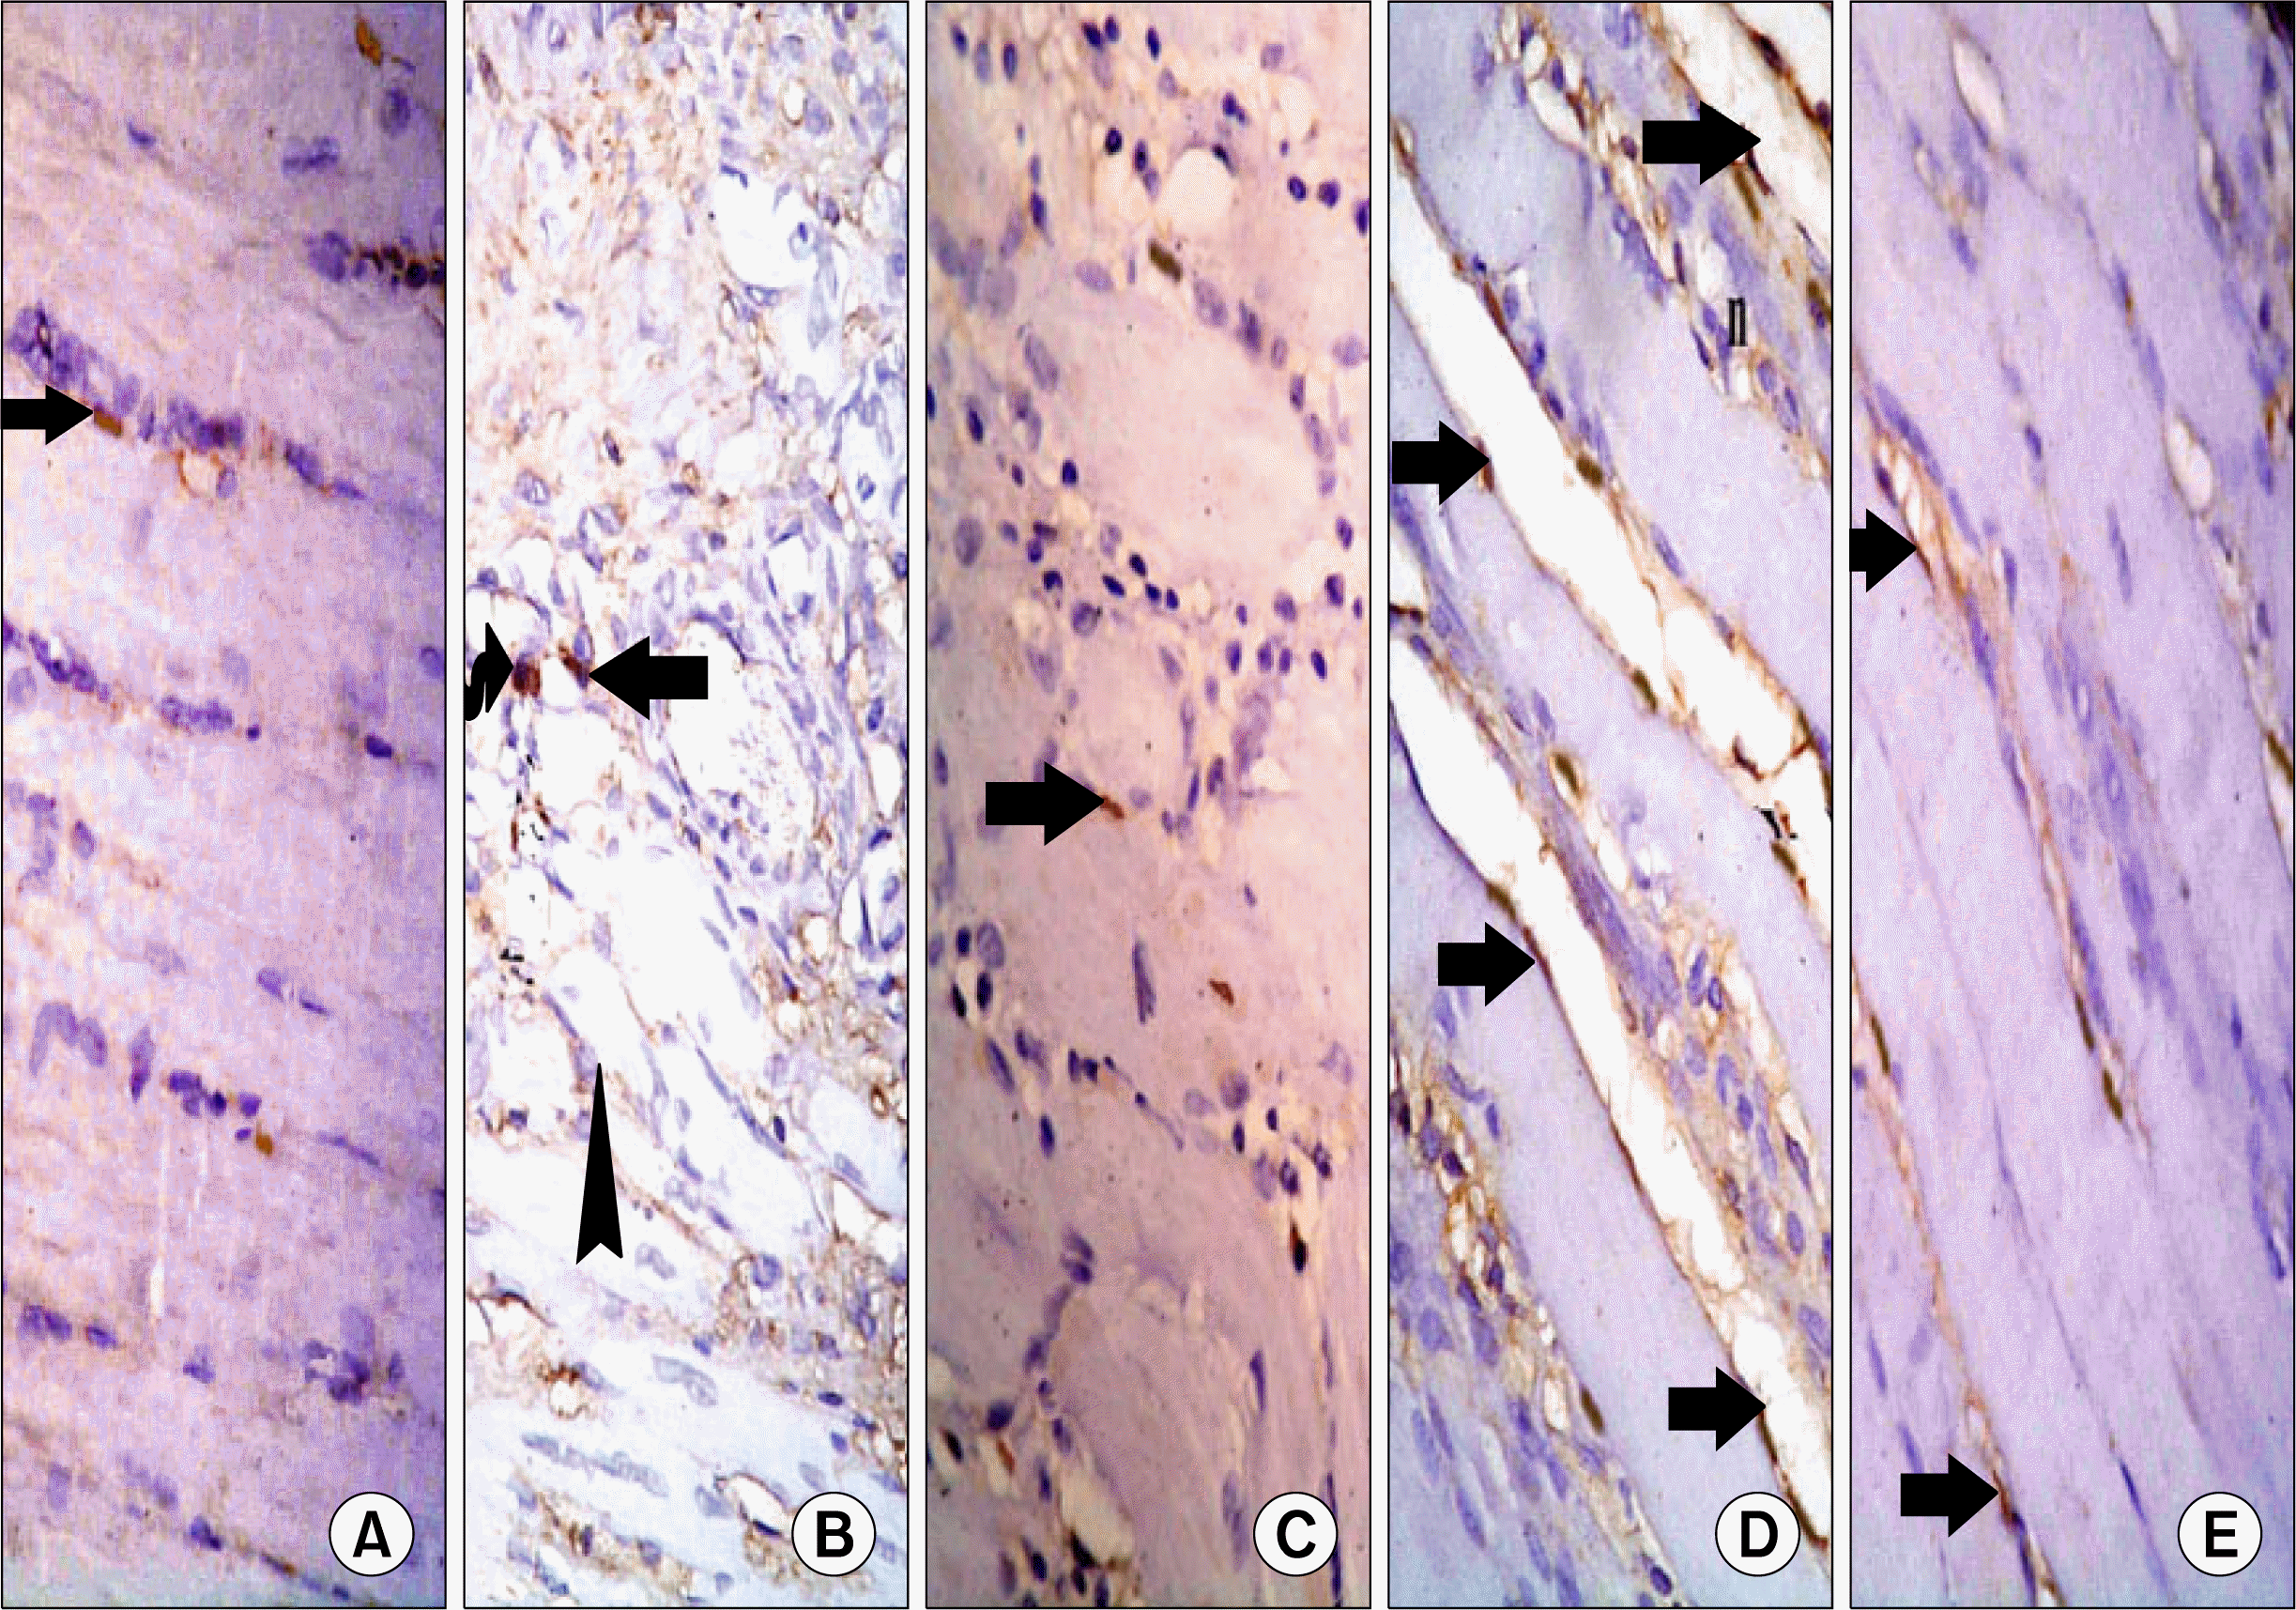 | Fig. 7.(A) Skeletal muscle section of a control rat showing few CD34+ve spindle cells (arrows) at the periphery of the fibers (CD34 immunostaining, ×400). (B) Skeletal muscle section of a rat in subgroup I1 showing a +ve oval (curved arrow) and a +ve spindle (arrow) cells around atypical fibers (CD34 immunostaining, ×400). (C) Skeletal muscle section of a rat in subgroup I2 showing few +ve spindle cells (arrows) at the periphery of the fibers (CD34 immunostaining, ×400). (D) Skeletal muscle section of a rat in subgroup M1 showing multiple +ve spindle cells (arrows) at the periphery of the fibers. Note centrally located nuclei (n) (CD34 immunostaining, ×400). (E) Skeletal muscle section of a rat in subgroup M2 showing some +ve spindle cells (arrows) at the periphery of the fibers (CD34 immunostaining, ×400).
|
Morphometric results
Table 1.
| Groups and Subgroups | Mean area of atypical fibers | Mean area% of alpha SMA +ve cells | Mean area% of CD34+ve cells |
|---|---|---|---|
| Control group | - | 0.98±0.25 | 0.81±0.19 |
| Subgroup I1 | 86.74±9.27 | 1.99±0.35 | 0.79±0.20 |
| Subgroup I2 | 243.38±9.69 | 3.29±1.01 | 1.62±0.47 |
| Subgroup M1 | 41.74±10.57* | 5.67±0.43** | 7.77±0.63$ |
| Subgroup M2 | 13.62±3.39^ | 9.61±1.17# | 3.95±0.26*** |
![]()
 XML Download