Introduction
Materials and Methods
Reagent
Animals
Cell culture and transfection
RT-qPCR assay
Western blotting
MTT proliferation assay
Luciferase reporter assay
Cell cycle profiling
Human testicular samples analysis
Statistics
Results
miR-181a was upregulated during spermatogenesis
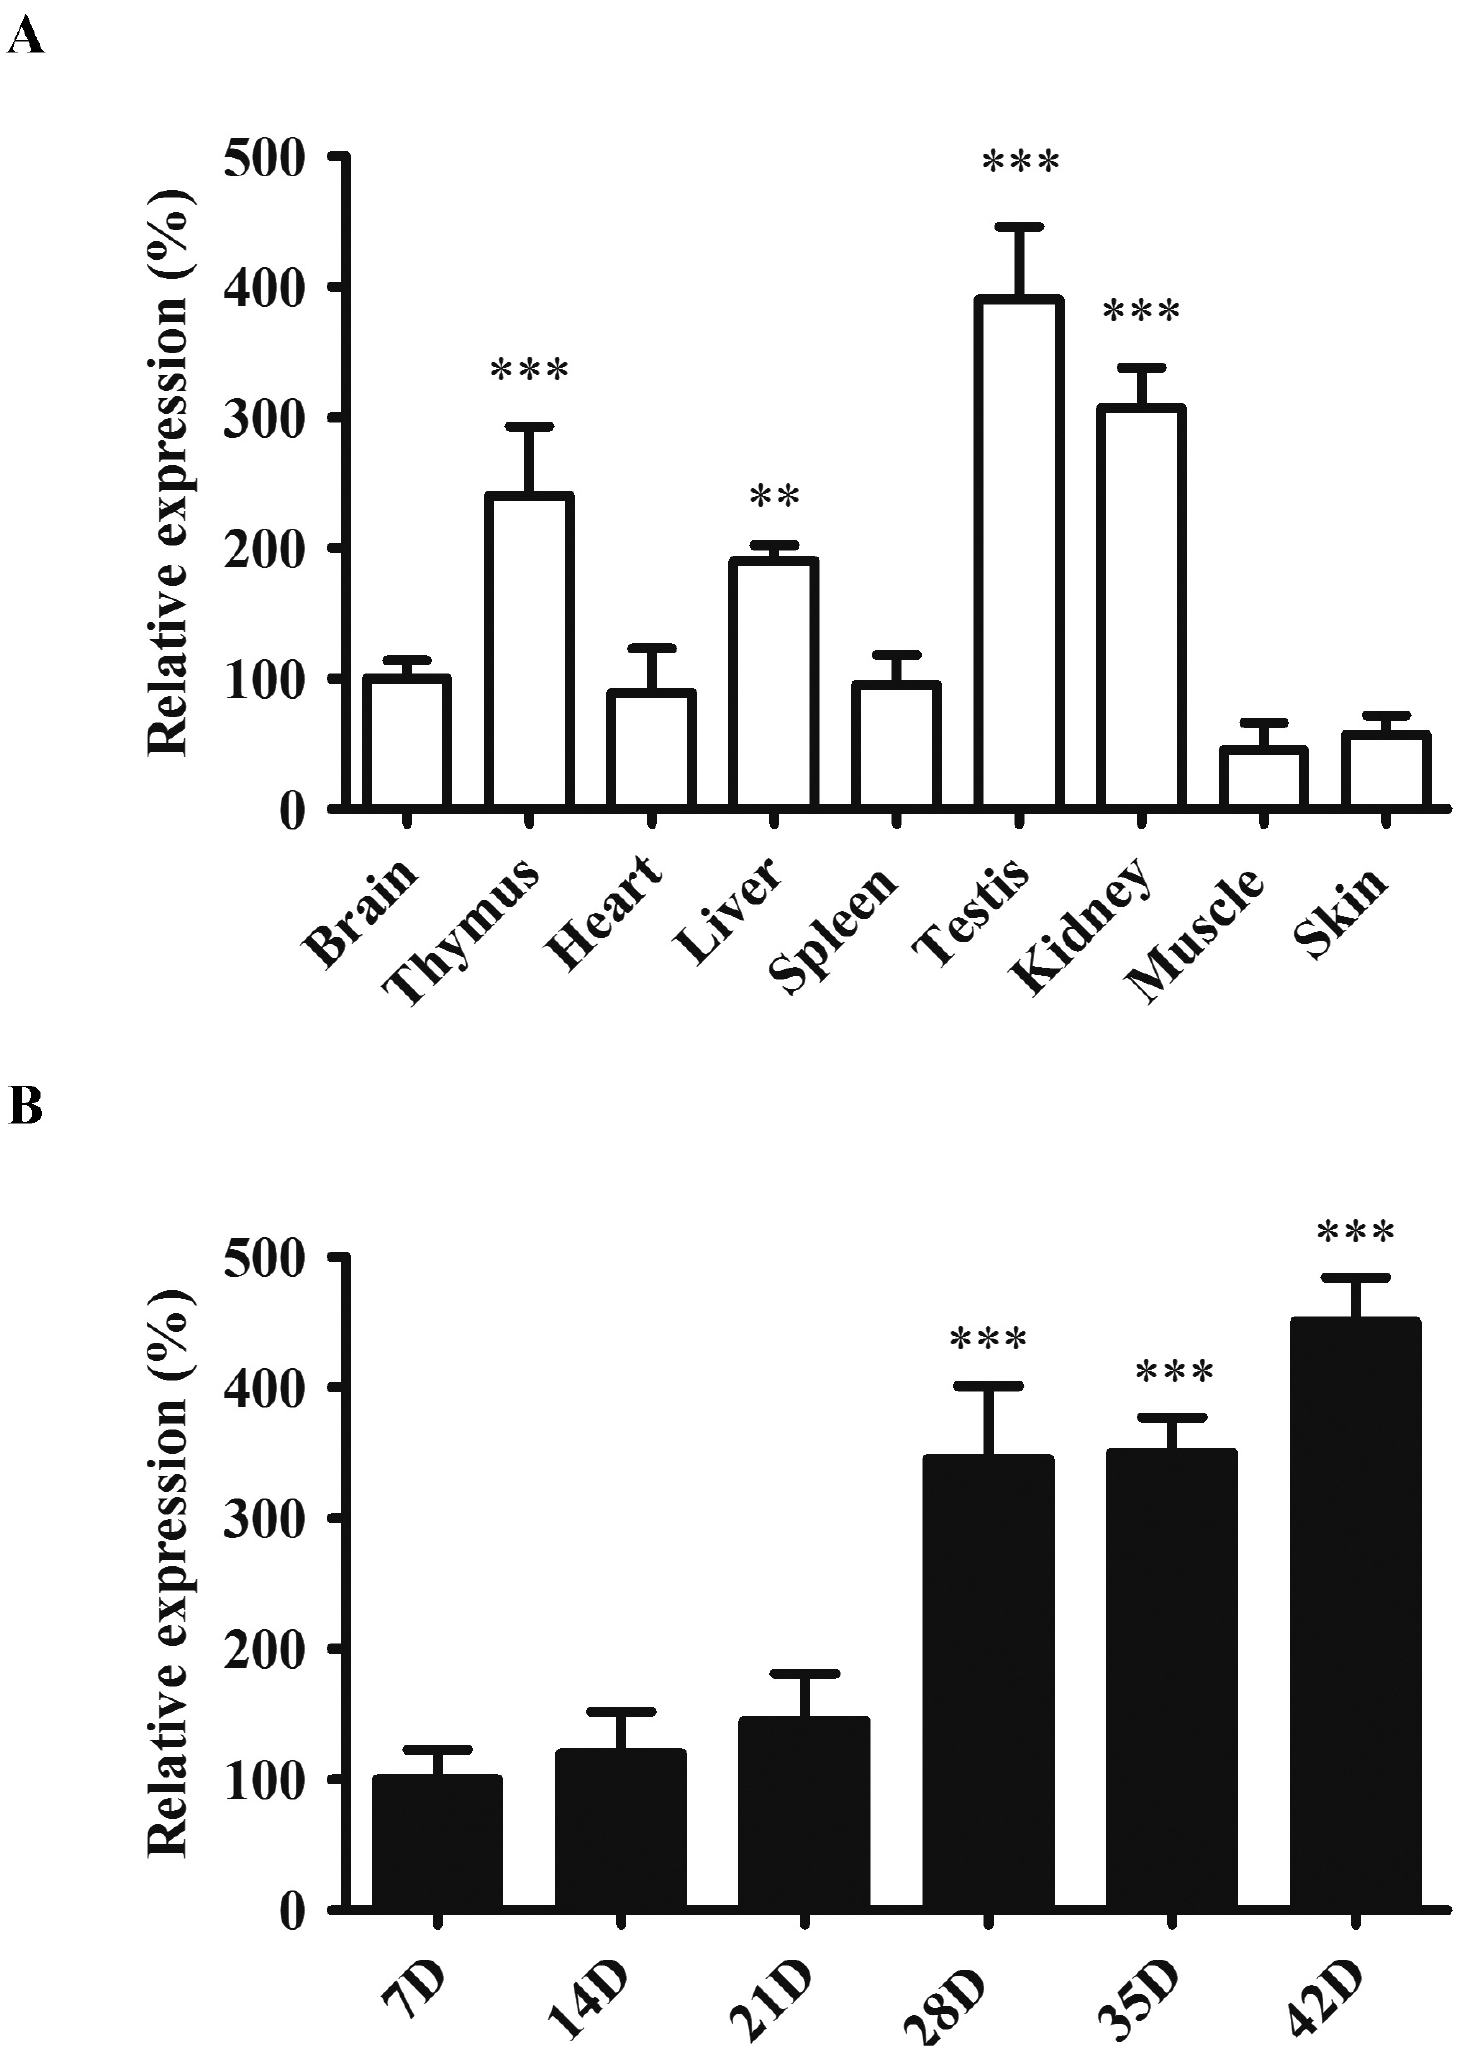 | Fig. 1miR-181a was upregulated during spermatogenesis. (A) Relative expression of miR-181a in different mouse tissues. The relative change of the miRNA in different tissues was normalized to that of the brain (***p<0.001 as compared with skin tissues). (B) Relative expression of miR-181a at different postnatal ages of mouse testes. The relative change of the miRNA at different time points was normalized to that of day 7 postnatally. Values were presented as mean±SD (n=6, ***p<0.001 as compared with the sample of day 7). |
miR-181a promoted spermatogonia cell proliferation
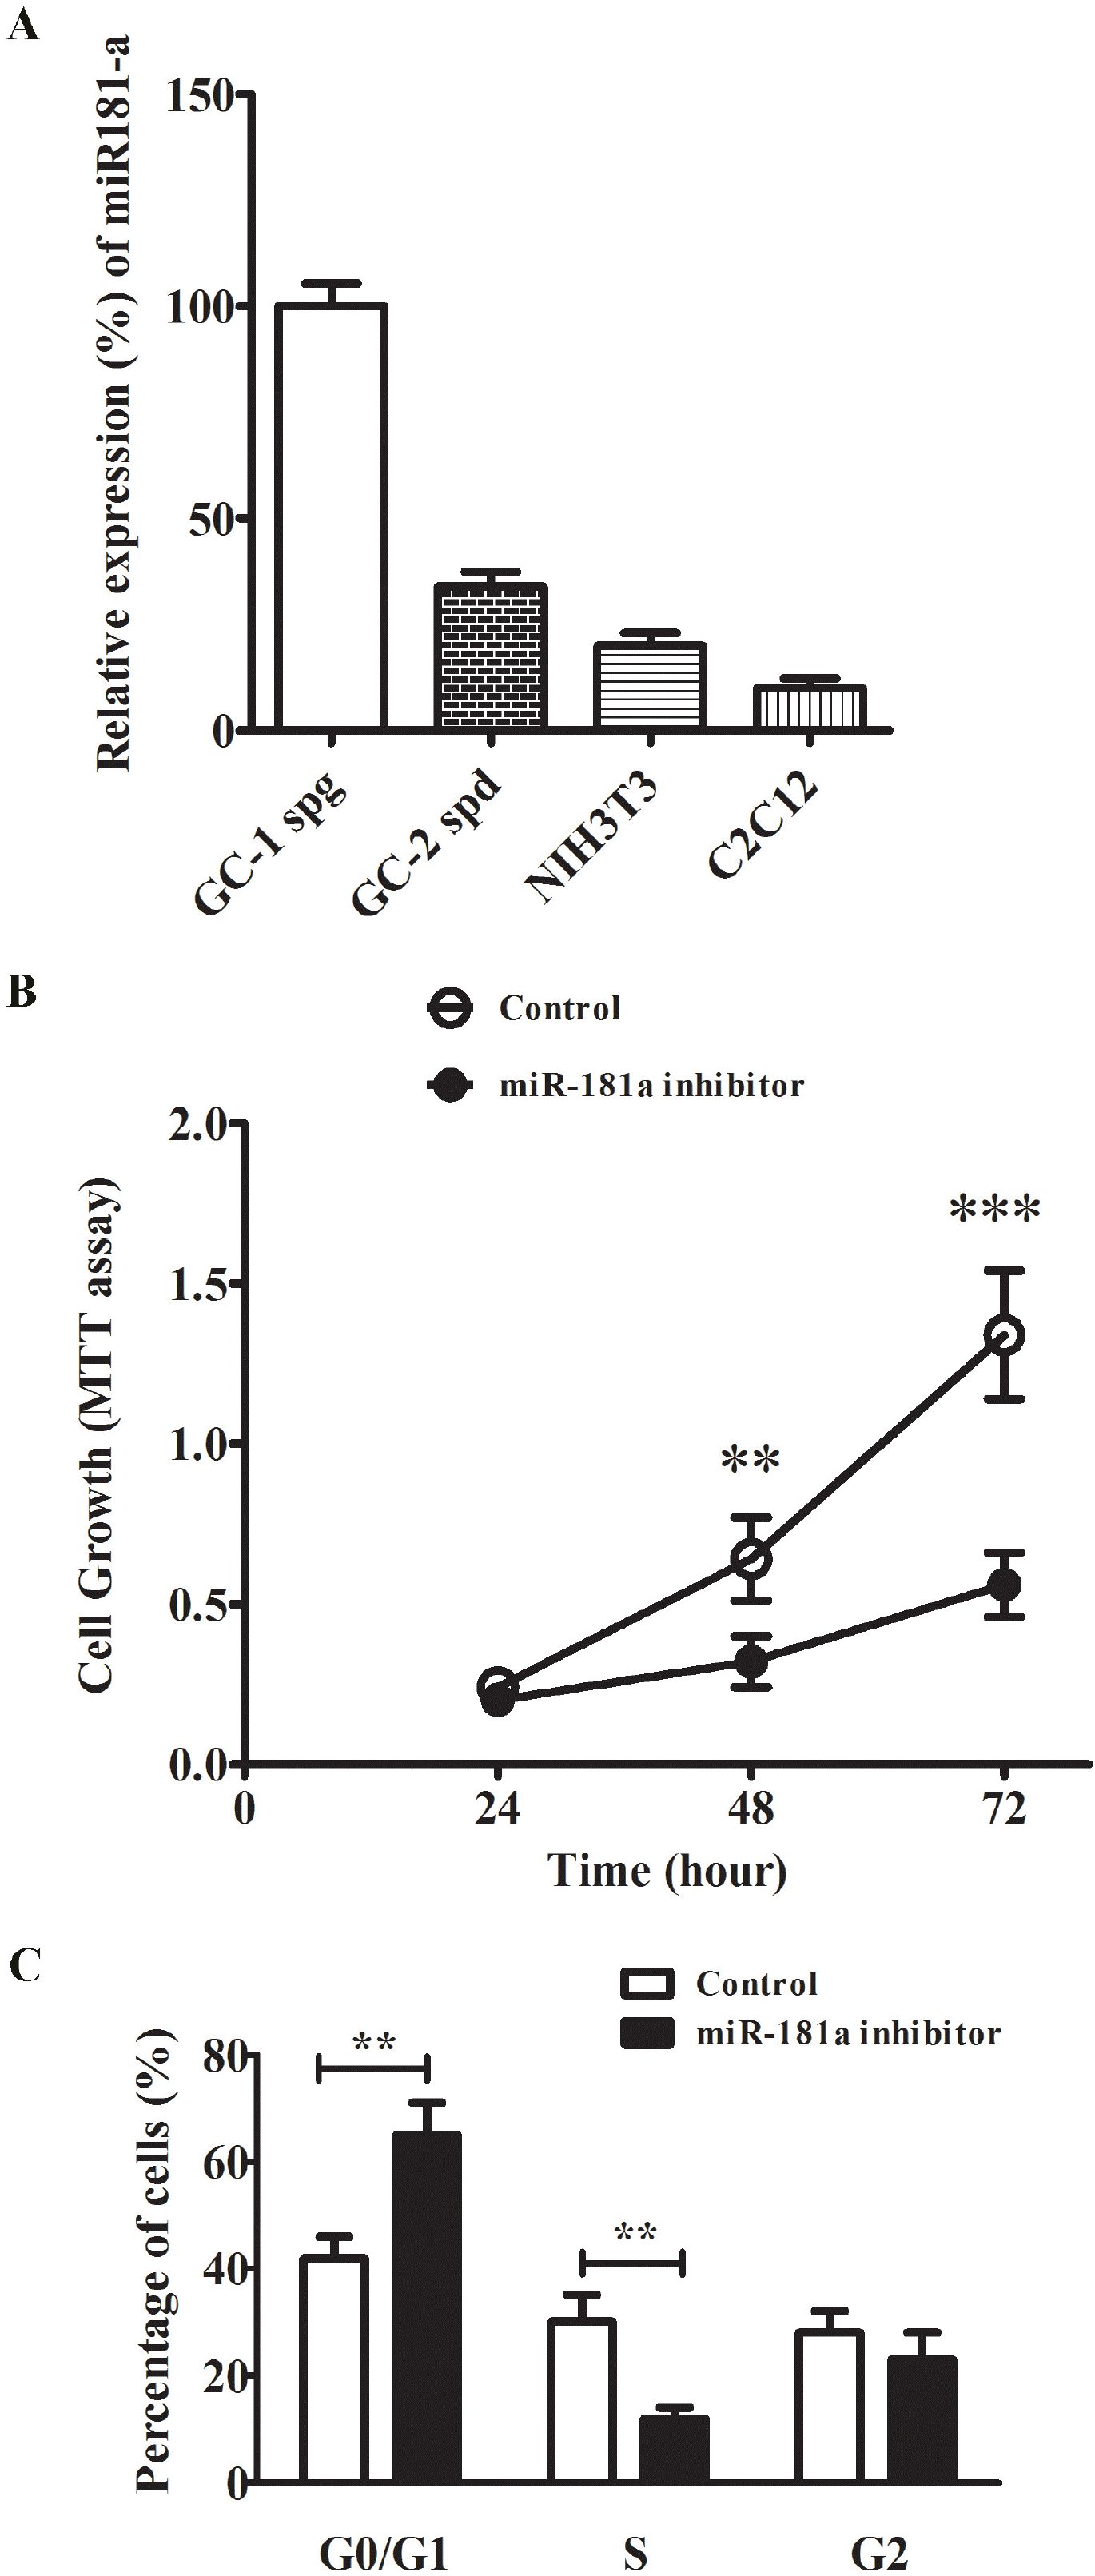 | Fig. 2miR-181a regulated GC-1 spg proliferation. (A) Relative expression of miR-181a in GC-1 spg, GC-2 spd, NIH3T3 and C2C12 cell lines. The miRNA level in GC-1 spg was set to 100%. (B) Cell proliferation analysis of GC-1 spg cells transfected with either miR-181a inhibitor or scramble control. The growth rate of cells was monitored using MTT kit for 72 h. (C) Representative histogram data of the cell-cycle analysis of GC-1 spg cells transfected with either miR-181a inhibitor or scramble control. The representative images from at least three independent experiments were shown. The data were presented as means±SD (**p<0.01, ***p< 0.001 as compared with control). |
S6K1 was downstream target of miR-181a in GC-1 cells
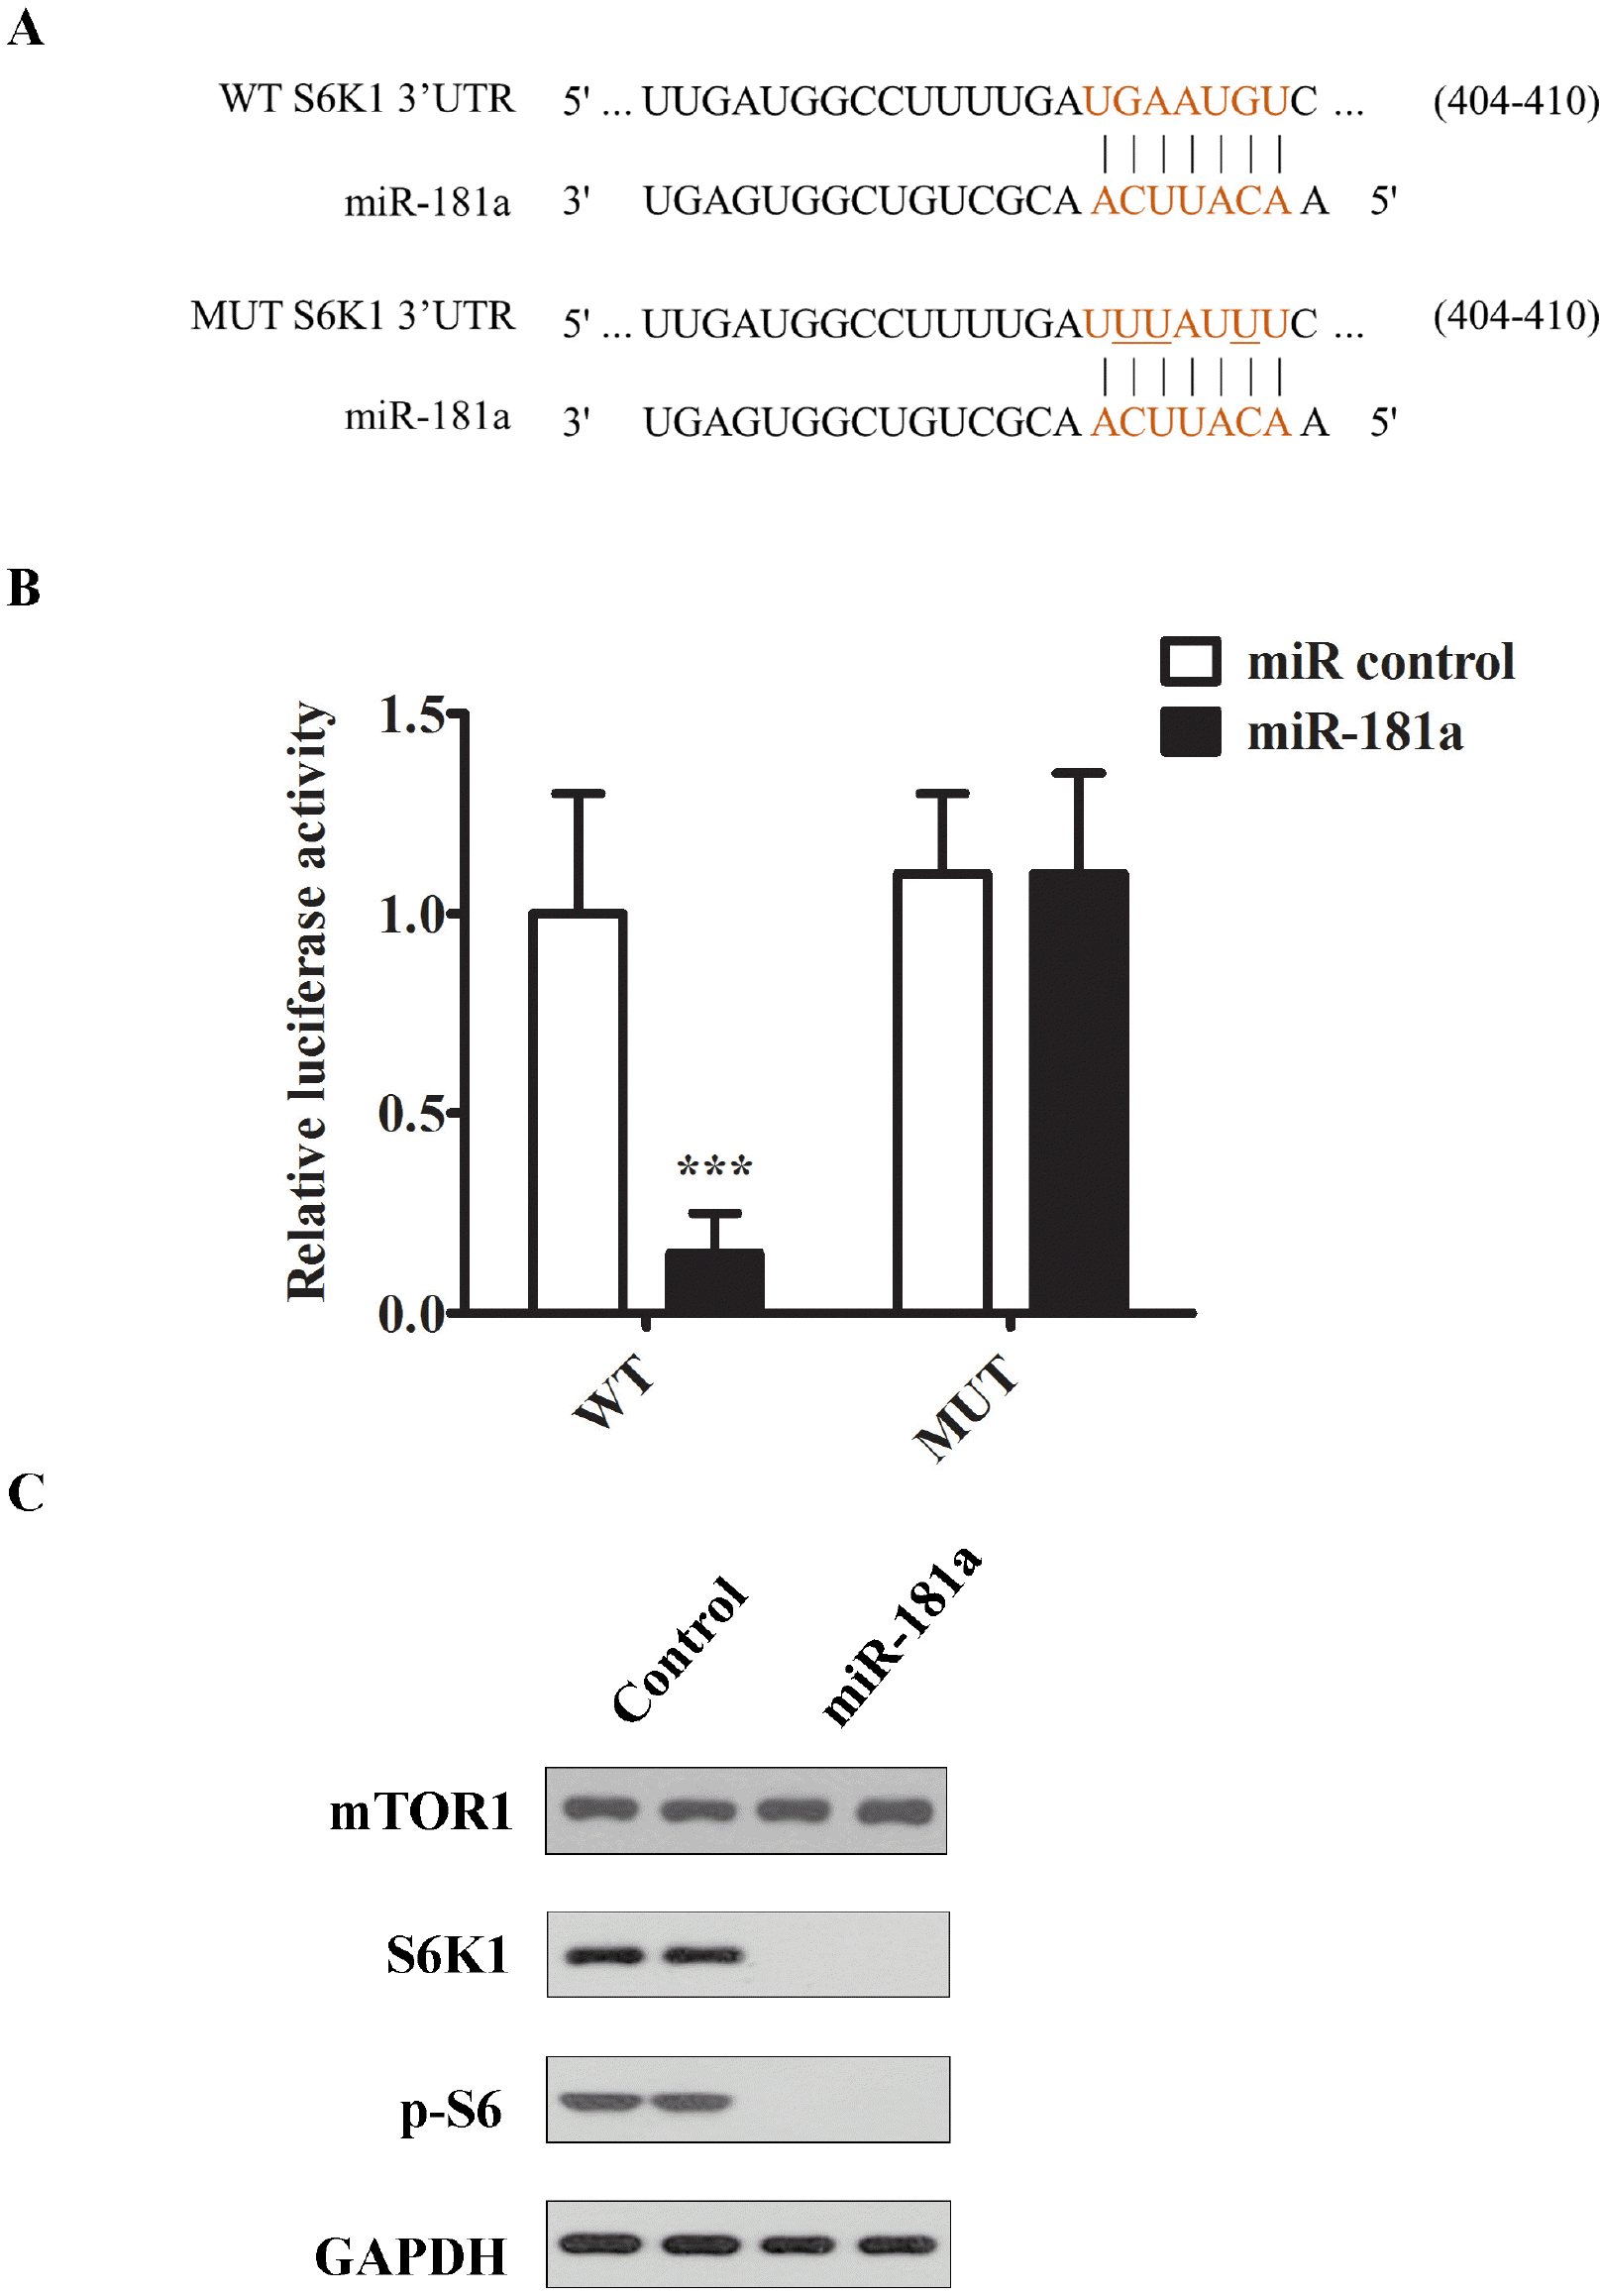 | Fig. 3S6K1 was downstream target of miR-181a in cells. (A) Schematic diagram of a conserved putative miR-181a targeting site in 3’UTR of S6K1 (WT). The site mutations were introduced to miR-181a targeting site of 3’UTR (MUT). (B) Luciferase reporter assay study of the interaction between miR-181a and 3’UTR of S6K1. GC1 spg cells were transfected with luciferase reporter genes conjugated with either wildtype (WT) or mutant (MUT) 3’UTR of S6K1. 24 hours later, the cells were transfected further with either miR-181a mimic or scramble control. Transfected cells were cultured for 48 hour and then harvested for the measurement of luciferase activities in a plate reader. (C) Western blotting analysis of mTOR1, S6K1, p-S6K1 in cells transfected with either miR-181a or scramble control. The representative image from at least three independent experiments was shown. The representative images from at least three independent experiments were shown. The data were presented as means±SD (*p<0.05, **p<0.01, ***p< 0.001 as compared with the control). |
S6K1 over-expression attenuated GC-1 spg cell proliferation
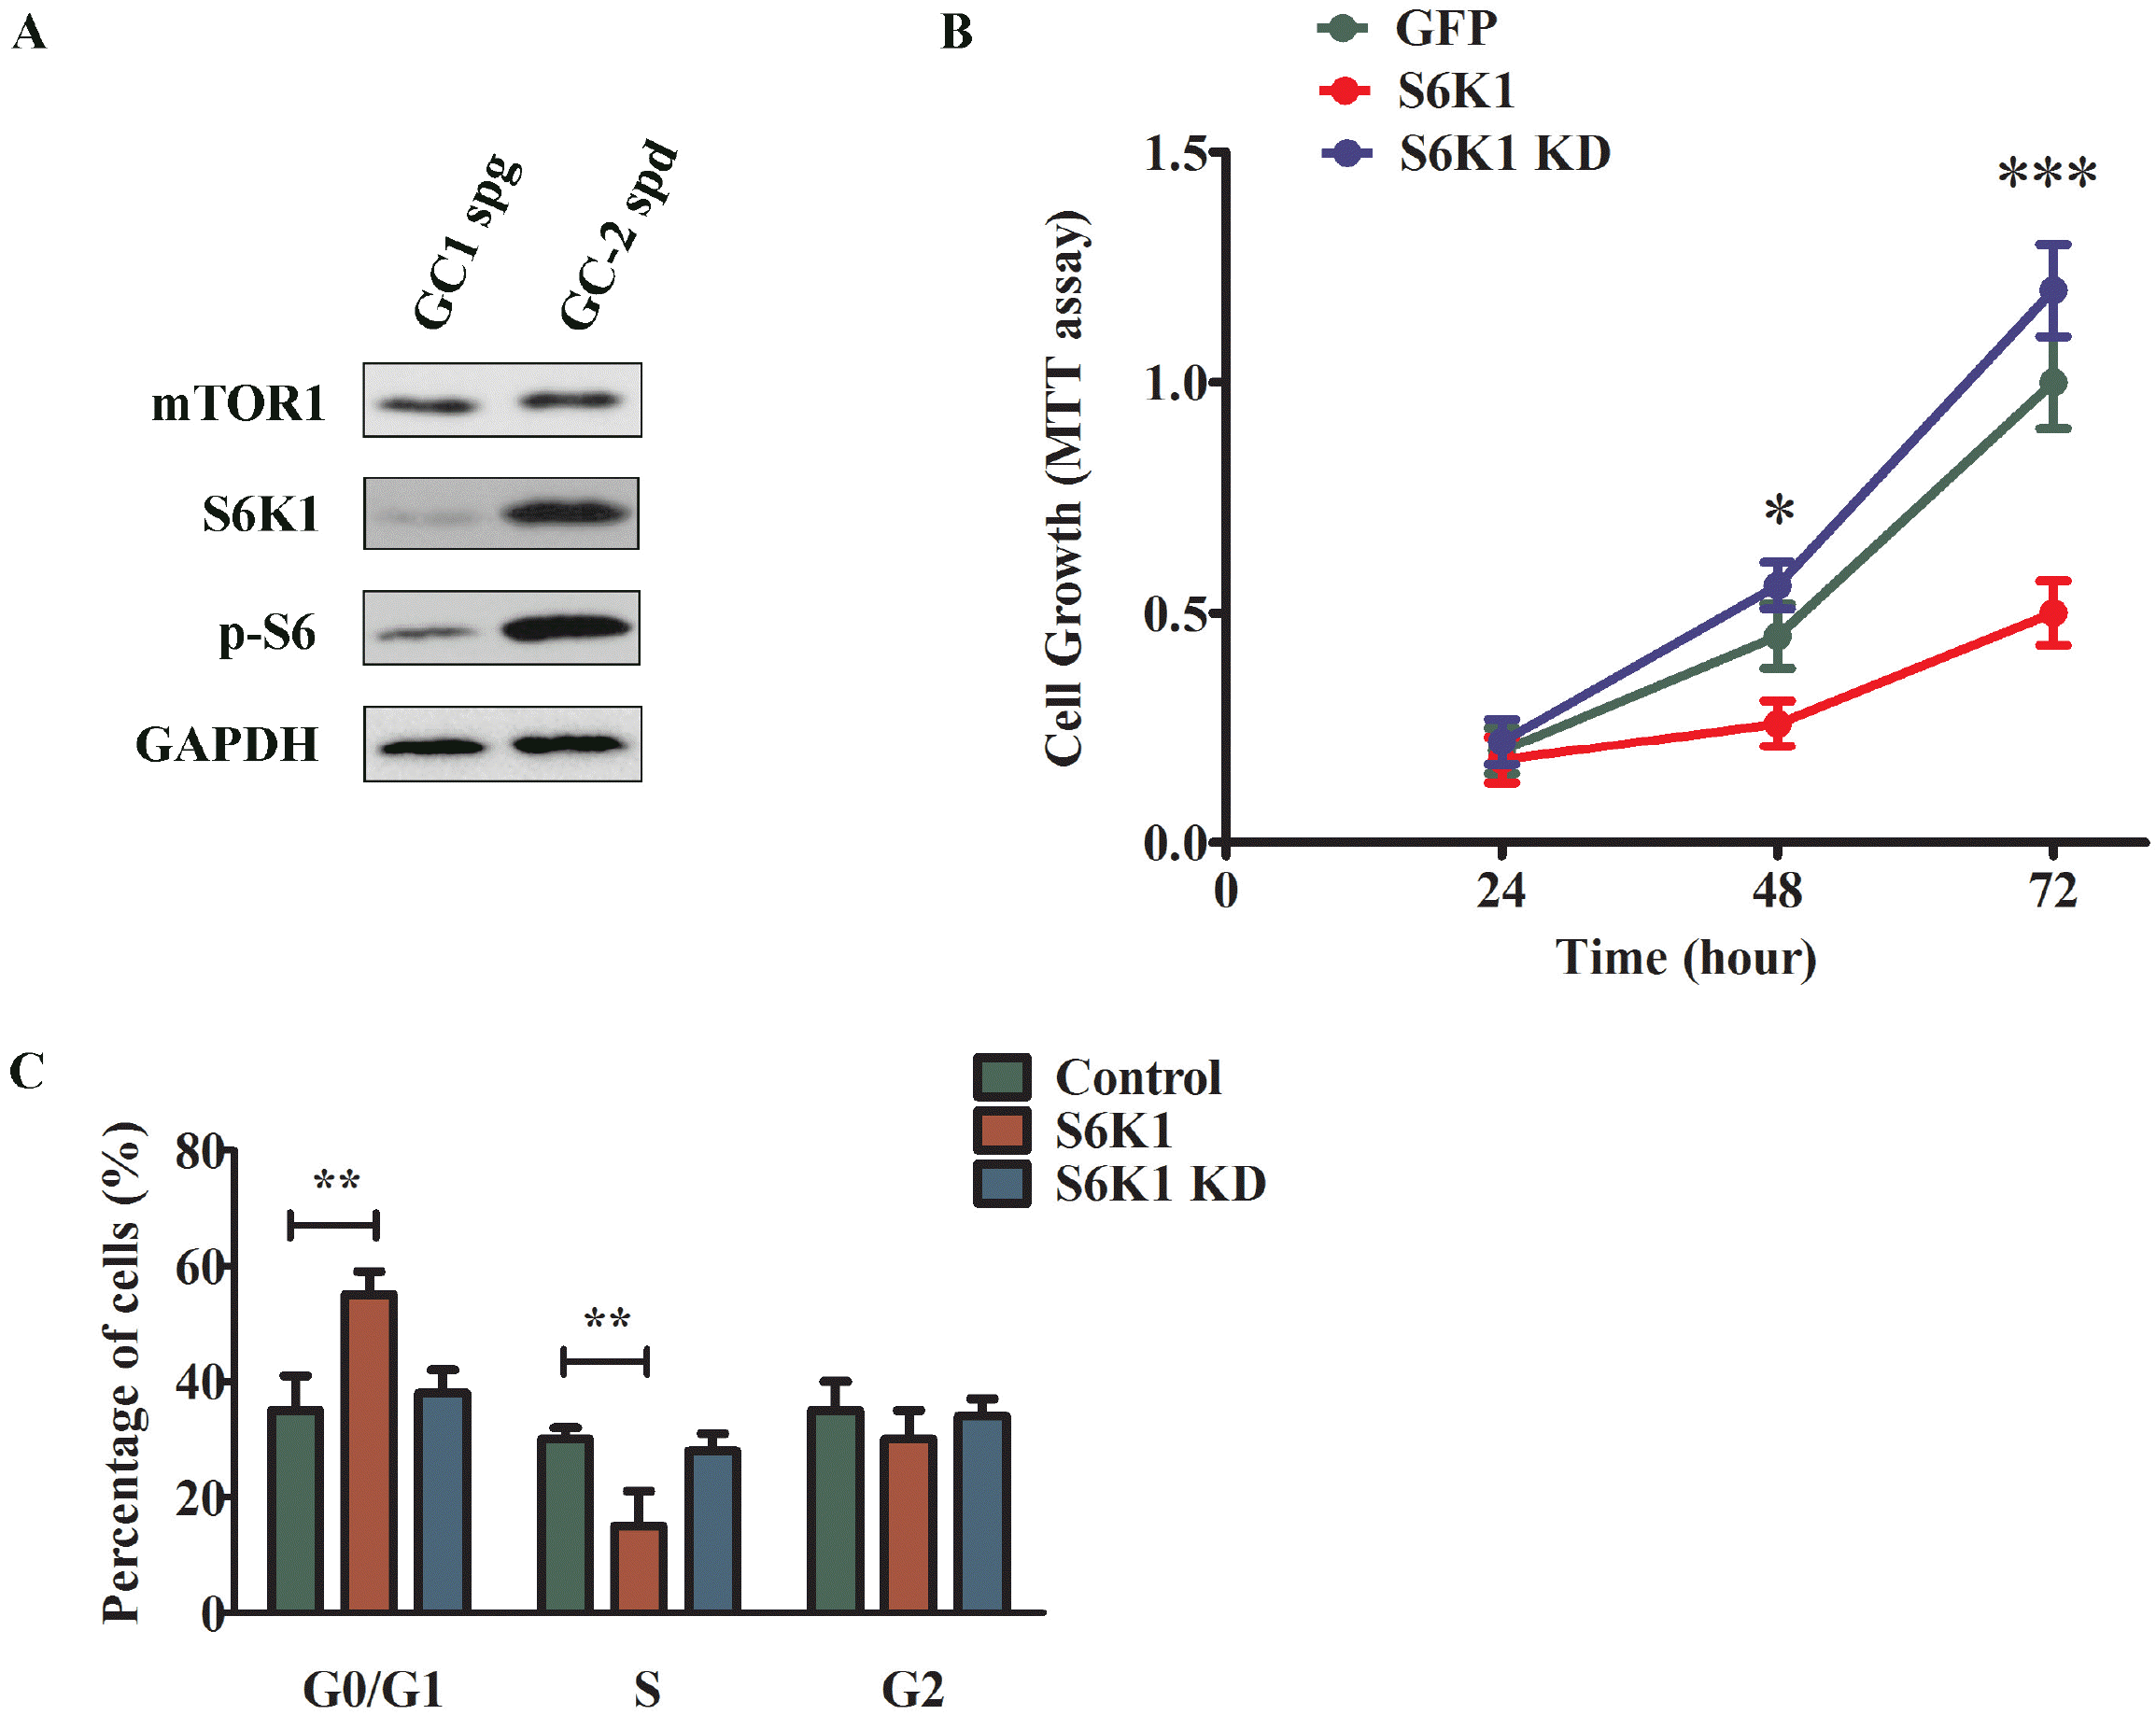 | Fig. 4S6K1 over-expression attenuated GC-1 spg cell proliferation. (A) Western blotting analysis of mTOR1, S6K1, p-S6K1 in GC1 spg and GC-2 spd cell lines. (B) Cell proliferation analysis of GC-1 spg cells transfected with GFP or S6K1 or S6K1 kinase dead mutant. The growth rate of cells was monitored using MTT kit for 72 h. (C) Representative histogram data of the cell-cycle analysis of GC-1 spg cells transfected with transfected with GFP or S6K1 or S6K1 KD mutant. The representative images from at least three independent experiments were shown. The data were presented as means± SD (*p<0.05, **p<0.01, ***p< 0.001 as compared with control). |
Inhibiting S6K1 activity rescued the antagonizing effects of miR-181a inhibitor in GC-1 spg cell growth
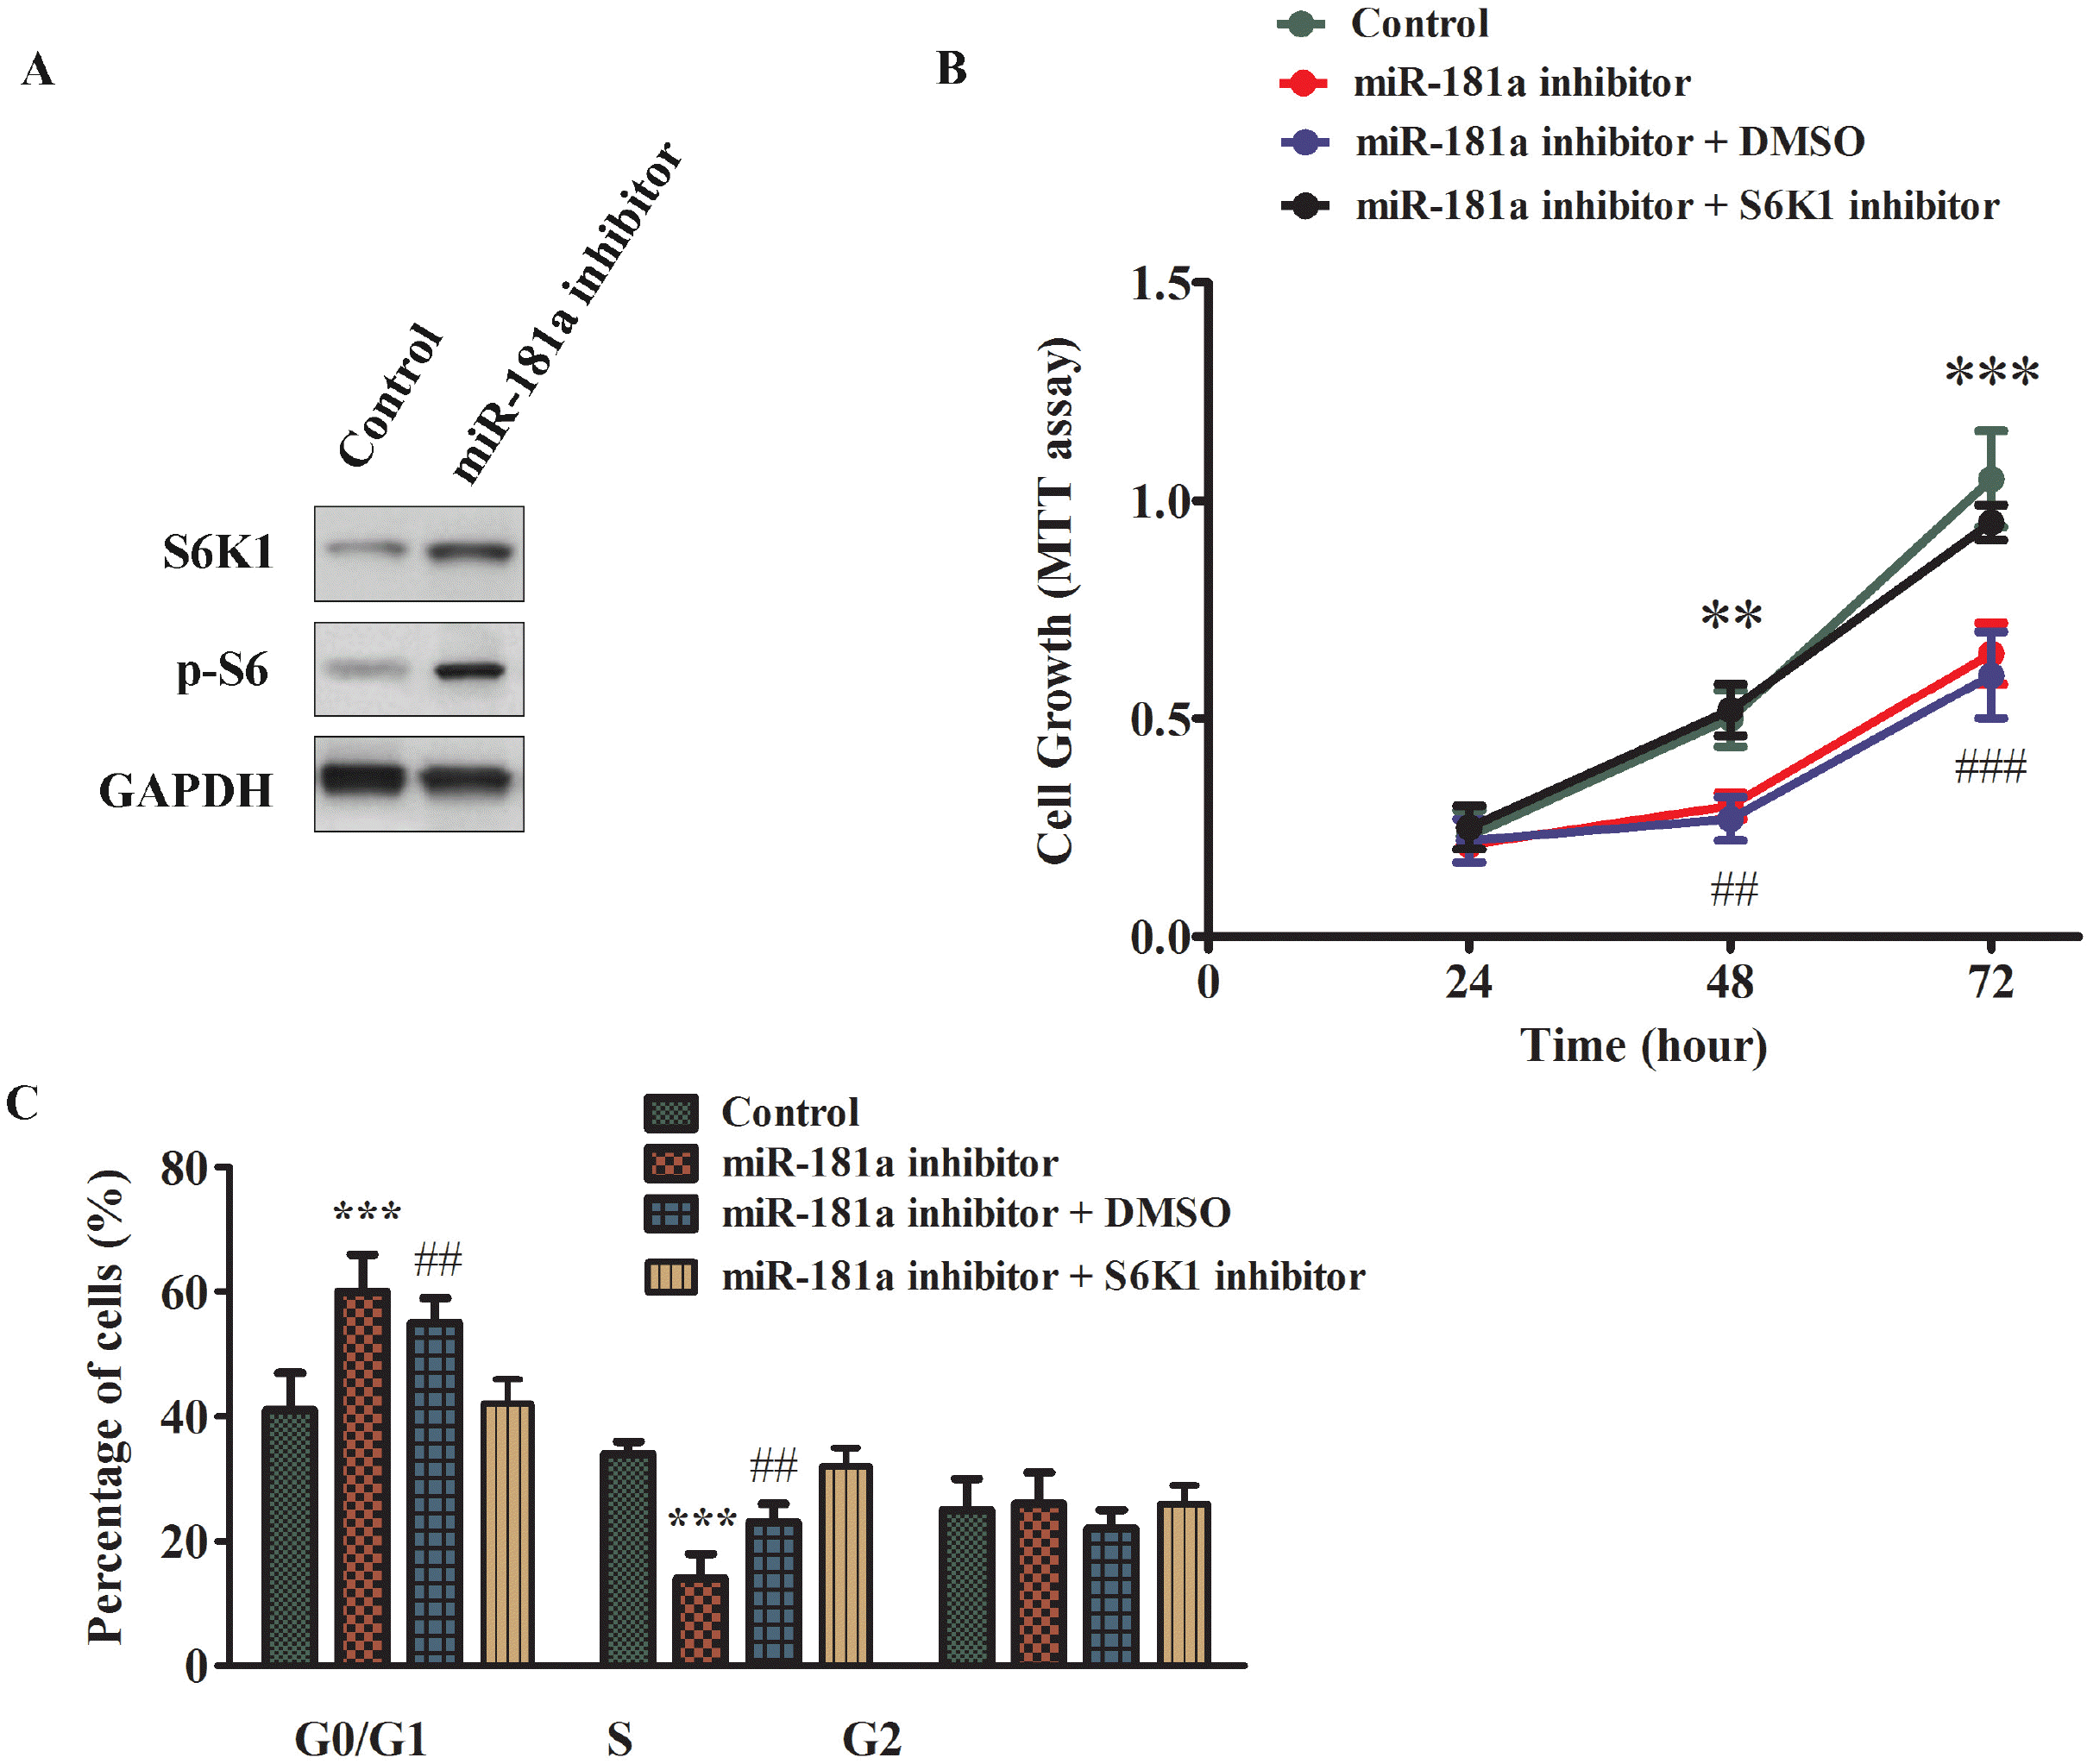 | Fig. 5Inhibiting S6K1 activity rescued the antagonizing effects of miR-181a inhibitor in GC-1 spg cell growth. (A) Western blotting analysis of S6K1 and p-S6K1 in GC1 spg cells transfected with control or miR-181a inhibitor. (B) Cell proliferation analysis of GC-1 spg cells transfected with control or miR-181a inhibitor. In parallel, the miR-181a inhibitor transfected cells were also treated with S6K1 kinase inhibitor or DMSO. The growth rate of cells was monitored using MTT kit for 72 h. (C) Representative histogram data of the cell-cycle analysis of GC-1 spg cells in different treatment conditions as described above. The representative images from at least three independent experiments were shown. The data were presented as means±SD (*p<0.05, **p<0.01, ***p<0.001 as compared with control). |
miR-181a was downregulated in the testis tissues of sterile men with non-obstructive azoospermia
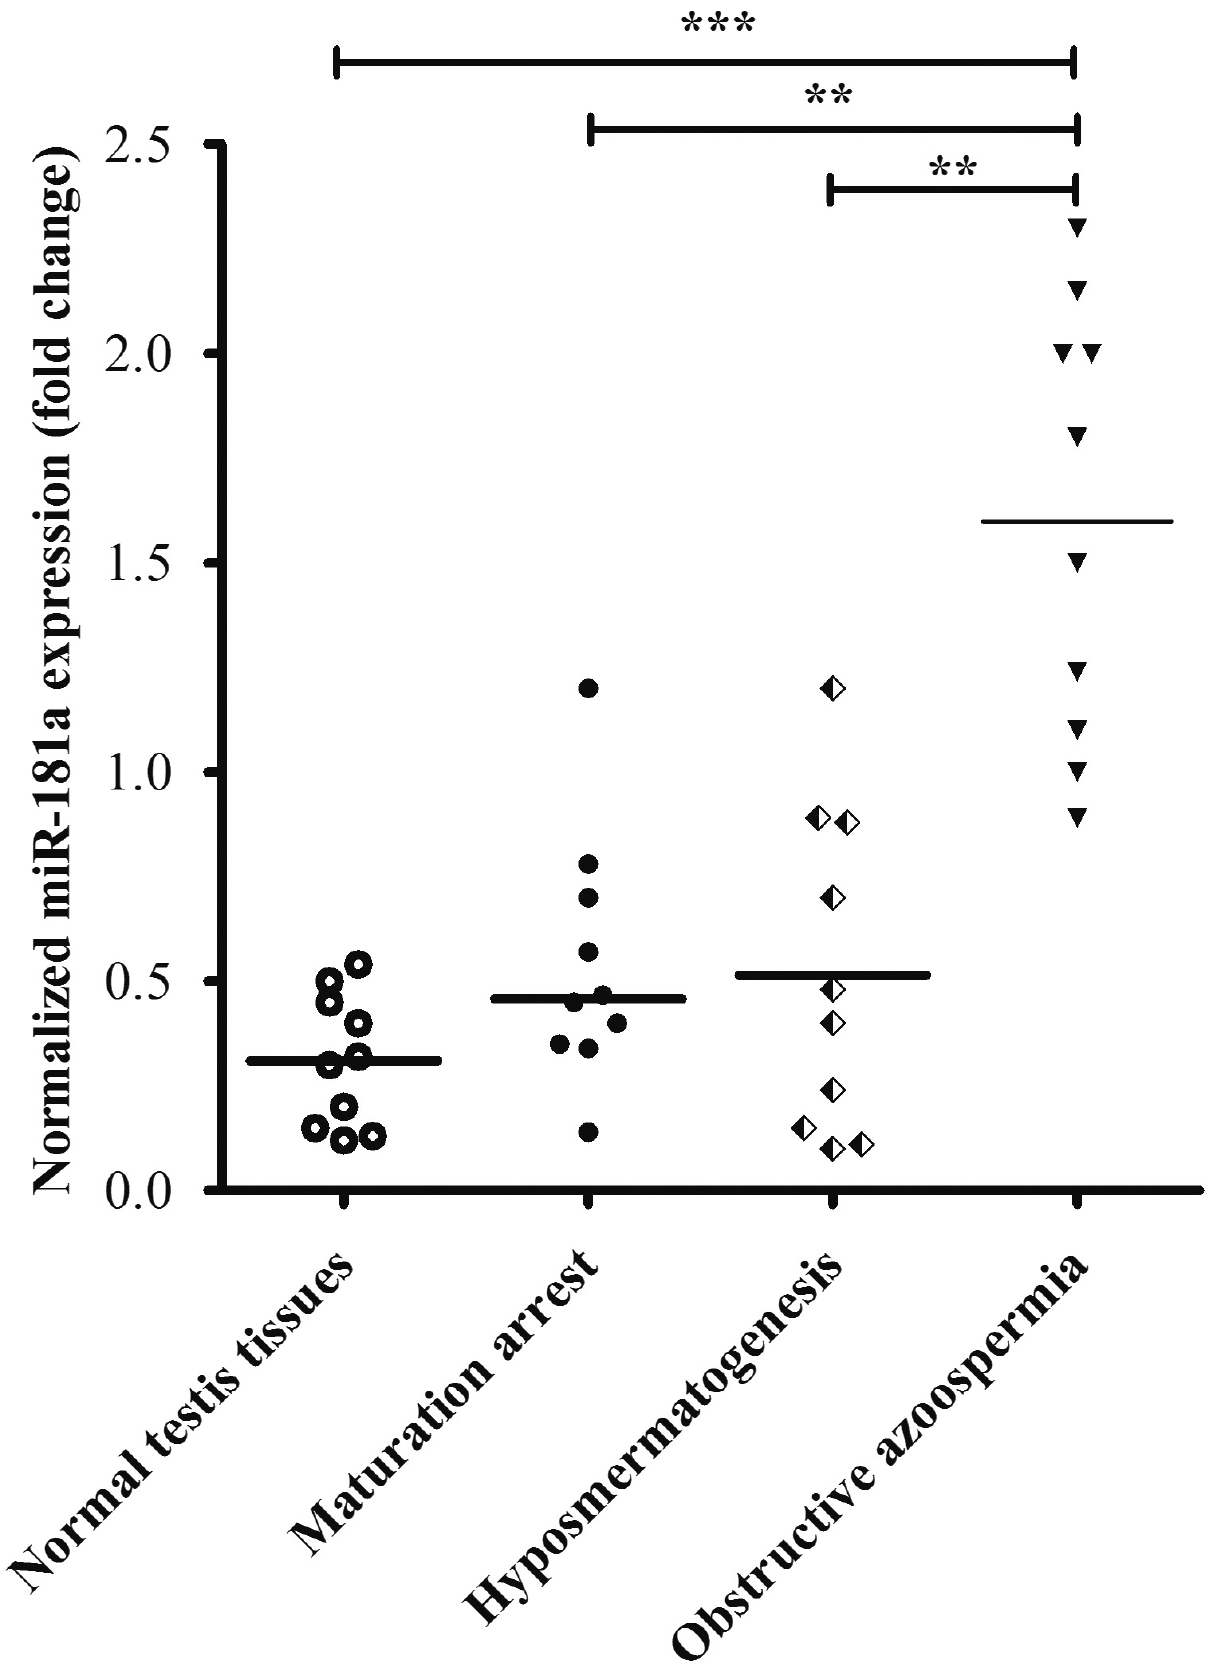 | Fig. 6miR-181a was downregulated in the testis tissues of sterile men with non-obstructive azoospermia. miR-181a expression level in testis of patients with maturation arrest, hypo-spermatogenesis or non-obstructive azoospermia was quantified by real time PCR (n=10 for each group and **p<0.01 as compared with non-obstructive azoospermia patient group). The expression levels of the mRNA were also quantified in normal testis tissues from post-mortal donors. |


 PDF
PDF Citation
 Print
Print


 XML Download