

 PDF
PDF Citation
 Print
Print


Introduction
Tendinopathy, defined by Dakin et al. (1) as an acute or chronic disorder of a tendon, is one of the most frequent overuse lesions within sporting arena (2). Sport activity is the most common etiologic factor for Achilles tendon injury. Work- and age-related injuries are associated mostly to hand and wrist tendons trauma and rotator cuff disorders, respectively (3). To improve limited ability of tendon to auto-repair, researchers and clinical practitio-ners try to apply novel regenerative medicine methods (4, 5).
Nowadays, one of the approaches in tendon tissue engineering is the use of mesenchymal stromal cells (MSCs) transplantations and tissue-specific growth factors (4). It is postulated that MSCs can support tissue regeneration in following three mechanisms: 1) direct differentiation into target tissue cells and thus the replacement of defected and dead cells; 2) paracrine influence stimulating angiogenesis, cell proliferation and differentiation; 3) paracrine and direct influence on immune cells (6).
The concept of direct differentiation was recently supported by a study, in which human adipose-derived MSCs (ASCs) were transplanted into rat injured tendon. One month after transplantation, grafted cells expressed tendon associated proteins which suggests tenogenic differentiation (7). It is believed that direction of MSCs to tenogenic path before transplantation can enhance beneficial effect of this procedure. Several approaches have been proposed in order to enhance expression of tenogenic markers in MSCs. The first of them is the addition of certain growth factors during in vitro culture. The most promising factors for tendon regeneration are bone morphogenic proteins 12, 13 and 14 (BMP-12, BMP-13, BMP-14), (8, 9). The second approach is the direct or indirect co-culture of MSCs with tenocytes (10, 11). This method makes culture conditions more similar to tendon environment that drives the differentiation process. However, the availability of tenocytes, especially human ones, is very limited. Another possible way to enhance tenogenic differentiation in vitro is to use mechanical stimulation. It has been already demonstrated that certain mechanical protocols can enhance tenogenesis (12, 13). In general, many in vitro differentiation induction methods aim to reflect the conditions of a given niche in vivo.
Following this lead, we aimed to evaluate if serum deprivation is able to induce tenogenic differentiation in MSCs. We hypothesize that low serum conditions can effectively mimic tendon tissue environment, since a tendon is relatively low vascularized tissue with a limited ability of potential growth factors exchange (14). Another factor of our interest was vitamin C. Many authors use the addition of L-ascorbic acid (AA) in the differentiation-in-ducing cocktails (15-17) due to its known importance in the synthesis of collagen (18). However, AA role in induction of tenogenic differentiation has not been clearly demonstrated until now. When supplementing with ascorbic acid, it is important to be aware of the labile nature of that molecule in the water environment. Standard cell culture conditions provide several-fold greater O2 concentration than in physiological conditions. Additionally, culture media usually contain transition metal ions which promote AA oxidation. These processes lead to the formation of reactive oxygen species and thus can induce an oxidative stress (19).
Based on presented background, the aim of our study was to optimize the application of vitamin C (ascorbyl derivate, with or without an addition of transferrin-con-taining supplement and including control of ascorbyl free radical formation) and low serum level (2% FBS) in a context of tenogenic differentiation of human adipose-derived stromal cells (hASCs).
Go to : 
Materials and Methods
Cells origin and ethical statements
Human adipose stromal cells derived from 3 healthy donors were kindly provided by Prof. Pojda Z., Department of Regenerative Medicine, Maria Sklodowska-Curie Natio-nal Research Institute of Oncology. Adipose tissue was collected for the routine clinical purposes (aesthetic liposuc-tion) after obtaining patient’s informed consent for the use of the leftover material for research purposes. All the procedures were approved by Institutional Review Board and were conducted in agreement with the guidelines of Helsinki Declaration.
Human adipose stromal cells culture conditions
The protocol of human adipose tissue MSCs isolation as well as identification were previously described in detail by our group (20). For growth, cells were seeded into plastic flasks at a density of 3.5×10³ cells/cm2 in standard growth medium (GM) composed of DMEM (Dulbecco’s modified Eagle’s Medium; Sigma-Aldrich) supplemented with fetal bovine serum (FBS; 15%; Sigma-Aldrich) and antibiotic–antimycotic solution (Penicillin-Streptomycin- Amphotericin; 1.5%; Sigma-Aldrich) and incubated under standard cell culture conditions (37℃, 5% CO2, 95% humidity). Cells were cultured up to passage 3, then underwent flow cytometry analysis and multilineage differentia-tion tests, the rest were cryopreserved. Refrozen hASCs from 3 donors at passages 4-5 were used in the study.
Flow cytometry analysis
Phenotype of cells at the third passage was determined with the use of Human MSCs Analysis Kit (BD Bio-sciences). The expression of positive (CD73, CD90, CD105, CD44) and negative (CD34, CD45, CD11b, CD19, HLA- DR) cell surface markers were investigated. Cells were stained following manufacturer’s instructions and analyzed using BD FACSCanto II flow cytometer equipped with BD FACSDiva Software.
Differentiation capacity test
In order to confirm capacity of isolated cells to differentiation towards bone, cartilage and fat tissue cells, tests with the use of differentiation culture media were perfor-med.
In vitro osteogenic differentiation: After reaching 70% of confluence, cells were cultured in medium containing 0.1 μM dexamethasone, 10 mM β-glycerophosphate, 50 μM AA-2P (ascorbic acid 2-phosphate) in GM with 10% FBS (all the supplements were purchased from Sigma- Aldrich). After 2 weeks cells were stained with Alizarin Red (Sigma-Aldrich) in order to visualize calcium deposits.
In vitro adipogenic differentiation: After reaching 90∼100% of confluence, cells were cultured in medium containing 0.5 μM IBMX (isobutyl methyl xanthine), 1 μM dexamethasone, 10 μg/ml insulin, 60 μM indomethacin in GM with 10% FBS (all the supplements were purcha-sed from Sigma-Aldrich). After 3 weeks cells were fixed for 10 min with 4% paraformaldehyde and stained with Oil Red O (Sigma-Aldrich) in order to visualize lipid droplets.
In vitro chondrogenic differentiation: Human ASCs suspension in GM (3×10⁵ of cells) were put into 15 ml tube and centrifuged (1500 rpm, 10 min, RT) in order to form a cell pellet. Unsuspended cell pellet was cultured for 3 weeks in chondrogenic medium composed of 1% FBS, 1% ITS (insulin-transferrin-selenium), 1% Penstrept, 10 ng/ml TGF-β2 (transforming growth factor), 0.1 mM AA-2P, 0.1 μM dexamethasone, 100 μg/ml sodium pyruvate in DMEM (all the supplements purchased from Sigma-Aldrich). Medium were changed every 3 days. For histological analysis, pellet was immersed in paraffin, sectioned and stained with Toluidin blue (Sigma-Aldrich).
Cell viability – MTT reduction test
Human ASCs were seeded onto 96-well plate (5×10³ cells per well) and cultured in standard conditions for 24 h. Then, various AA-2P concentrations (250 μM, 500 μM, 1000 μM) were applied. Non-treated cells (GM) represented negative control. Cells from 3 independent donors were used. Two independent experiments were performed, each in triplicate. Culture media were changed once (after 48 h from the beginning of the experiment). After 5 days, cell culture media from the last day of experiment were immediately frozen in a liquid nitrogen to preserve them for a next experiment described below. After collection of media, 100 μl of MTT solution (1 mg/ml MTT in GM) was added to each well. The plate was incubated for 2 h in 37℃. After that, supernatants were removed and 100 μl of DMSO was added to each well. Then, the plate was shaken for 5 min in order to mix wells contents. Quantity of formed chromatic product was assessed colorimetrically with the use of plate reader (BioTek PowerWave XS) at a wavelength 570 nm.
Semi-quantitative electron spin resonance (ESR) analysis of ascorbyl free radical (AFR)
Samples collected during the course of cell viability test (see above) were used to perform semi-quantitative ascorbyl radical assay. Within the experiment probes remained frozen, they were thawed separately just before a measure-ment. Approximately 50 μl of a sample was drawn into a capillary tube (hematocrit capillaries BLAUBRANDⓇ, intraMARK, volume 50 μl) and incubated in ESR spectrometer sample cavity for 3 min (37℃). MiniScope MS200 X-band ESR system (Magnettech) was used for spectra collection. The settings for the detection of ascorbyl radical were as follows: center field - 330.4 mT; sweep width - 6.6 mT; sweep time - 30 s; number of scans - 8; time constant - 15 ms. In order to quantify AFR concentration, spectrum of a standard (DTBN, Sigma-Aldrich) with known concentration (0.5 μM) was registered with the same experimental parameters. Spectra simulations were performed in MATLAB Software with Easy Spin toolbox (version 5.1.11) using the “garlic” function, in order to estimate the signal intensity, as the low signal- to-noise ratio made it impossible to perform direct spectrum integration. Results from “ITS” and “no ITS” group were compared with the use of Wilcoxon signed-rank test.
hASCs treatment for analysis of tenogenic differentiation
The following treatments were applied to test differentiation ability of hASCs:
500 μM AA-2P and 1% ITS (v/v) in GM (named AA- 2P)
Medium with reduced (to 2% v/v) serum content (named 2% FBS)
500 μM AA-2P and 1% ITS (v/v) in medium with reduced serum content (named AA-2P+2% FBS)
In all the experiments the same cells were cultured in parallel in standard GM and served as internal negative control (named CTRL).
Immunocytochemical analysis of SCLERAXIS (SCX) nuclear translocation– time dependent preliminary experiment
To select the optimal experiment length for subsequent analyzes we conducted a preliminary experiment, during which cells were analyzed after 3, 5 and 7 days of culture under experimental conditions. Cells from 3 donors were seeded on μclearⓇ, black 96 well culture plates (Greiner, CELLSTARⓇ), 5×10³/well. The next day, cells were exposed to above described experimental conditions: 1) AA- 2P; 2) 2% FBS; 3) AA-2P+2% FBS. Cells cultured in GM served as internal negative control (CTRL). All samples were done in 3 technical repetitions. After 3, 5 or 7 days cells were fixed with ice-cold 75% methanol (15 min., 4℃), treated with blocking solution composed of 5% normal donkey serum (NDS), 1% bovine serum albumin (BSA) and 0.3% Triton X-100 in PBS (30 min, RT) and incubated overnight at 4℃ with anti-SCLERAXIS antibody (Thermofisher Scientific, PA5-23943, 1:50) diluted in 5% NDS, 1% BSA in PBS. Then, antibodies were rinsed 3 times with PBS and incubated with secondary antibody (donkey anti-rabbit Alexa Fluor 488, Jackson Immuno-Research) at concentration 1:150 for 1 h, RT. Cells were rinsed 3 times and after that the nuclei were stained with DAPI (20 ng/ml of DAPI solution for 4 min, RT). The cells were visualized with automated imaging reader CytationTM 1 (BioTek) and analyzed with Gen5 3.04 software. Two parameters were analyzed in obtained data. Firstly, the mean translocation ratio was calculated. It constituted the ratio of mean green fluorescence in the nucleus to the mean green fluorescence in the cytoplasm in certain object (a cell). At least 500 cells were included in each sample for analysis. Additionally, the mean green fluorescence in the nuclei, which refers to the nuclear expression of SCLERAXIS was compared between groups.
Analysis of tenogenesis-related genes expression with the use of qRT-PCR
Human ASCs from 3 donors (cells from each donor treated separately) were seeded onto cell culture dishes (Ø 60 mm) in a density of 5×10³ cells/cm2 and cultured in standard conditions. After 48 h, cells were exposed to above described experimental conditions: 1) AA-2P; 2) 2% FBS; 3) AA-2P+2% FBS. The untreated cells cultured in parallel constituted internal control (CTRL). Experiments lasted 5 days, media were changed once after 48 h. Tested hASCs were then detached by scratching in RLT buffer (Qiagen) with β-mercaptoethanol and frozen in (−80℃). The next step was total RNA isolation with the use of RNeasy Mini Kit (Qiagen). The procedure was performed according to manufacturer’s instructions. RNA concentration and purity were then assessed with the use of Nano-Drop system (ND-1000 Spectrophotometer) at wavelengths 260 and 280 nm. Reverse transcription was performed using PrimeScript RT reagent Kit (Perfect Real Time) (TaKaRa Bio). cDNA template was synthesized using 850 ng of total RNA in 20 ul of reaction mixture using Oligo dt Primer and Random 6 mers according to manufacturer’s instructions. Quantitative PCR was conducted on 7500 Real-Time PCR System (Applied Biosystems, Thermo Fisher Scientific) using Premix Ex Taq (Perfect Real Time) (TaKaRa Bio). 2 ul of a 1:25 dilution of the appropriate reversed transcription reaction product served as template in real time qPCR. The following primers were used (all purchased from Applied Biosystems): collagen, type I, alpha 1 (COL1) Hs00164004_m1, collagen, type III, alpha 1 (COL3) Hs00943809_m1, scleraxis (SCX) Hs03054634_g1, mohawk homeobox (MKX) Hs00543190_ m1, decorin (DCN) Hs00370385_m1, Glyceraldehyde 3- phosphate dehydrogenase (GAPDH) (4333764 T) gene served as a reference gene. Each cDNA sample from each donor was analyzed for all the genes in two independent rounds. Amplification efficiency for each primer was determined using a standard curve determined by a series of five-fold dilutions of pooled cDNA from all analyzed samples. Relative gene expression changes were calculated with the use of 2ΔΔCt method, where dCt was calculated as CtREF - CtGOI and ddCt as dCtTREATED - dCtCTRL. For statistical analysis ddCT values were used.
Analysis of tenogenesis-related proteins synthesis changes with the use of western blot (WB)
Human ASCs (cells from each donor treated separately) were seeded onto cell culture dishes (Ø 100 mm) in a density of 5×10³ cells/cm2 and cultured in standard conditions. After 48 h, cells were exposed to the experimental conditions: 1) AA-2P; 2) 2% FBS; 3) AA-2P/2% FBS. Negative internal control (CTRL) was included for cells from each donor. Experiments lasted 5 days, media were changed once after 48 h. Cells from 3 donors were used in the analysis. Tested hASCs were then detached mechanically and centrifuged (3000 rpm, 5 min, 20℃). The next step was the isolation of total protein using RIPA lysis buffer supplemented with protease and phosphatase inhibitor cocktails (all the components purchased from Sigma- Aldrich). Lysis was conducted for 30 min at 4℃. Suspen-sion was then centrifuged (10,000 g, 20 min, 4℃) and supernatant containing proteins was collected. Total protein concentration was assessed colorimetrically using Bio-Rad protein assay dye reagent according to the producer’s instructions (Bio Rad Laboratories Inc). Reading was performed at a wavelength 595 nm with the use of plate reader BioTek PowerWave XS. Proteins (35 μg per well) were resolved by SDS-PAGE and transferred onto PVDF membrane. Membranes were blocked for 1 h with 5% non-fat dry milk in TBS (20 mM Tris-HCl, 500 mM NaCl) containing 0.5% Tween 20. Primary antibodies: rabbit polyclonal anti-collagen I antibody (Abcam, ab34710, 1:500), rabbit polyclonal anti-collagen III antibody (Abcam, ab7778, 1:500), rabbit polyclonal anti-mohawk antibody (LSBio, aa46-75, 1:1000), rabbit polyclonal anti-scleraxis antibody (Thermofisher Scientific, PA5-23943, 1:1000) or rabbit monoclonal anti-β-actin antibody (Santa Cruz Biotechnology, sc-47778, 1:1000) were added for overnight incubation at 4℃. After that, blots were washed with TBST (3×10 min) and incubated (1 h, RT) with appropriate secondary antibodies conjugated with IR fluorochromes: IRDye 680RD or IRDye 800CW (Li-COR Biosciences) at 1:5000 dilution. The protein synthesis was analyzed using ChemiDoc MP Imaging System (Bio- Rad Laboratories Inc.) and the integrated optical density (IOD) was quantified in relation to β-actin IOD with the Image Lab Software (Bio-Rad Laboratories Inc). Samples from each donor were processed independently at least 3 times.
Immunocytochemical evaluation (ICC) of collagens expression and semi-quantitative microphotographs analysis
Cells were seeded on NuncTM Lab-TekTM II CC2TM 8-Chamber Slide System and after 24 h cultured for 5 days with or without an addition of 500 μM AA-2P and 1% ITS. Cells from 2 donors were used in this part of the study. After the treatment, cells were fixed with 4% paraformaldehyde (10 min, RT), permeabilized with 70% methanol (15 min, −20℃), treated with blocking solution composed of 5% normal donkey serum (NDS), 1% bovine serum albumin (BSA) and 0.3% Triton X-100 in PBS (30 min, RT) and incubated overnight on a vortex mixer at 4℃ with 2 primary antibodies solution (antibodies dissolved in 5% NDS, 1% BSA in PBS): goat polyclonal anti-actin antibody (Santa Cruz, C-11, sc1615, 1:50) and rabbit polyclonal anti-collagen I antibody (Abcam, ab34710, 1:300) or rabbit polyclonal anti-collagen III antibody (Abcam, ab7778, 1:150). After incubation, antibodies were rinsed with PBS (3×15 min). Cells were then incubated with 2 appropriate secondary antibodies conjugated with fluorochromes (Alexa Fluor 594 and Alexa Fluor 647, Jackson ImmunoResearch) at concentration 1:150 for 1 h RT. Antibodies were rinsed with PBS (3×15 min) and after that the nuclei were stained with DAPI (20 ng/ml of DAPI solution for 4 min, RT). At the end, DAPI solution was rinsed with PBS (3×5 min) and the slide was preserved. In parallel, each step was performed for a control slide (control of slide and cells autofluorescense and non-specific secondary antibody binding). Images were obtained with confocal microscope Olympus Fluoview FV1000 with FV10-ASW 3.1. imaging software and captured with 10x objective. Image acquisition was divided into 2 modules: 1) analysis of total collagen; 2) analysis of extracellular collagen. Modules differed only with parameter settings applied for detection of collagen immunostaining signal with higher sensitivity of signal detection applied for extracellular collagen staining. Signal detection parameters were established at the beginning of experiment and remained constant. For each of 8 parts of slide, 6 fields of view (possibly next to each other) with relative mean cell density were collected. Focus plane was set every time using actin staining signal on detector for actin. For each field, 2 images (one for each experiment module) were collected (first one with higher sensitivity of detection). In the first module, fluorescence signal from DAPI was also collected. In order to define cell borders in the second module, images of actin were additionally collected. On the beginning and after experiment, images from the control slide were collected using parameters for both modules. Images processing was performed with the use of ImageJ software (21). Images were analyzed in 16-bit space. Threshold value of actin fluorescence for cell border defining was determined empirically and remained constant for all the images. Extracellular area defined with the use of actin image was marked as a region of interest (ROI) and put onto collagen image. Values of mean fluorescence per cell for total and extracellular collagen were collected and analyzed statistically with the use of Mann- Whitney U test. It was assumed that this parameter reflects linearly the quantity of collagen distributed intracellularly and on the plate. Calculations were performed for each type of collagen separately. Fluorescence values of the control slide were considered.
Statistical analysis
All the statistical analyzes were conducted using STATISTICA software (StatSoftⓇ-Polska). Due to the size of the samples and the need to reject the null hypothesis of the origin of analyzed data from a normal distribution (based on Shapiro-Wilk test) we performed nonparametric tests for almost all the analyzes. The groups of paired two-sample data were analyzed by Wilcoxon matched- pairs signed-ranks test. For the analysis of not-related data U Mann-Whitney test was used. Student’s t test was used to compare groups with confirmed normal distribution. Significance was set at p<0.05 and graphs are presented as mean±standard error of the mean (SEM).
RT-PCR data were analyzed in 2 step protocol. Firstly, comparison was perform to evaluate if there are significant differences between treatment and control groups. The control group constituted untreated cells from the same donors. The control group was not subject to any treatment (e.g. administration of PBS instead of the agent), hence the one-sample Student’s t-test was performed on dCt differences (confirmed normal distribution) obtained by subrtaction dCttreated-dCtcontrol. In the second part of the analysis only the effect of individual treatment on gene expression was compared with each other on groups created by subtraction dCtTREATED - dCtCTRL:
ΔΔ AA-2P= dCt [AA-2P]- dCt[CTRL]
ΔΔ 2% FBS= dCt [2% FBS]- dCt[CTRL]
ΔΔ AA-2P+2%FBS= dCt [AA-2P+2% FBS]- dCt[CTRL]
One way ANOVA was used for such a comparison (p<0.05). Bonferroni post-hoc test was performed for the detected differences with a changed significance level of αcritical=0.017, including the accumulation of the 1st type error in multiple comparisons. If the assumption about homogeneity of variance was not met (MOHAWK), Kruskal- Wallis test was performed. Additionally, size effects were calculated as Cohen’s d for repeated measures taking into account the correlation between the paired groups using online calculator (https://www.psychometrica.de/effect_size.html).
Go to :
Results
Isolated cells displayed basic MSCs features: fibroblast-like morphology, adherence to culture vessel and multipotency that was confirmed by specific staining (representative microphotographs from differentiation tests are presented in Fig. 1. Flow cytometry analysis proved the expression of surface antigens: CD90, CD105, CD73, CD44 and no expression of mix of markers for hematopoietic cell lines (phenotype of averagely 97.6±0.88% of tested cells).
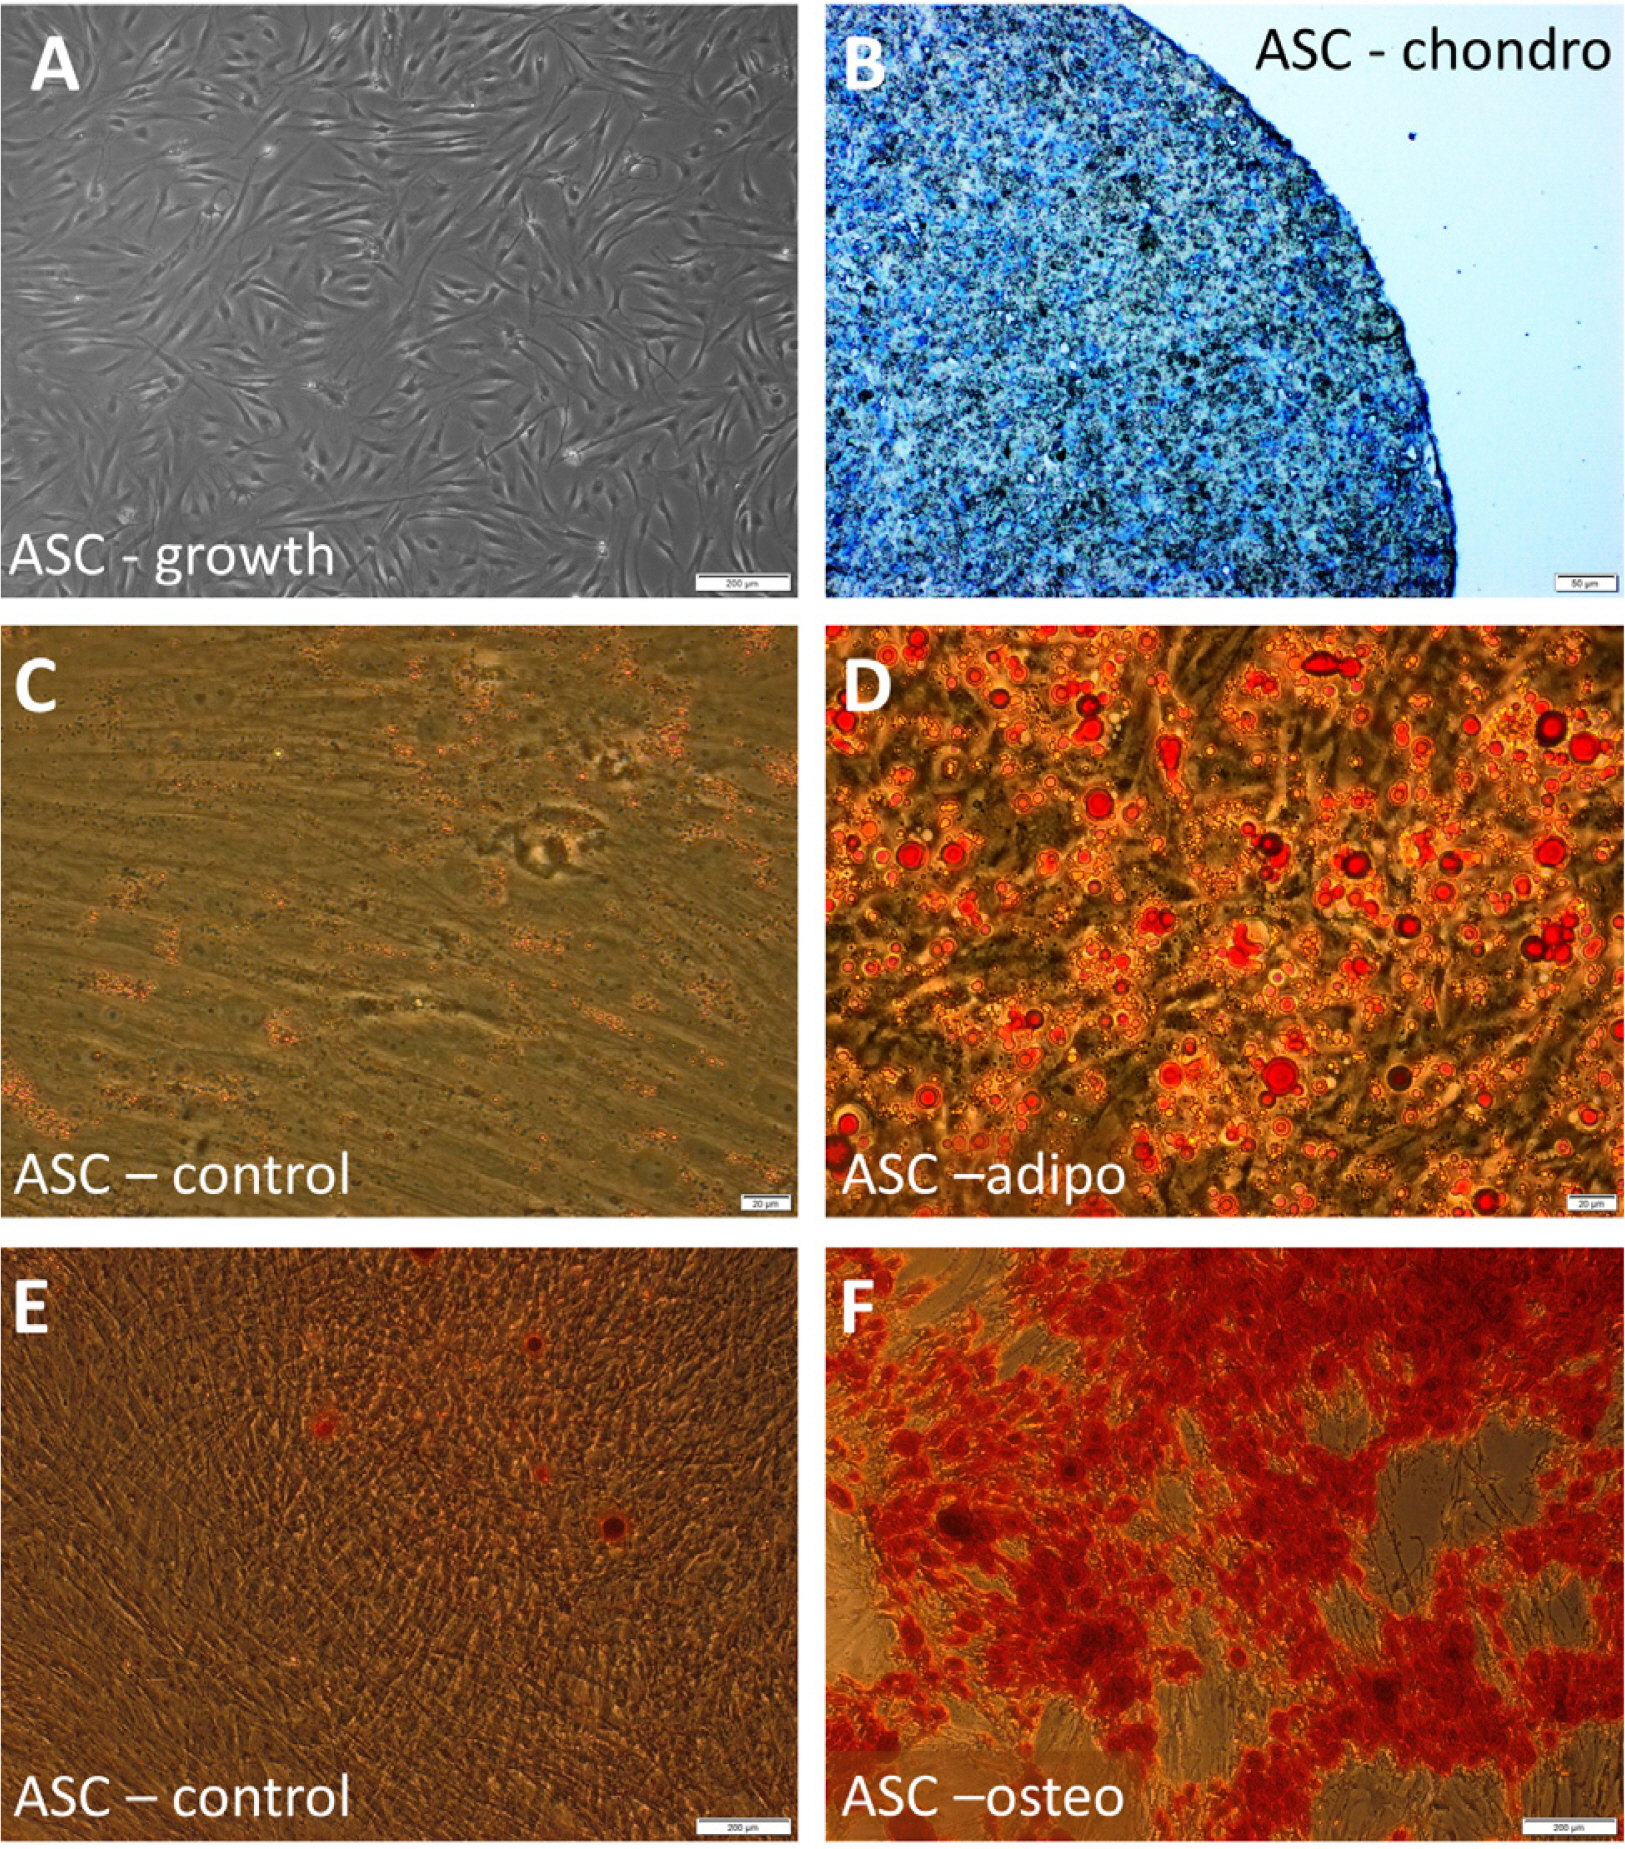 | Fig. 1Morphology and differentiation potential of investigated cells. (A) morphology of untreated hASCs; (B) hASCs after chondrogenic differentiation, chondropellet stained with Toluidin blue; (C, D) Oil Red O staining of hASCs cultured in a standard (C) or adipogenic medium (D) (visible fat droplets stained in red); (E, F) Alizarin Red S staining of hASCs cultured in a standard (E) or osteogenic medium (F) (visible red calcium deposits). Scale bars: 200 μm (A, E, F); 50 μm (B); 20 μm (C, D).
|
The effect of AA-2P with or without ITS on hASCs viability
Each concentration starting from 500 μM of AA-2P used in this study caused a statistically significant increase of a relative cell viability (Fig. 2A). Moreover, the additional treatment with 1% ITS (v/v) resulted in a further increase in cell viability in each tested concentration compared to the corresponding cells cultured without the addition of ITS (Fig. 2A). Comparing ITS positive and negative group (n=30), the difference was significant with p=0.019. Considering results from above mentioned MTT tests and literature data, 500 μM with 1% ITS was chosen as a most optimal combination.
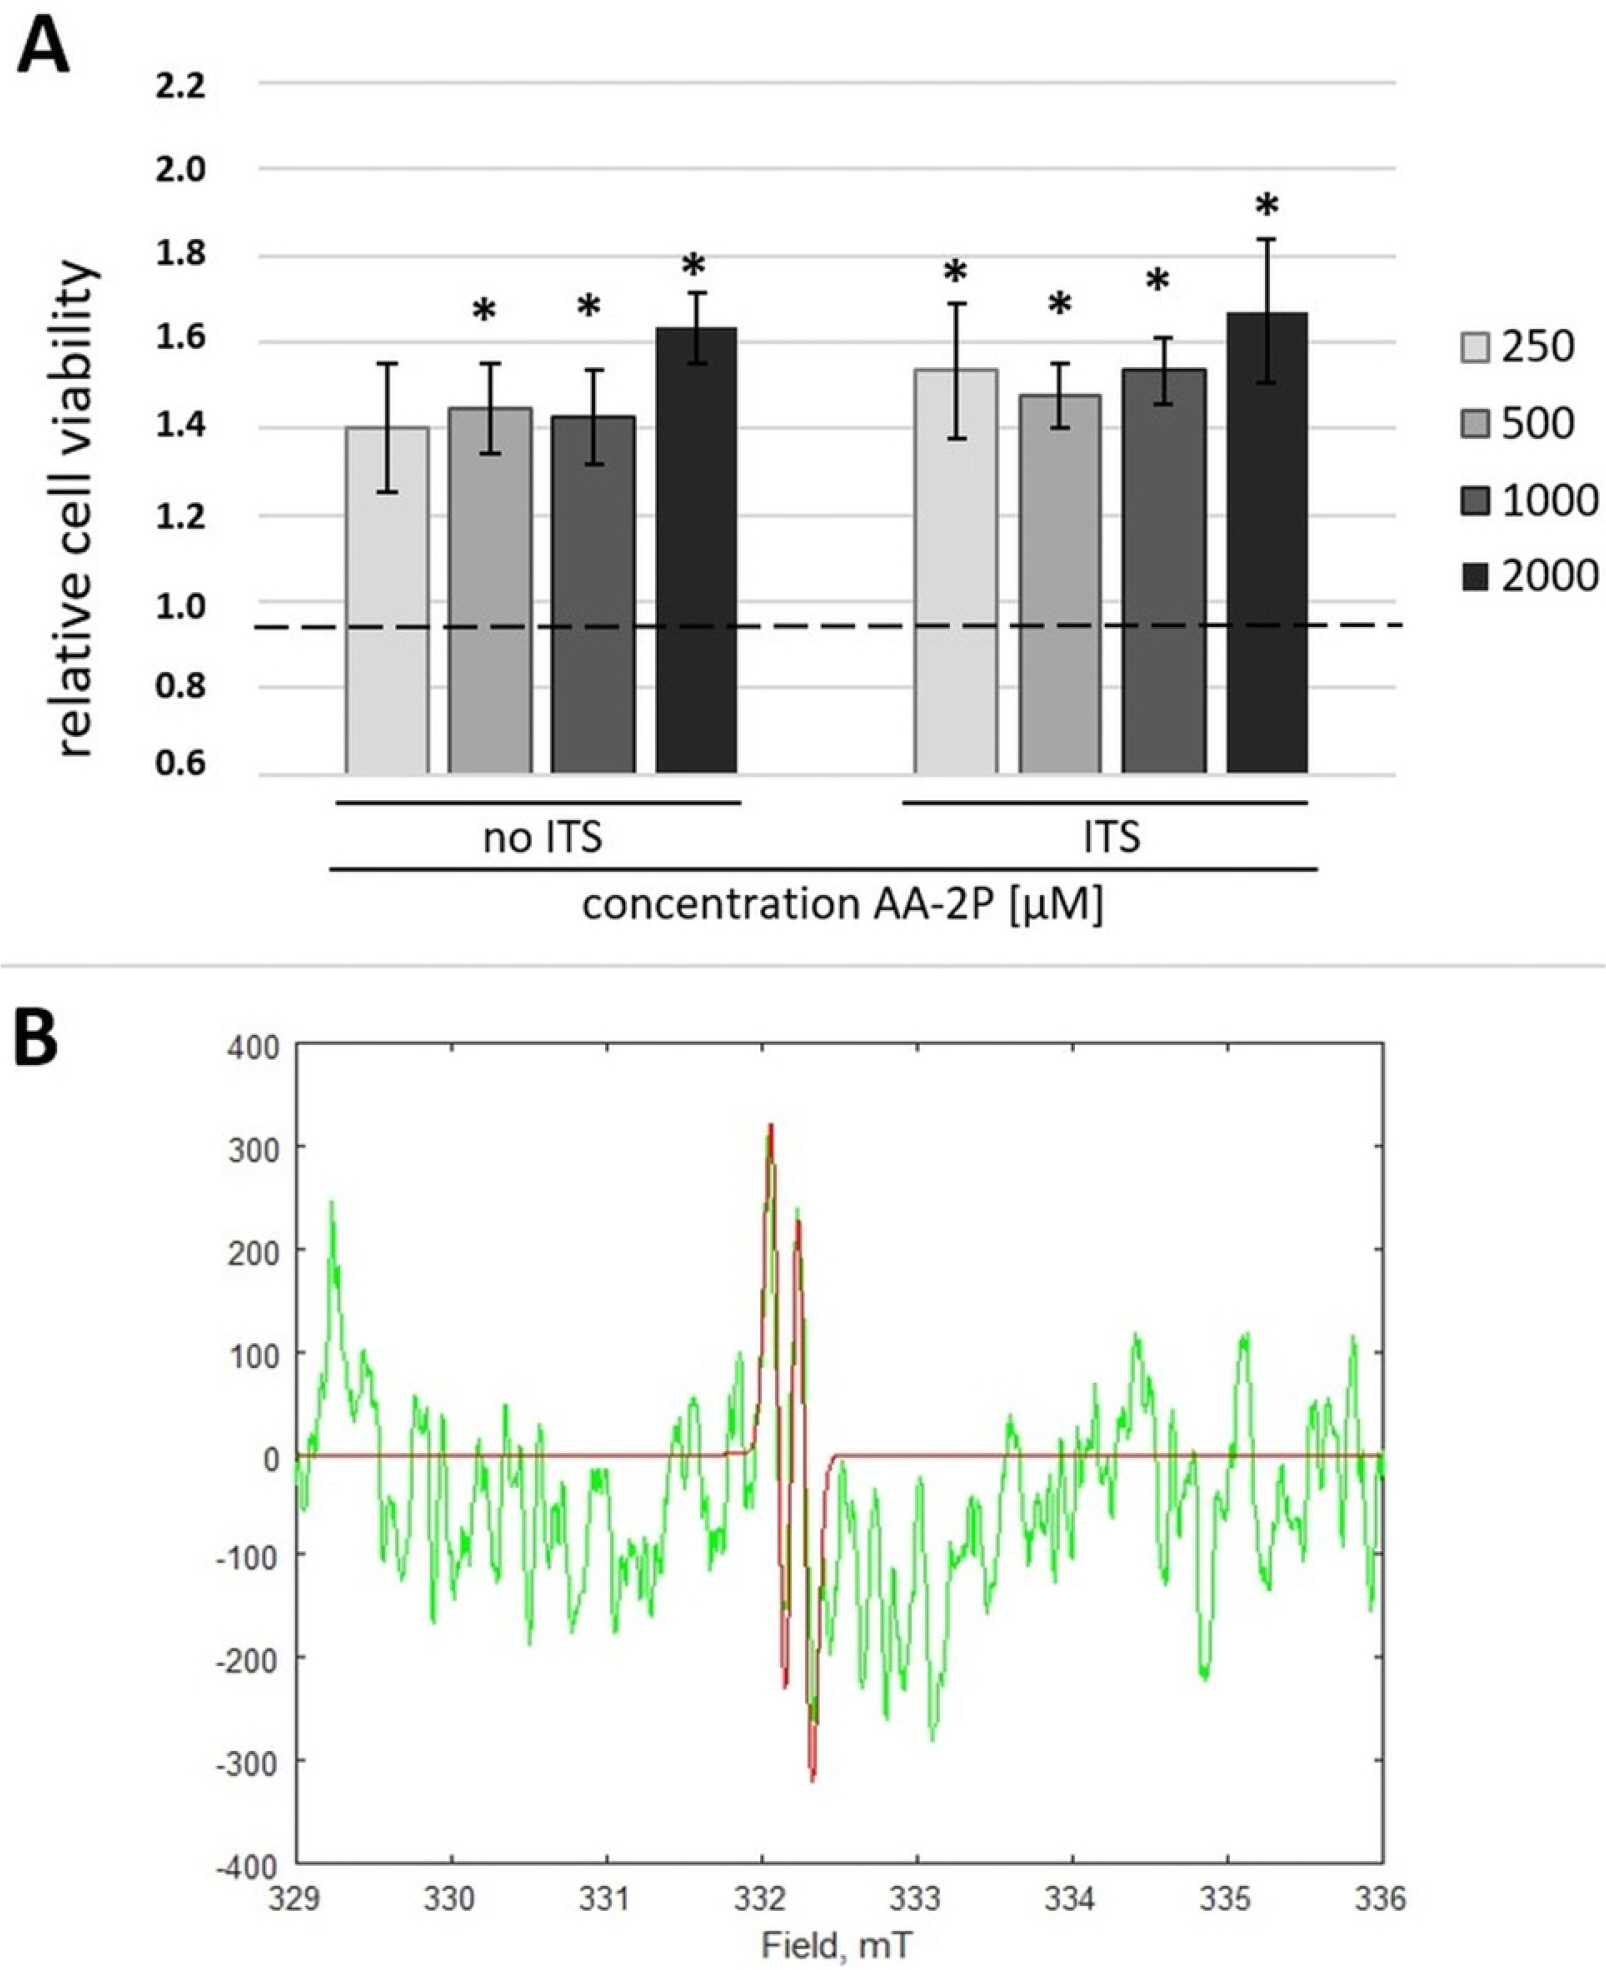 | Fig. 2The effect of ascorbic derivatives on adipose stromal cells (ASCs). (A) MTT test. The effect of L-ascorbic acid-2-phosphate (AA-2P) with or without insulin-transferrin-selenium (ITS) supplementation on hASCs. *p<0.05 in comparison to untreated control (Wilcoxon test); (B) Electron Spin Resonance (ESR). In green – representative experimental ESR spectrum for ascorbyl free radicals (AFR) generated directly from a cell supernatant sample. In red – computer spectral simulation of AFR signal (aH=0.18 mT) enabling quantification of the signal intensity.
|
ITS addition does not affect AFR formation
Spectra were successfully collected and a signal of ascorbyl radical was identified with the use of available data (g=2.0054, aH=0.188 mT) (22). An exemplary spectrum is presented in Fig. 2B. AFR concentration in control, 250μM AA-2P and 500 μM AA-2P groups were mostly under detection limit (10 nM). The concentration estimation was performed for 1000 μM AA-2P and 2000 μM AA-2P groups only. AFR mean concentrations were lower in “ITS” comparing to “no ITS” group (15.9±0.50 nM vs. 18.5±0.71 nM in 1000 μM AA-2P group and 19.4±0.93 nM vs. 20.6±1.37 nM in 2000 μM AA-2P group), but no statistical significance was observed (p=0.4102). Percent of AA-2P oxidation to AFR was higher in 1000 μM AA-2P group than in 2000 μM AA-2P group (0.0017% vs. 0.0010%).
Day 5 selected as the optimal time point for of tenogenic differentiation analysis
Immunocytochemical analysis of SCLERAXIS, tenogenesis-associated transcription factor, showed that hASCs cultured in growth medium displayed higher expression of this protein in the nuclei than in the cytoplasm - the mean translocation ratio (MTR) was 2.65, indicating that this transcription factor is active even in untreated hASC. However, the MTR increased in AA-2P treated cells as well as in AA-2P+2% FBS conditions in comparison to control cells. This increase was statistically significant for both treatments already in the 3rd day of experiment, but in AA-2P+2% FBS group the translocation ratio was further increased on the 5th day of experiment (p<0.05, Fig. 3A). There was no further increase noticed in the 7th day of the experiment. Additionally, the mean green fluorescence was evaluated in this experiment. This value corresponds with the expression of active form of SCX. The intensity of green fluorescence in nuclei increased significantly after 3 days of treatment with AA-2P and AA-2P+2% FBS in comparison to control cells. The increase was sustained on the 5th day of experiment but on the 7th day, the nuclear SCX expression was no longer higher in AA-2P+2% FBS group than in the control cells (Fig. 3B). These results indicate that under the above described experimental conditions, the fifth day is the optimal time point for the analysis of tenogenic differentiation in hASCs.
 | Fig. 3The dynamics of hASC response to AA-2P treatment with or without reduced serum level evaluated by immunocytochemical method. (A) The mean translocation ratio (MTR) of SCLERAXIS analyzed in hASCs at day 3, 5 and 7 of treatment. The factor calculated as the ratio of mean green fluorescence in the nucleus to the mean green fluorescence in the cytoplasm in certain object (a cell) which indicates activation of the transcription factor in response to experimental treatment; (B) The graphs represent mean green fluorescence in the nuclei, which refers to the nuclear expression of SCLERAXIS. hASCs from 3 donors were used in the experiments. Data analyzed by Student’s t-test for relative samples. *p<0.05 for the comparison of treated cells to control, untreated cells; #p<0.05 the comparison of cells in the same experimental conditions between different time points. Abbreviations: GM - untreated internal control samples cultured in growth medium analyzed in respective time points, AA-2P- ascorbic acid 2-phosphate treatment; 2% FBS- cells cultivated with decreased serum level; AA-2P+2%FBS- treatment with combination of two factors; (C) representative pictures of cells from one donor, 5th day of treatment. Different rows present the same fields of view - cells in various experimental conditions. SCLERAXIS stained in green, nuclei stained in blue.
|
Tested agents activate tenogenic pathway in hASCs to a different extent
Tenogenic differentiation in response to tested agents was evaluated based on the expression changes of tenocyte-lineage markers at both mRNA and protein levels. Culturing hASCs with reduced serum resulted in a statistically significant change only for SCX (mean 1.58-fold increase in comparison to control, p=0.036). Comparing to the untreated control AA-2P treatment led to increased gene expression of all analyzed ECM related genes. For COL1 it was 2.01-fold change, p=0.001, effect size Cohen’s d for Repeated Measures, (dRM)=2.76, for COL3 it was 2.7-fold increase, p=0.0003, Cohen’s dRM=5.58 and for DCN – 1.8-fold change, p=0.004, Cohen’s dRM=5.72. Moreover AA-2P addition affected expression of genes encoding analyzed transcription factors: SCX – 1.68-fold, p=0.01, Cohen’s dRM=1.78, whereas MKX was decreased and mean expression in AA-2P group amounted 0.32 of a control value, p<0.001, Cohen’s dRM=4.20. The culture of hASCs in reduced serum with addition of AA-2P resulted in a statistically significant increase of all analyzed genes expression in comparison to the control cells cultured in GM: SCX – 1.95-fold, p=0.03, MKX – 3.15-fold, COL1 – 3.43-fold, COL3 – 6.92 fold and DCN – 10.81-fold, for all genes p<0.001, Cohen’s dRM >7 and for SCX >1 (Fig. 4).
 | Fig. 4The treatment with AA-2P and/or reduced serum level affects the process that regulates the expression of genes associated with tenogenesis. Gene expression determined by RT-PCR and calculated using the 2ΔΔCt method. Results presented as fold change with 95% confidence interval in relation to the untreated internal control samples (cells from the same donor cultured in parallel in GM) which value was taken as=1. Y axis presented in log scale; Statistical analysis was performed by comparison of ddCt values in 2 step protocol: 1) by one-sample Student’s t-test, comparison of means obtained by subtraction Ct[treated]-Ct[control]; n=6 for each group, *p<0.05; 2) comparison of treatment effect between groups by one way ANOVA for differences [(AA-2P)-CTRL] vs [(2% FBS)-CTRL] vs [ (AA-2P+2% FBS)-CTRL], letters A, B and C above bars indicate statistical differences: groups sharing the same letter do not differ significantly (p<0.017, n=6 for each group); CTRL-untreated control; AA-2P- ascorbic acid 2-phosphate treatment; 2% FBS- cells cultivated with decreased serum level; AA-2P+2%FBS- treatment with combination of two factors; SCX- SCLERAXIS; MKX- MOHAWK HOMEOBOX; COL1- COLLAGEN, type I, alpha 1; COL3- COLLAGEN, type III, alpha 1; DCN- DECORIN.
|
Comparing the effects of the treatments with ANOVA, a statistically significant difference between the treatment effects was demonstrated for MKX (p=0.0003) between AA-2P (resulting in decreased expression) and AA-2P+2% FBS (increased expression). Similarly, the effects differences were significant for DCN expression (p=0.000002) although here both treatments resulted in increased gene expression. In addition, for the DCN the effect caused by serum reduction only also differs significantly from that caused by combining factors (p=0.000002). In the case of COL1 and COL 3 all treatment effects differed significantly (p<0.005) from each other (Fig. 4).
The analysis of protein expression using Western blot method demonstrated that serum reduction induced an increase of MKX synthesis in hASCs comparing to control (1.77-fold, p=0.002). The combination of 2% FBS and AA-2P caused a similar change in MKX expression in comparison to the control (1.53-fold, p=0.004). The treatment with AA-2P only did not result in a significant change in MKX synthesis (Fig. 5). In regard to SCX expression, the most prominent change was noticed in cells exposed to AA-2P - this treatment caused 5.3-fold increase in expression of this transcription factor (p=0.00006) in comparison to control. The combination of reduced serum and AA-2P treatment also induced significant increase in SCX synthesis, but the difference was less prominent (1.77-fold in comparison to control, p=0.004). The production of COL1 analyzed by Western blot was decreased in cells cultured in reduced serum and in the combination of tested factors (AA-2P+2% FBS) and amounted 60% and 69% of control values, respectively (p<0.01 for both groups). The synthesis of COL3 was significantly decreased in cells from all the treatments in comparison to control – it amounted 82%, 60% and 68% of control values for AA-2P, 2% FBS and AA2P+2% FBS groups, respectively; (p<0.01 for all groups) (Fig. 5).
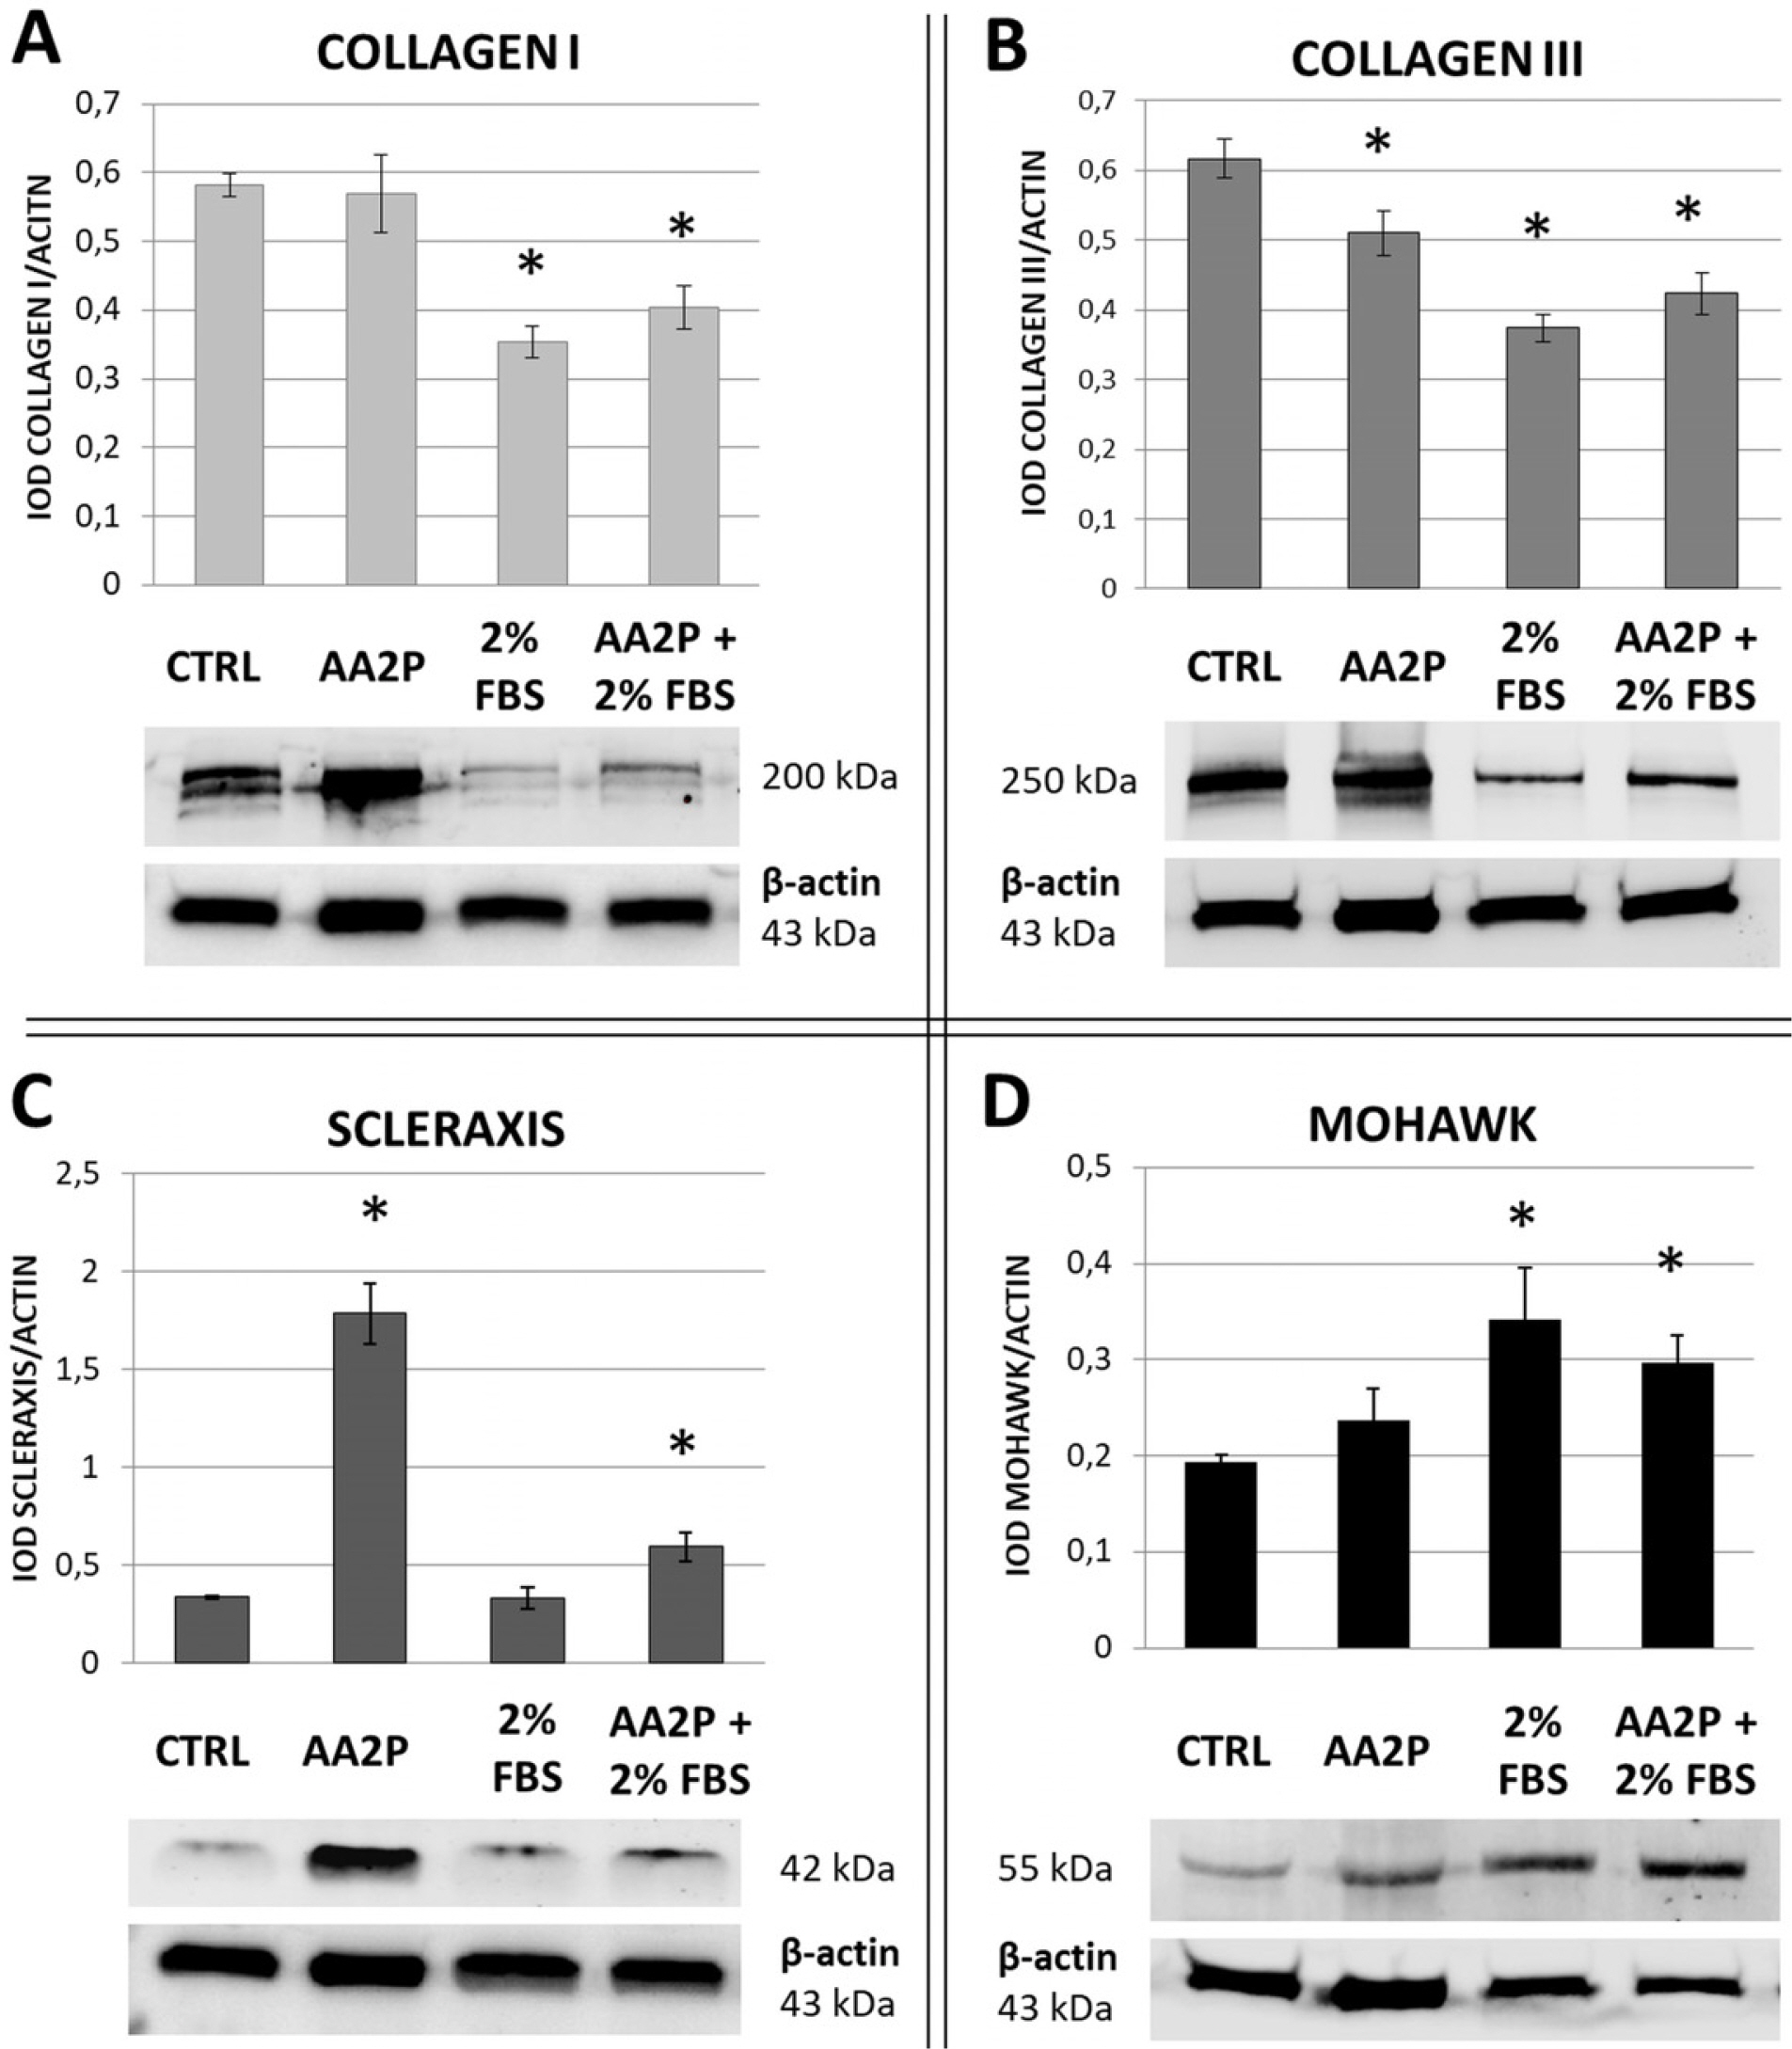 | Fig. 5The effect of serum reduction and ascorbic acid 2-phosphate (AA- 2P) treatment on tenogenesis-related proteins synthesis in adipose stromal cells (ASCs). Western Blot analysis. β-actin was used as a reference protein. hASCs from 3 donors were used in the experiment. At least 3 repetitions were performed for each donor and each treatment. *p<0.05 in comparison to control, untreated cells (Wilcoxon test). CTRL-untreated control; AA-2P- ascorbic acid 2-phosphate treatment; 2% FBS- cells cultivated with decreased serum level; AA-2P+2%FBS- treatment with combination of two factors.
|
AA-2P treatment impacts extracellular distribution of collagen and total collagen production
Each of investigated cell populations displayed COLLAGEN I and III expression. Analysis of collagen distribution was reasoned by results from WB study indicating changes of collagen synthesis in response to applied treatments. Exemplary set of images used for analysis is presented in Fig. 6. Significance of changes between AA-2P and the control group (regardless of a donor) was assessed with the use of U-Mann Whitney’s test. All the changes are statistically significant (p=0.0001 for extracellular COLLAGEN I, p=0.0023 for extracellular COLLAGEN III, p=0.0077 for total COLLAGEN I, p=0.0086 for total COLLAGEN III, Fig. 7). Extracellular collagen distributed on a plate remained invisible in most of the microphotographs. Although, distribution of vesicular collagen and fibrillar collagen was possible to observe within cell area (fibrillar collagen at the cell boundaries).
 | Fig. 6Imaging analysis of type I and type III collagen production by adipose stromal cells treated with ascorbic acid 2-phosphate. Immunocytoche-mistry. The synthesis of COLLAGEN I (A) and COLLAGEN III (B) in hASCs cultured in standard medium (upper panels) or in medium supplemented with 500 μM AA-2P+1% ITS (lower panels). Cell nuclei were stained with DAPI. All images in one raw represent the same field of view. White arrows – intracellular collagen, blue arrows – extracellular collagen. Objective 10×, scale bar – 100 μm (applies to images from the figure).
|
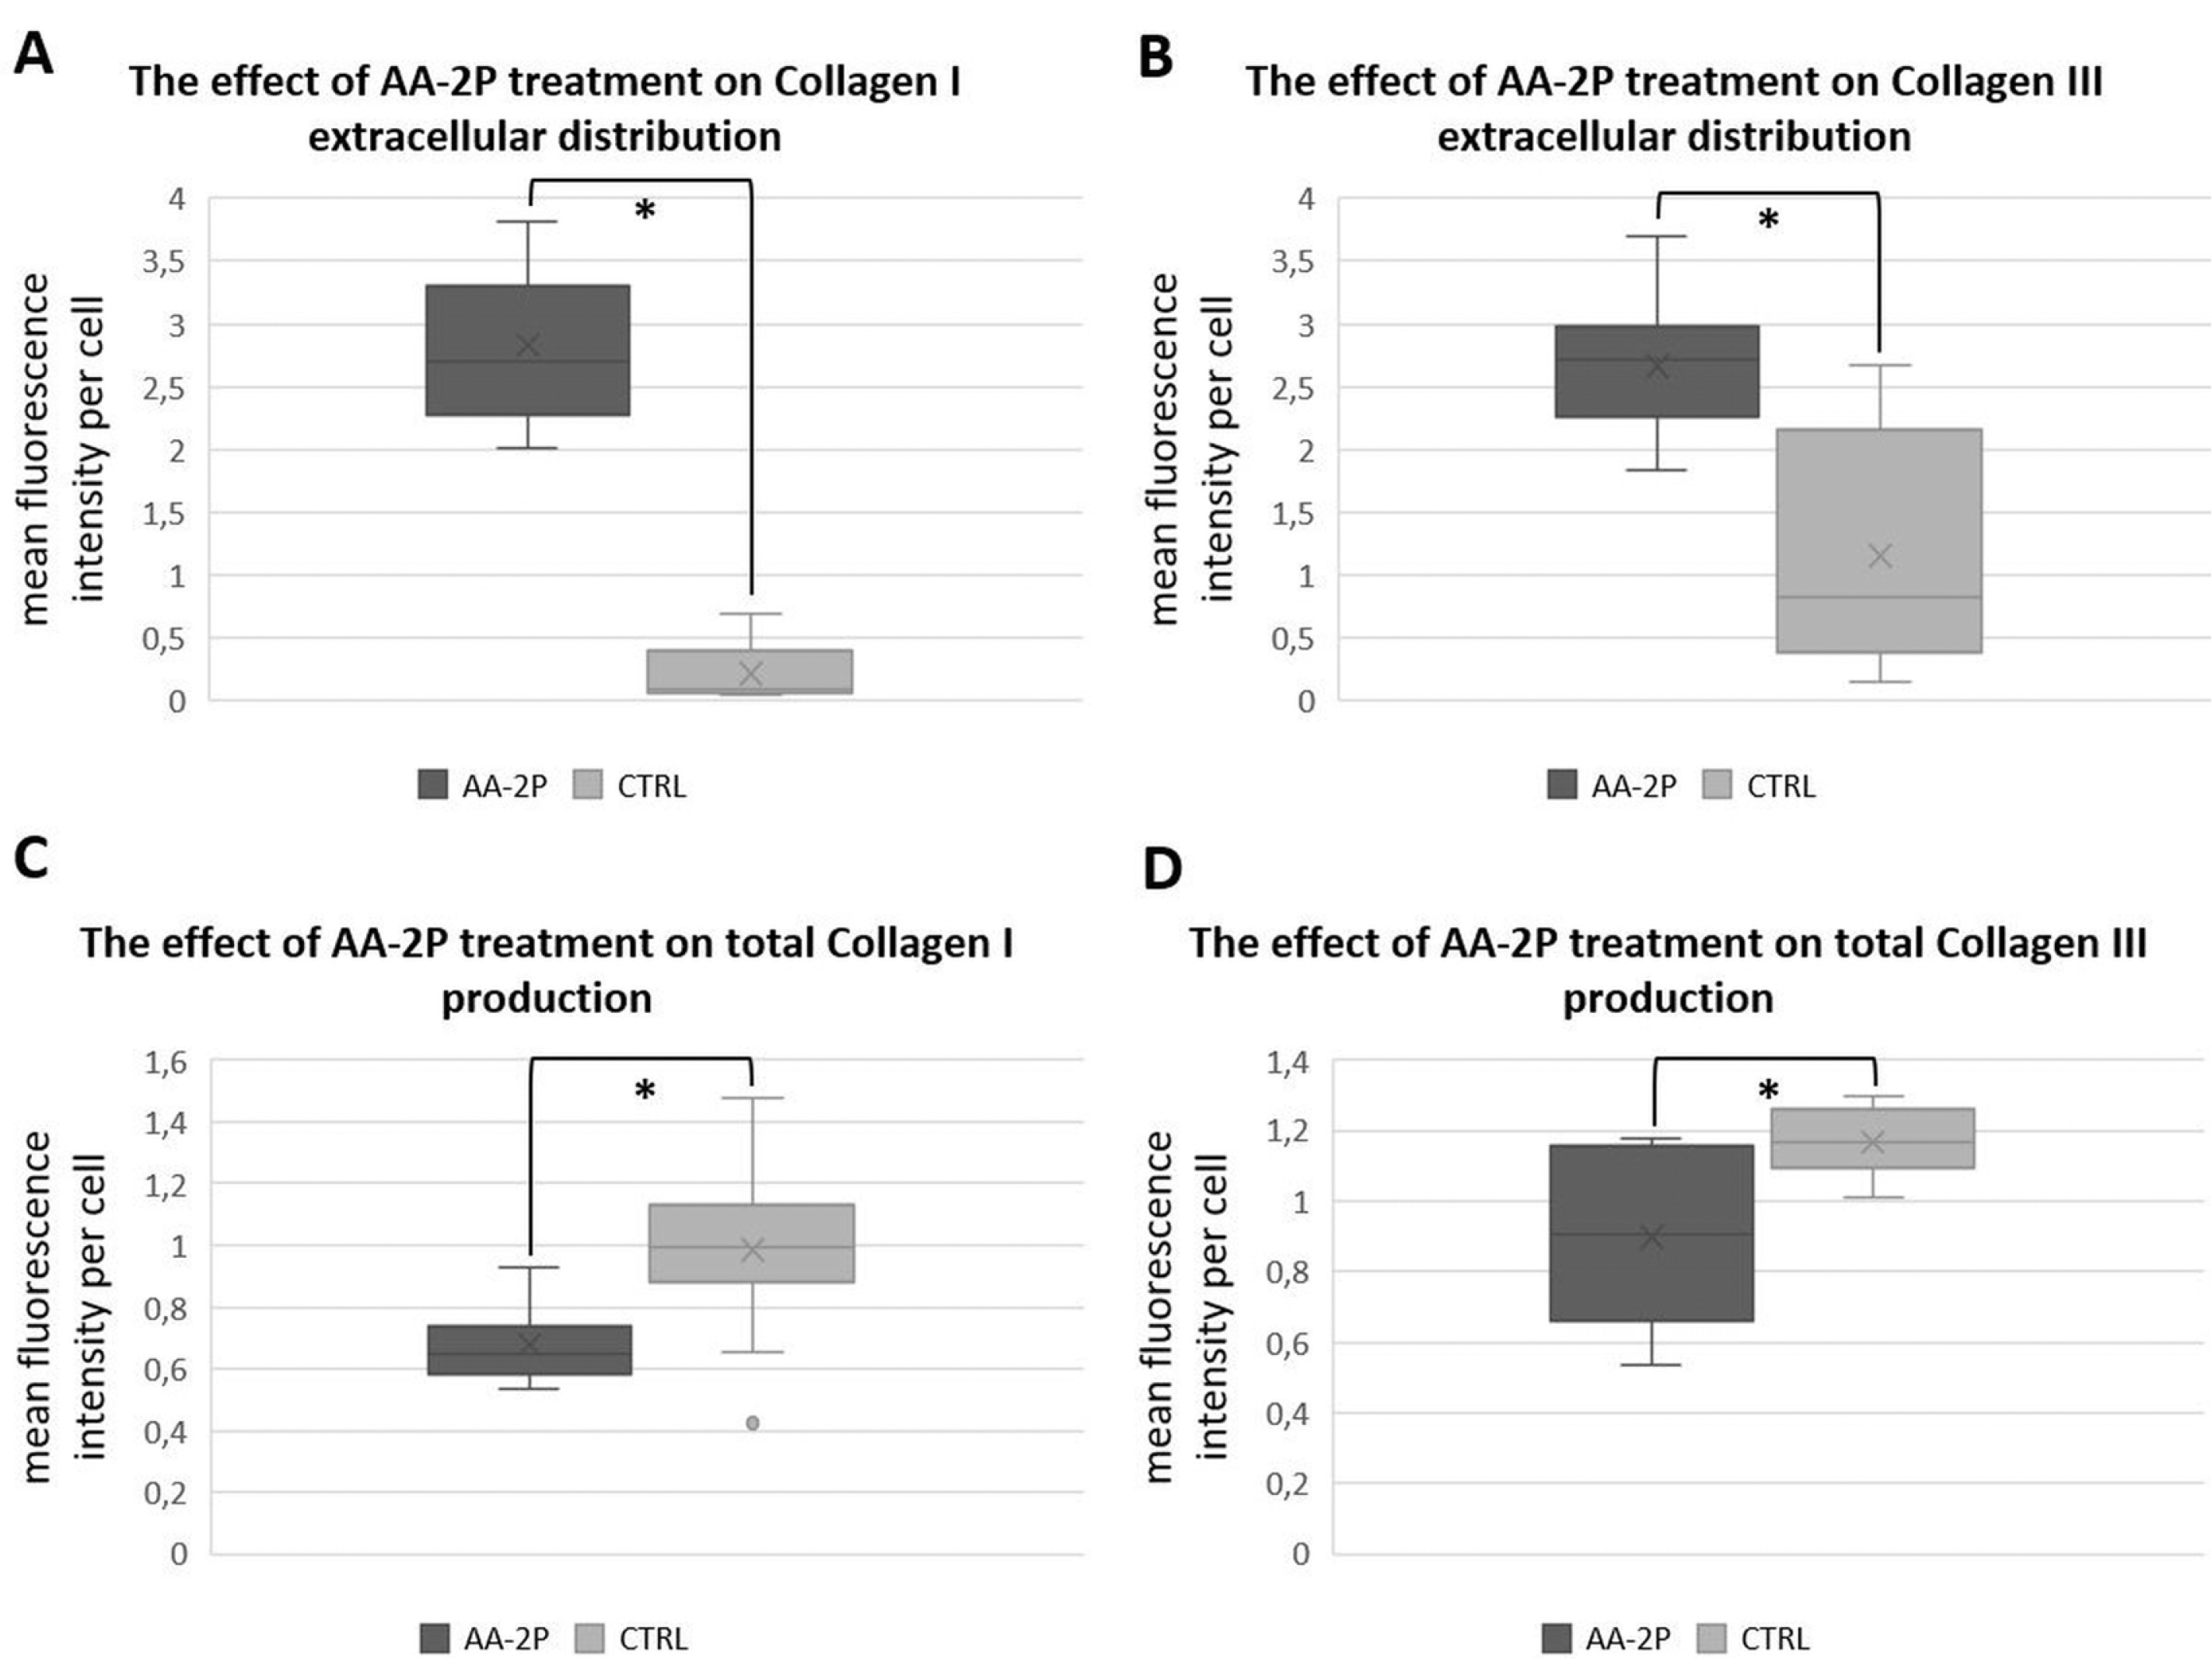 | Fig. 7The effect of ascorbic acid 2-phosphate (AA-2P) on the collagens distribution in adipose stromal cells. Relative quantity of extracellularly distributed COLLAGEN type I (A) and type III (B) and total COLLAGEN type I (C) and type III (D) depending on addition of AA-2P+ITS to culture media. Data presented as a five-number summary (minimum, first quartile, median, third quartile and maximum). “x” – mean value. *p<0.05 (U-Mann-Whitney test).
|
Go to :
Discussion
The main objective of the presented study was to investigate the effects of ascorbic acid supplementation and/or serum reduction on the adipose-derived MSCs in terms of tenogenesis. Although AA derivatives are common supplements in tenogenic media (23, 24) and serum reduction has already been used while tenogenic differentiation (17, 25), the effect of either ascorbate or serum reduction alone on tenogenic hASCs differentiation has not been demonstrated until now.
Additionally, although vitamin C or its derivatives are among the most commonly used media supplements, there is little data on the effect of their addition to the cell culture on the ascorbyl free radical production, reflecting changes in redox balance.
Firstly, we confirmed that the addition of AA-2P (L-ascorbic acid 2-phosphate) increases the cell viability (Fig. 2A). An addition of 1% (v/v) ITS (insulin-transferrin-se-lenium) in combination with various concentrations of AA-2P (250, 500, 1000, 2000 μM) to the standard growth medium resulted in a significant increase in cell viability in each treated group (ITS vs. no ITS, p=0.019). In a such created experiment, it is not possible to indicate which component of ITS supplement influenced a cell viability. We aimed to introduce a defined quantity of transferrin to an environment of ascorbate-treated ASCs since we assumed that the trace amount of this protein coming from FBS could be not enough to prevent potentially harmful redox reactions. The limitation of this part of the study was the use of composite supplement, not the protein of interest separately. Our attempts to investigate a percentage of AA reduction was also limited by detection limit of AFR (about 10 nM). All the obtained AFR spectra were marked by a low signal/noise ratio and demanded simulation of AFR signal to perform semi-quantitative analysis. Quantitative assays of AFR production in biological systems with the use of ESR spectroscopy always involve the problem of low radical quantity (22, 26). In order to minimize not beneficial redox reactions, we avoided too long exposure of plates treated with AA-2P to atmosphere out of incubator (the increase of pH value promotes AA auto-oxidation (19). Since the growth medium used did not contain AA, the identified AFR is an oxidation product of AA-2P added to culture medium. It is commonly believed that L-ascorbic acid derivatization increases the molecule stability (27), what we confirmed herein in this study. Blocking of the oxygen at position 2 in an AA molecule does not prevent redox reactions, however, less than 0.01% of AA-2P introduced to cell culture undergoes oxidation. In our study, we consider it as an adequate protection from the harmful trace metals-driven redox reactions.
The main objective of the study was to evaluate if serum reduction with or without L-ascorbic acid supplementation can induce tenogenic differentiation of human ASCs. It is important to stress that it is difficult to clearly state if a cell (especially in 2D culture) is already a tenocyte or not. There is no unequivocal method to recognize completed tenogenic differentiation. Moreover, we have previously demonstrated that proteins which are considered to be tenogenic markers are expressed by undifferentiated MSCs (28). Therefore, an evaluation of tenogenesis in the present study based on relative changes in set of molecules expression/synthesis. Although ascorbic acid is proposed as a supplement to tenogenic differentiation media even in most recent reports (16, 17), the specific tenogenic effect of this supplement on human mesenchymal stromal cells has not been previously confirmed. Kang et al. (29) conducted an experiment on mice with induced tendonitis, investigating therapeutic efficiency of local injected ASCs suspension, vitamin C supplementation and the both factors. The groups to whom ascorbic acid was administered, exhibited better tissue morphological recovery and less neovascularization and swelling as well. Histopathological analysis proved that combination of both tested agents gives the most beneficial results (29). Sassoon et al. (30) performed differentiation of BMSCs towards tendon cells with the use of 50 μg/ml (about 0.2 mM) AA-2P alone or with the conjunction of GDF-5, measuring effects at different time points (0th, 7th and 14th day of culture). After 14 days of AA-2P treatment the expression levels of COL1 and COL3 were significantly increased. However, the study has one serious limitation – the lack of negative control in the course of the study (non-treated cells). In our study we also noted statistically significant effect of AA-2P on the expression of tendon related genes. At the same time, we observed significant upregulation of RUNX2 (runt-related transcription factor 2) expression under influence of AA-2P (data not shown) what confirms the postulated osteogenic activity of this factor (standard component of osteogenic media). Analysis of protein synthesis using WB technique revealed significant increase in SCX expression under influence of AA-2P (mean 5.3-fold) with no impact on MKX expre-ssion. Taken together, our results suggest that the effect of ascorbic acid on ASCs differentiation is unspecific.
Another issue is the impact of AA-2P on collagen expression. Having in mind a well-known influence of ascorbic acid on collagens synthesis we expected increased production of COL1 and COL3. To our surprise, although genes encoding both COL1 and COL3 were upregulated after AA-2P treatment, the level of both types of analyzed collagens (I and III) at protein level remained either unaffected or decreased (COL3 in WB analysis) in ASCs under influence of 0.5 mM AA-2P. We hypothesized that it might be the result of extracellular distribution of these proteins. To verify this assumption, we applied an additional experiment and analyzed the intra- and extracellular distribution of collagen using immunofluorescence techni-que. In order to determine intra- and extracellular area, double immunostaining (actin+collagen I/III) was perfor-med. Defining a cell border was conducted empirically on the base of actin fluorescence and was only an estimated method of determining intra- and extracellular compart-ment. The chosen threshold value assumed the qualifica-tion of terminal (and consequently unfixed) area to the intracellular compartment, since fibrillar collagen assay was a priority in our study. During the images analysis, a part of data was lost (1 pixel wide “cell border” was not automatically included into calculations), although this fact did not influence the experiment outcomes (the loss was averagely less than 1% for every analyzed image). The results indicated that supplementation of AA-2P caused a significant increase in extracellular deposition of type I and III collagens in analyzed hASCs. Obtained results seem to be promising in the context of tendon regene-ration support since enhancement of extracellular collagen distribution would be potentially beneficial in a tendon tissue with disrupted ECM structure observed during tendinopathies.
Tendon is a very poorly vascularized tissue, therefore, the supply of nutrient substitutes under physiological conditions is limited. The reduction of serum content in media aims to imitate this situation. Our results demonstrate that the reduction of serum content to 2% resulted in a significant increase of tenogenesis-related transcription factor expression in qPCR (SCX). In contrast, WB analysis revealed no changes in SCX, but significant increase in MKH production. Other groups have already used a culture medium containing 1% FBS combined with various growth factors in order to induce tenogenesis, although serum depletion was not considered as a separate experimental factor so far (17, 31). Five days culturing in 2% FBS medium resulted in mean 33% decrease of cell viability. However, we decided, that survivability of tested hASCs was sufficient to conduct experiments with this level of serum reduction. The significantly upregulated PPAR-γ expression which was observed in this conditions in PCR analysis (data not shown) was probably associated with induced autophagy in starved ASCs (32). Nevertheless, our results clearly demonstrate that serum reduction itself should be considered as a tenogenic factor in testing MSCs. Therefore, if the effect of growth factors is tested with simultaneous lowering of the serum level, it is necessary to apply appropriate controls during the experiment.
Among all the experimental conditions used in this study, the most prominent and consistent changes in the expression of tendon-associated factors were observed after exposing hASCs to both – serum reduction and AA-2P supplementation. This treatment resulted in a significant increase in the expression of all analyzed genes in comparison to the untreated control at day 5. Interestingly, in all analyzed genes except SCX the effect of AA-2P+2%FBS treatment was significantly different than the effect of treatment with single agents. These results suggest the synergistic action of AA-2P and serum reduction in the experimental protocol used. However, the molecular me-chanism behind this phenomenon remains to be clarified.
In conclusion, our research demonstrated that vitamin C applied as a separate differentiation factor in terms of tenogenesis affects SCX synthesis, its translocation to the cell nuclei and results in changes in the cellular distribution of fibrillar collagens. These effects can explain pro-tenogenic activity of L-ascorbic acid suggested previously by other researchers and justify its use in culture media during the preparation of the MSCs for transplantation into tendons. We demonstrated that the use of ascorbate derivates such as AA-2P at a concentration of 500 μM in combination with 1% ITS significantly improves cell viability and does not induce harmful transition metals driven redox reactions.
Additionally, we have shown that the serum reduction alone induces activation of the tenogenic pathway in hASCs. This indicates the necessity to recognize the reduction of serum as a separate experimental factor and the use of appropriate negative controls in the future research. Finally, the combination of AA-2P and serum reduction efficiently induces the tenogenic differentiation pathway in hASCs and its effect at the level of gene expression is significantly stronger than the sum of the two single agents.
Go to :
 XML Download