

 PDF
PDF Citation
 Print
Print


Introduction
Mesenchymal stem cells (MSCs) have immense potential as therapeutic agents. To use them for cell therapies in the clinical setting, the use of conventional in vitro cultivation methods is essential (1-3). Unfortunately, the in vitro cultivation methods involve continuous passaging, during which MSCs undergo cellular senescence (4). Senescent MSCs have typical characteristics, including flattened morphology and enlarged cellular shape. Moreover, their proliferation abilities and differentiation potentials are significantly decreased; thus, they cannot be expected to perform optimally (5, 6), limiting their clinical applications. To overcome these shortcomings, researchers have explored several strategies to delay the aging processes of MSCs (7-11). Some of these strategies include repairing DNA damage induced by reactive oxygen species (ROS) produced in cultures, improving proteostasis by increasing autophagy activity, restricting caloric intake, and enhancing mitochondrial function using resveratrol (12-14). These results are achieved by regulating the pathways involved in stem cell aging.
High cell density, usually greater than 3,000 cells/cm2, is used to manufacture MSC products for clinical uses. There are a few reports addressing the relationship between cell density and change in stem cell function. In human adipose tissue-derived mesenchymal stem cells (AD-MSCs), cultures with low cell density (200 cells/cm2) reportedly show high proliferation activity and different cell morphologies and sizes (15, 16). Moreover, the expression of stemness-related gene is increased when cell density is low (17). However, the expression of genes related to immunosuppression, migration, and cell motility is upregulated at a high cell density (5,000 cells/cm2) (16).
These reports indicate that cell density has effects on morphological as well as functional characteristics of MSCs. Therefore, cell characteristics and functions can probably be manipulated by changing cell density in vitro. However, no such cell density-dependent changes in the characteristics and aging phenomenon of MSCs have been observed in long-term culture of bone marrow-derived mesenchymal stem cells (BM-MSCs).
In this study, we evaluated whether BM-MSC senescence during continuous passaging can be attenuated by maintaining low cell density. We examined and compared stem cell morphology, proliferation, and aging-dependent characteristics such as ROS production, DNA damage, telomerase activity, aging-dependent gene expression, and staining with β-galactosidase in cultures of varying cell densities at three passage stages. Based on these results, we proved that senescence in late passage stages could be attenuated by culturing at low cell density, indicating that MSC senescence can be delayed and that life span can be extended by controlling cell density in vitro. These results can be used as important data for the mass production of stem cell therapeutic products.
Materials and Methods
Isolation and characterization of MSCs
Human bone marrow collection was approved by the Seoul St. Mary’s Hospital Institutional Review Board (IRB), and written informed consent was obtained from a healthy donor (IRB number #KC15CSSE0336). Isolated MSCs were characterized for several cell surface antigens by flow cytometry (FACS Calibur; BD Biosciences). The MSCs were positive for CD29, CD44, CD73, CD90, and CD105, but negative for CD14, CD31, CD104, and HLA- DR.
Cell proliferation assay
In this study, MSCs cultured at three different cell densities were used for all experimental analyses: low-density cultured MSCs [LD-MSCs (LD), 50 cells/cm2], middle- density cultured MSCs [MD-MSCs (MD), 1,000 cells/cm2], and high-density cultured MSCs [HD-MSCs (HD), 4,000 cells/cm2]. LD and MD were passaged at intervals of 7∼10 days, whereas HD were passaged every 3∼5 days and cultured for long term until late passage. To observe the effects of ROS scavengers on MSC proliferation, cells were treated with ascorbic acid (AA; 25 μg/ml). Cell prolife-ration was determined by cell counting. Proliferation fold increase (FI), population doubling time (PDT), and population doubling level (PDL) were calculated by counting initial seeding numbers, final cell numbers obtained from each passage, and culture period per passage.
Cell differentiation analysis
Adipogenic and osteogenic differentiations were performed using the protocol described previously (18). For quantitative analysis, Oil red O-stained cells were completely dried and de-stained using 100% isopropanol. The absorbance of the de-stained solution was measured at 500 nm. Similarly, Alizarin Red S-stained cells were completely dried, de-stained with 10% acetic acid, and the absorbance was measured at 405 nm.
Senescence analysis using β-galactosidase
Cellular senescence was determined using a β-galacto-sidase staining kit (Cell Biolabs, San Diego, CA, USA), following the manufacturer's instructions. Briefly, cells were washed with phosphate-buffered saline, fixed with 4% formaldehyde, and incubated overnight at 37℃ with β-galactosidase staining solution. Positive (blue) cells were observed under a light microscope. For quantitative evaluation of senescence, 15,000 cells were assayed using the Quantitative Cellular Senescence Assay Kit (Cell Biolabs, San Diego, CA, USA). Results were expressed as the relative fluorescence unit (RFU).
Intracellular production of ROS
Intracellular ROS were measured using DCFDA Cellular ROS Detection Assay Kit (ab113852, Abcam, Cambridge, UK), following the manufacturer’s instructions. Cells (2×10⁴) were seeded in each well of a 96-well plate and fluorescence was measured using a fluorescence plate reader (Biotek, Synergy H1; excitation=485 nm and emission=535 nm) to quantitate ROS production.
Oxidative DNA damage analysis
To determine oxidative DNA damage, 8-hydroxy-2’-deo-xyguanosine (8-OHdG) was measured using OxiSelect DNA Oxidative Damage ELISA Kit (STA-320, Cell Biolabs), following the manufacturer’s instructions. The absorbance was measured with a microplate reader at 450 nm.
Determination of telomerase activity
Telomerase activity was determined using Telomerase PCR ELISA Kit (Roche Diagnostics Scandinavia AB, Stockholm, Sweden), following the manufacturer’s instruc-tions.
Quantitative real-time PCR
Total RNA was isolated using TRIzol (Invitrogen, Paisley, Scotland) according to the manufacturer’s instructions. The PCR reactions were performed on an Applied Biosystems StepOnePlusTM PCR machine using 5 μl SYBRⓇ Green PCR Master Mix (Life Technologies, Grand Island, NY, USA). Real-time reverse transcriptase polymerase chain reaction (RT-PCR) was used to quantify by specific marker genes. The primers used in this study are as follows. P15, p16, PCNA (proliferating cell nuclear antigen), PPARγ (peroxisome proliferator-activated receptor gamma), FABP4 (fatty acid-binding protein 4), ALPP (alkaline phosphatase), SPP1 (secreted phosphoprotein 1). All primers were obtained from Qiagen (Hilden, Germany). The delta-delta-Ct method was employed to determine the relative gene expression normalized to the endogenous controls glyceraldehyde-3-phosphate (GAPDH).
Results
Culturing at low-density attenuates morphological changes that appear at late passage
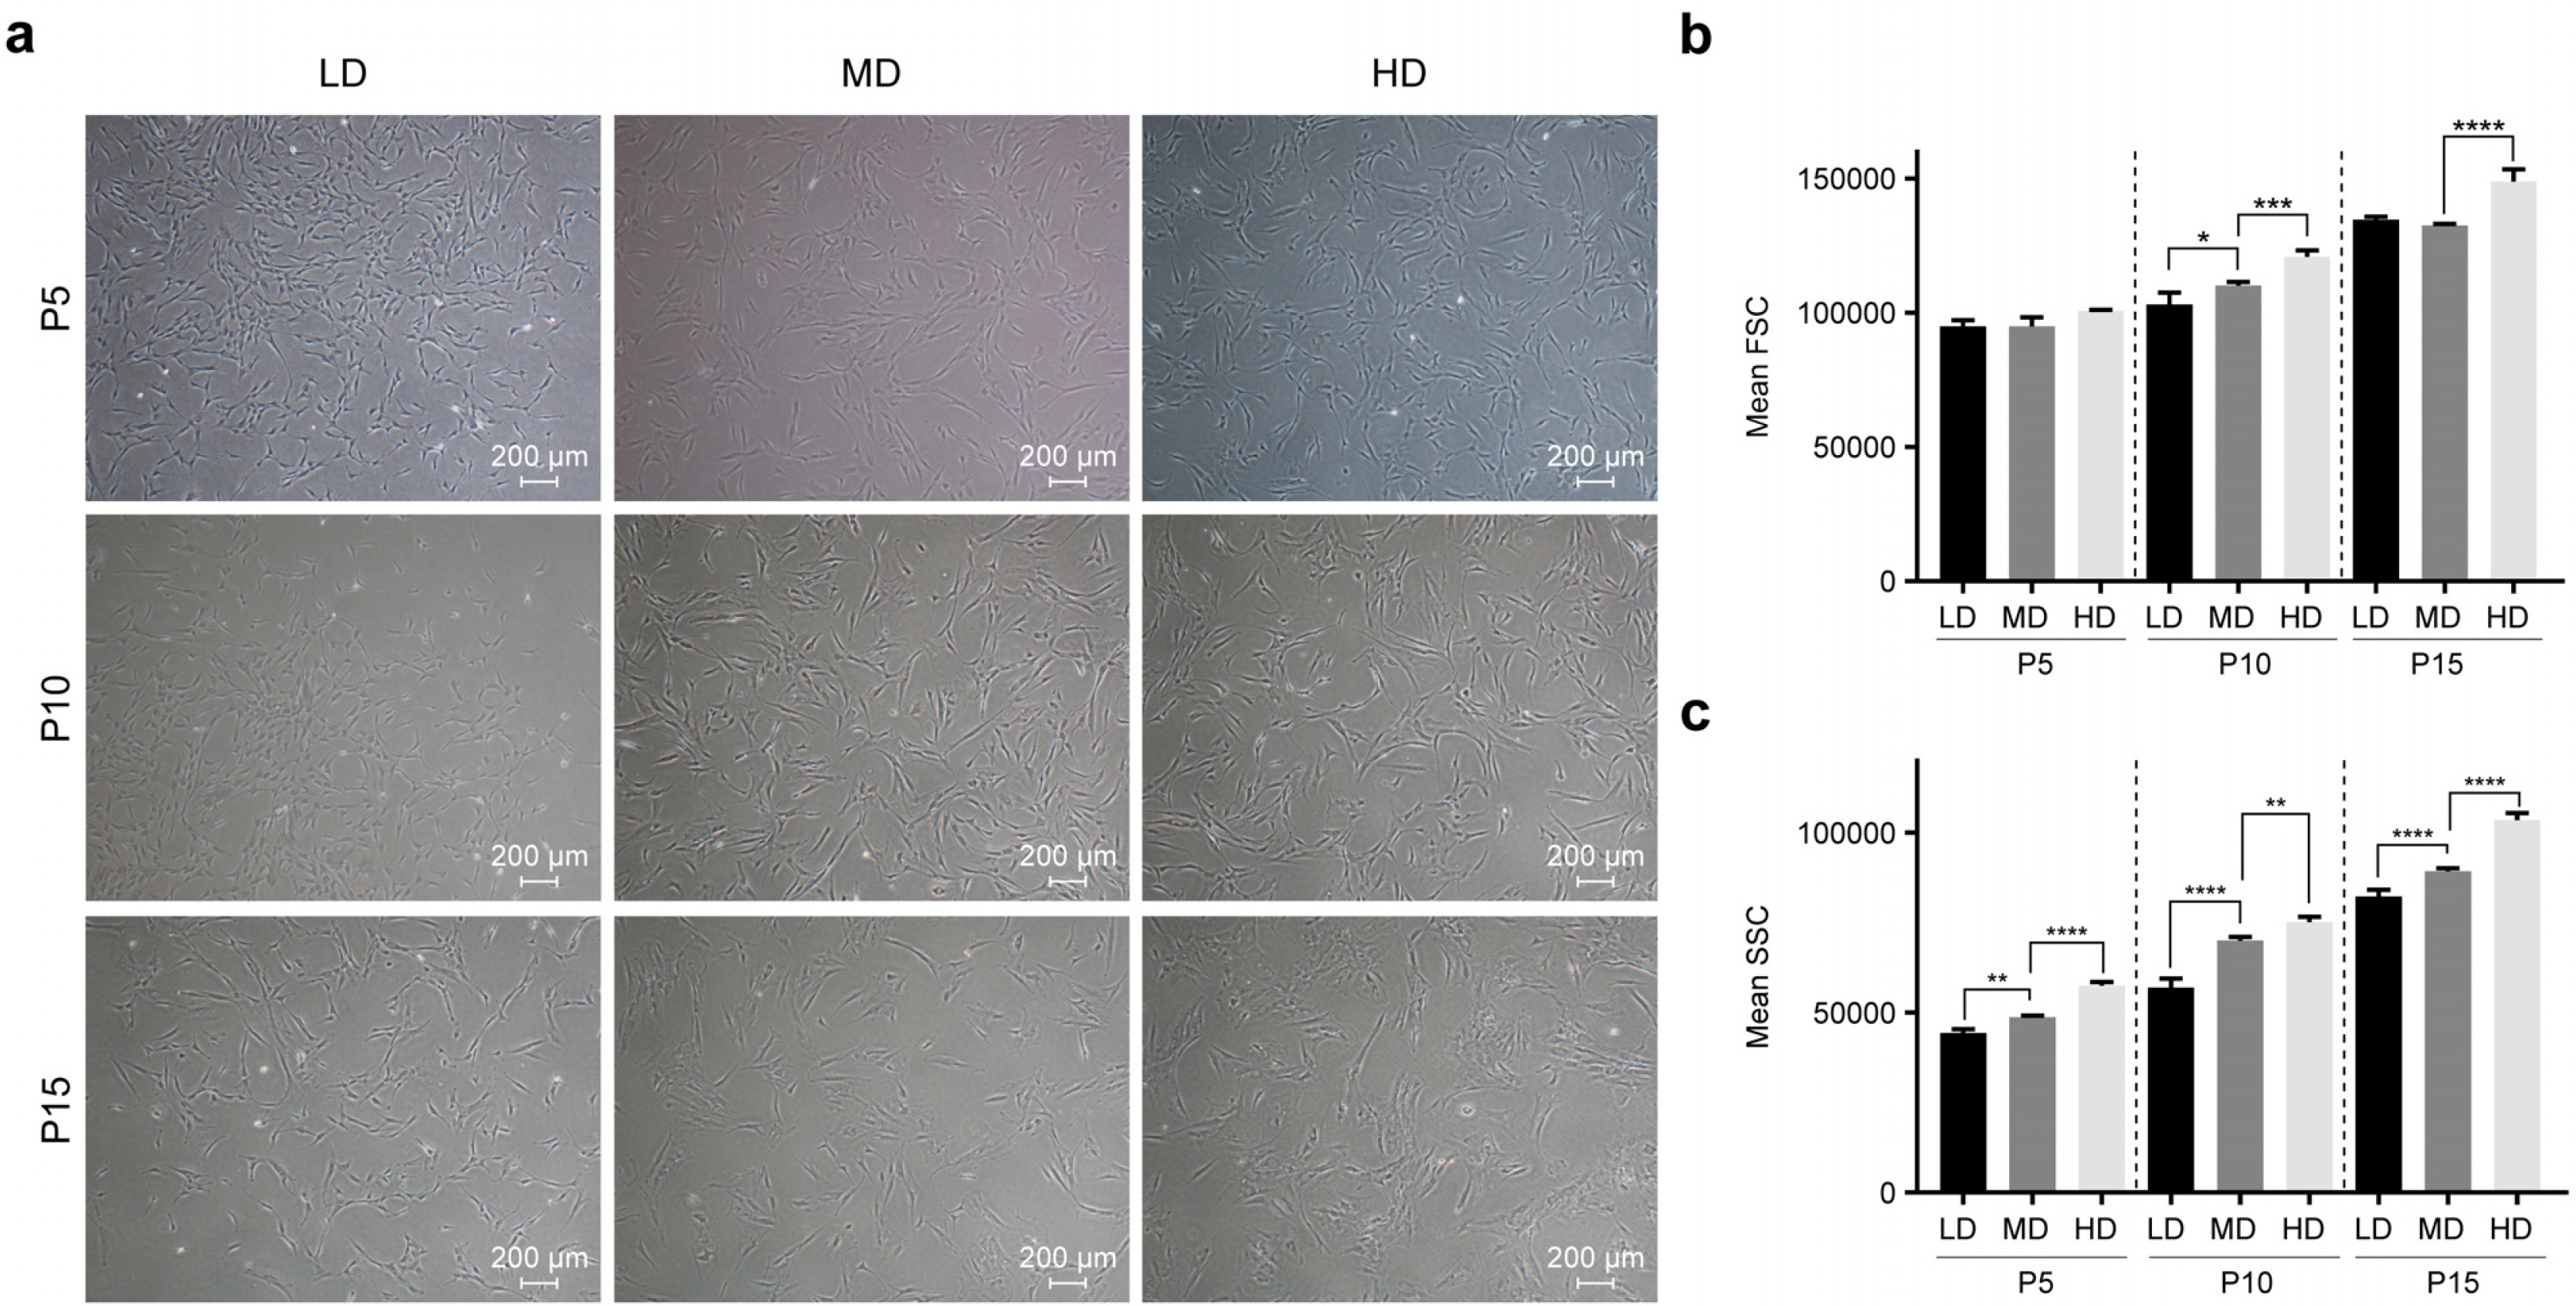
To determine whether culturing conditions affect aging-associated changes, we observed morphological changes in MSCs by culturing them at different cell densities for long term. Three different cell densities were selected: 50 (LD), 1,000 (MD), and 4,000 (HD) cells/cm2. Morphological changes in MSCs were observed from passage 5 to passage 15. At passage 15, HD showed flattened and enlarged shapes, which is the normally observed morphology of senescent cells. On the contrary, such changes were observed neither in LD nor in MD (Fig. 1a). To observe changes in cell size and granularity, we performed flow cytometry. At passage 5, no density-dependent difference in cell size was observed. However, at passages 10 and 15, cell size was significantly increased in HD compared to that in LD and MD. There was no difference in cell sizes between MD and LD (Fig. 1b). On the contrary, we found that granularity increased significantly with increasing cell density at all passages (Fig. 1c). These observations suggest that morphological changes in MSCs can be modulated by lowering cell density in long-term cultures.
Culturing at low density delays senescence of MSCs in long-term cultures
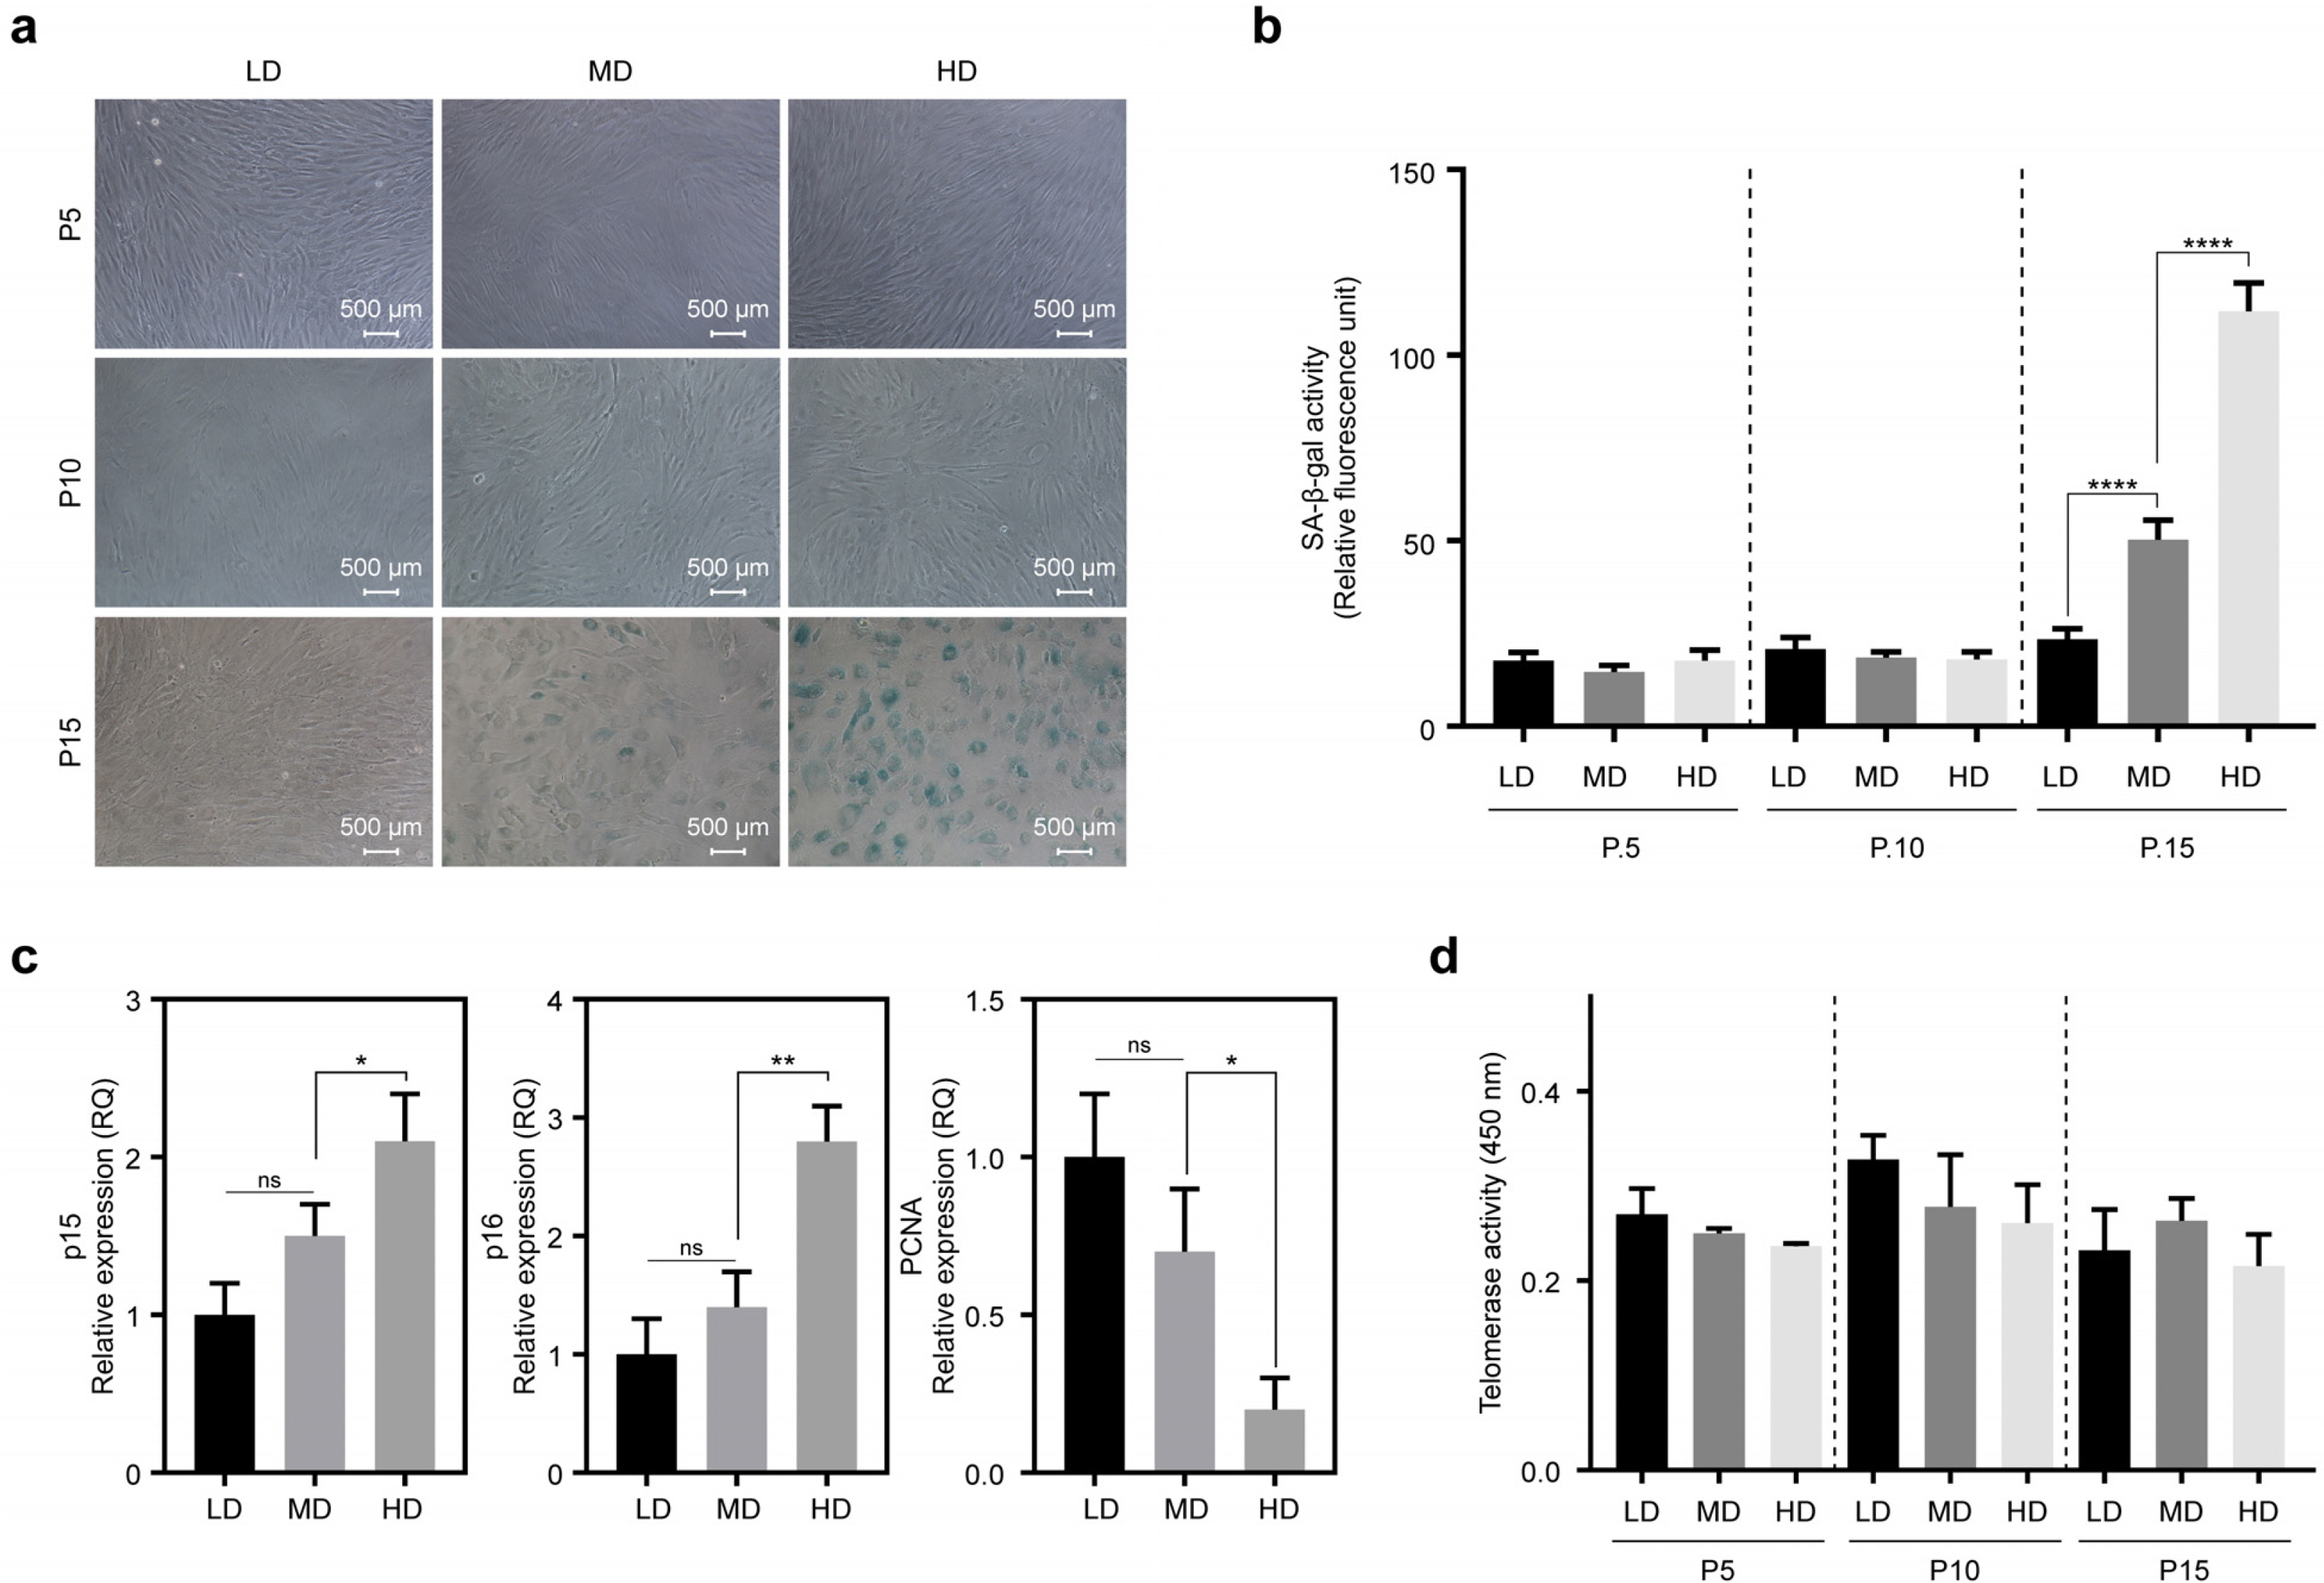
To confirm whether the morphological changes shown in Fig. 1 were aging-dependent, cellular senescence was analyzed using senescence-associated β-galactosidase (SA-β-gal) staining. Cell density-dependent morphological changes in MSCs were not observed at passages 5 and 10. However, at passage 15, SA-β-gal positive cells were increased in HD compared to those in LD and MD (Fig. 2a). Quantitative analysis of fluorescence intensity in SA-β-gal positive cells showed the most prominent induction in HD at passage 15 (Fig. 2b).
Next, we performed experiments to observe differences in the expression of senescence-related genes, such as p15, p16, and proliferating cell nuclear antigen (PCNA), in MSCs cultured at three different cell densities. At passage 15, the expression of p15 and p16 was compared among LD, MD, and HD. We observed that the expression levels of both genes were decreased by lowering the cell densities. However, PCNA, a marker for proliferation, was decreased with increasing cell density (Fig. 2c). These results imply that senescence of MSCs can be delayed under low-density conditions.
Culturing at low density maintains the proliferation ability and extends the lifespan of MSCs even at late passages
As the proliferation ability of MSCs gradually decreases upon senescence, measuring proliferation ability is one of the tools for estimating senescence (22, 23). We analyzed proliferation potentials of cells at the abovementioned conditions of passage and cell density. FI, PDT, and PDL were calculated from initial cell number, final cell number, and culture period.
Throughout the passage stages, PDT tended to increase while both FI and PDL tended to decrease with increasing passage numbers at all densities. We noted that the decrease in proliferation ability during long-term culture was slower at low cell densities (Table 1). These results indicate that the lifespan of MSCs can be extended in vitro in long-term cultures with low density.
Culturing at low density maintains osteogenic differentiation potential without affecting adipogenic potential
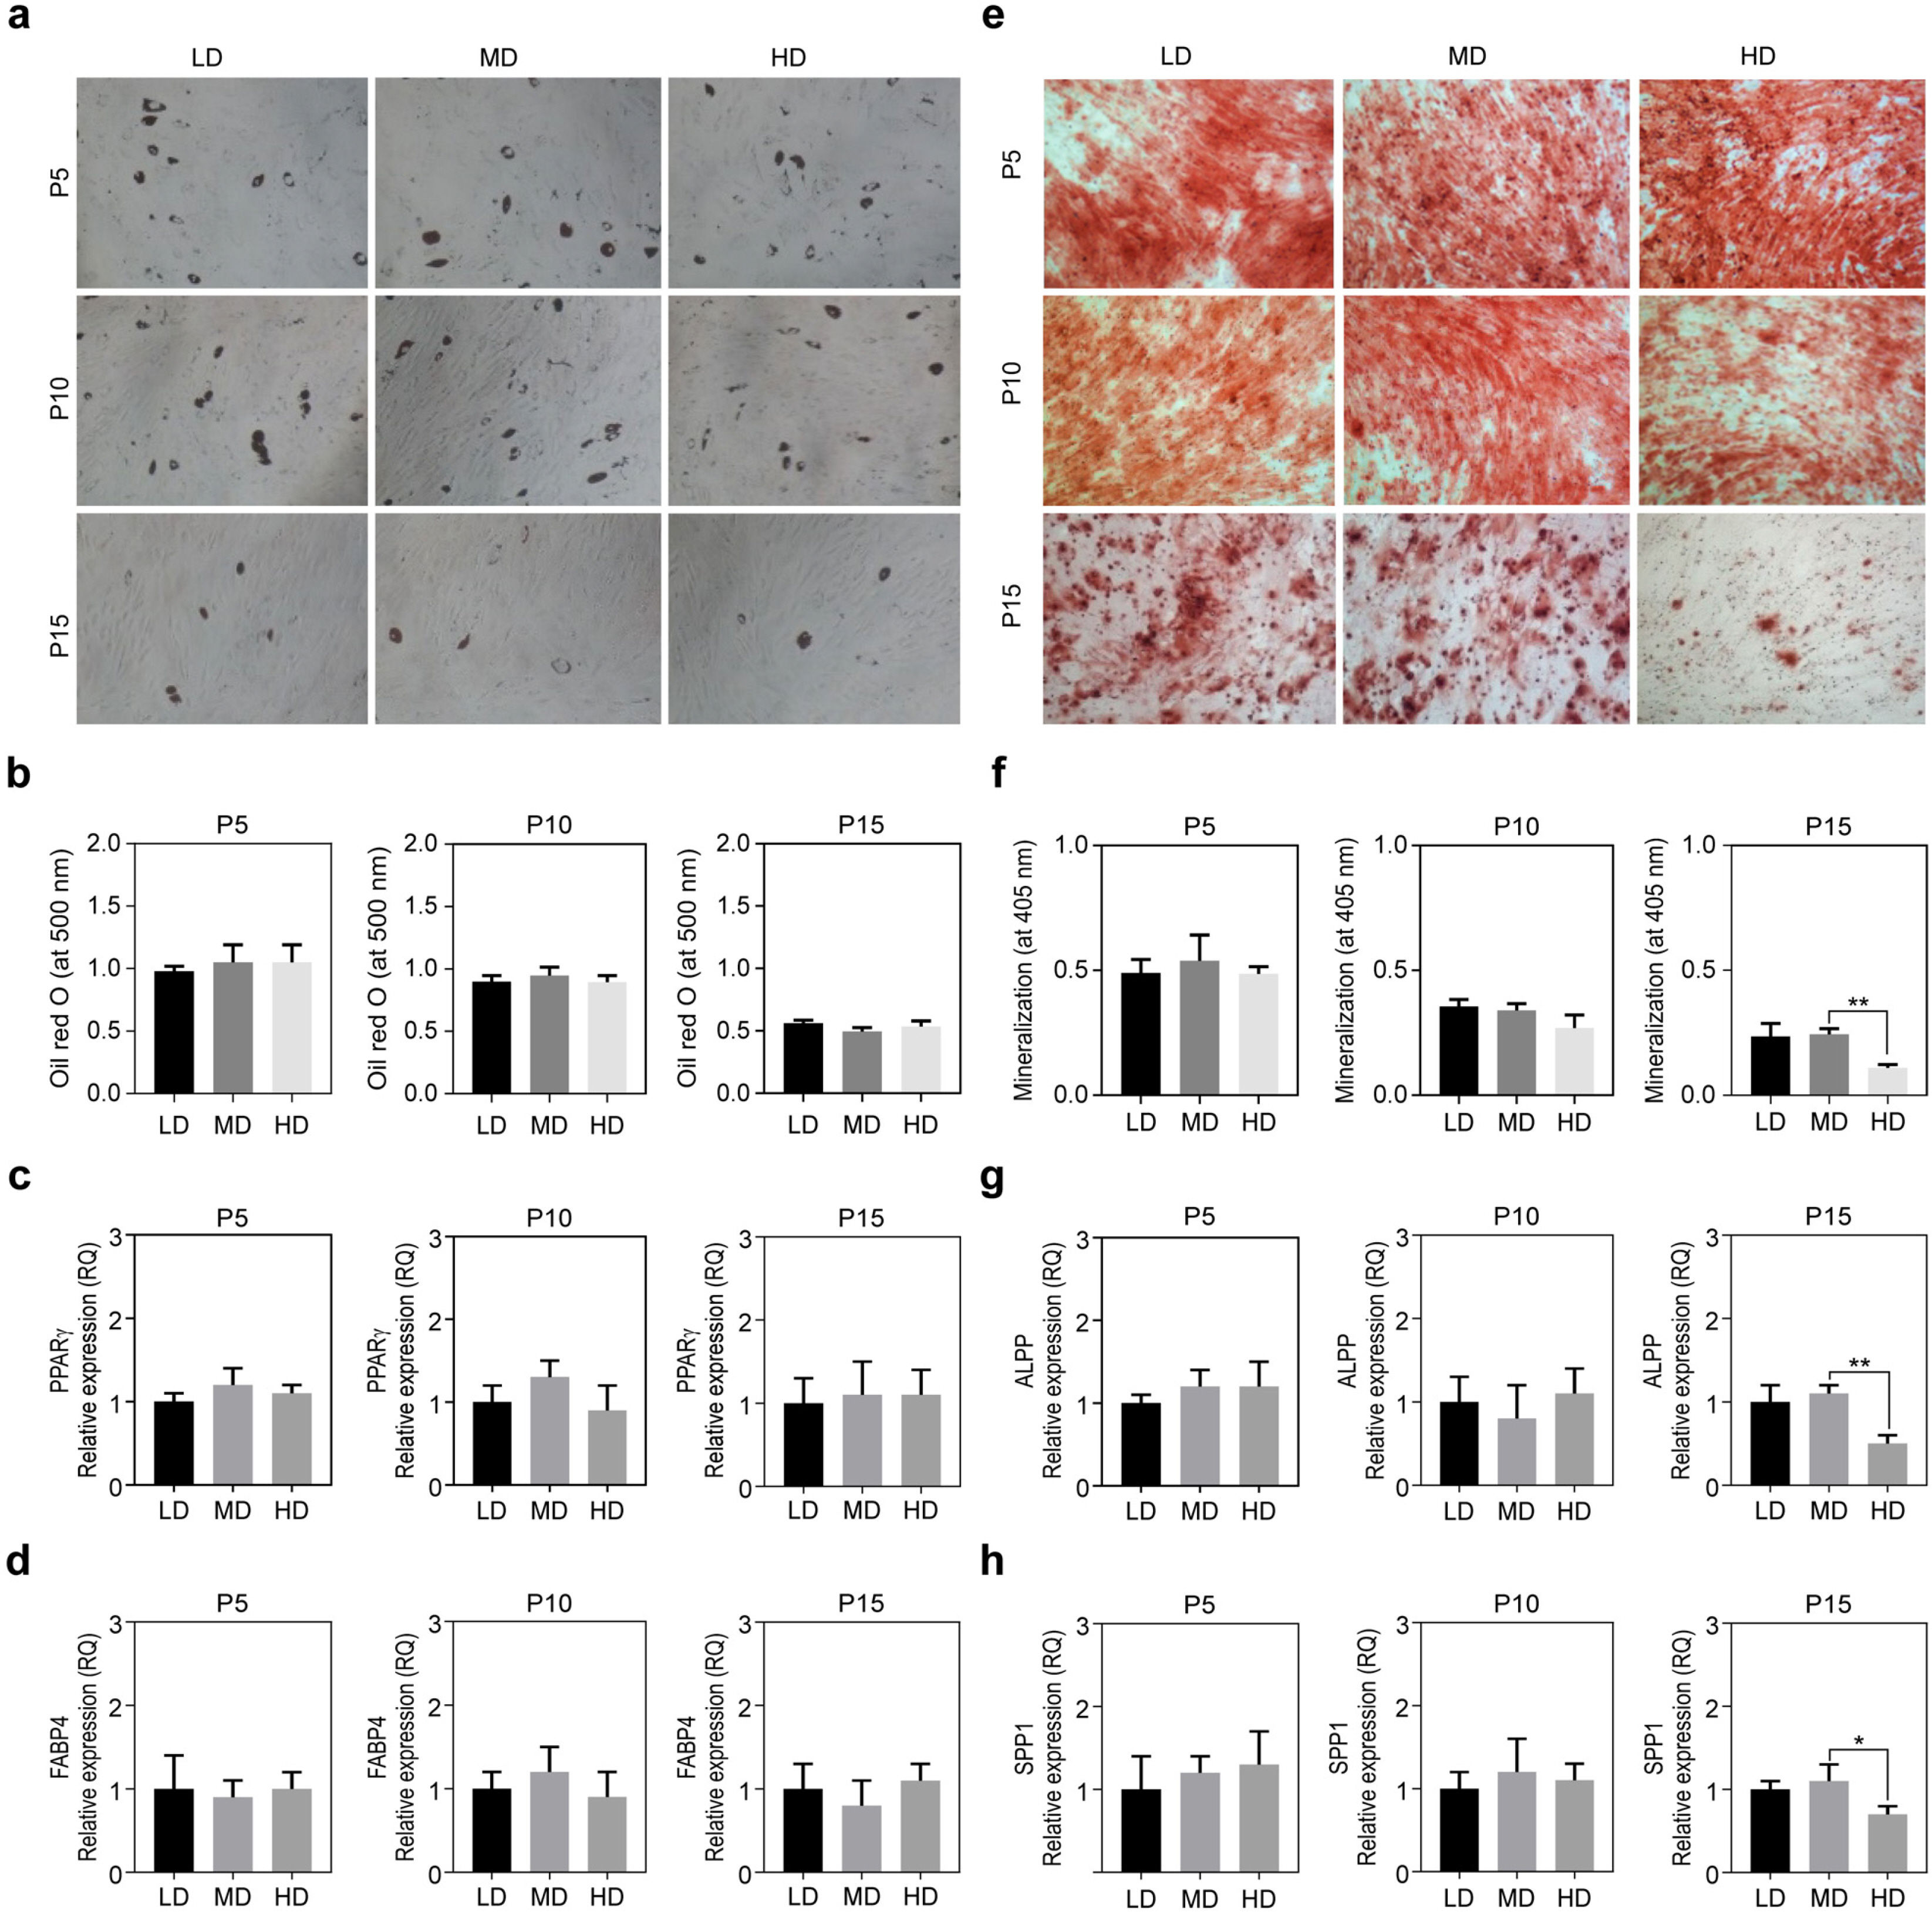
We analyzed differentiation potentials to check whether they were affected by varying cell densities. Both adipogenic and osteogenic differentiation potentials were compared among MSCs cultured at the abovementioned conditions. Although adipogenic potential, determined by Oil red O staining at passage 15 was decreased when compared to that at early passages, the difference was not significant across different cell densities (Fig. 3a and 3b). Adiopogenic differentiation potential of MSCs was also analyzed by specific marker expressions, such as PPARγ and FABP4. No significant difference across different cell densities was observed (Fig. 3c and 3d).
However, osteogenic differentiation potential, determined by Alizarin Red-S staining with mineralization quantitation was significantly decreased in a passage-dependent manner (Fig. 3e and 3f). There was no difference in differentiation potential regarding varying cell densities at passages 5 and 10. At passage 15, however, osteogenic differentiation potential was almost completely lost in HD but was maintained in LD and MD. It is well correlated with the reduction of osteogenic differentiation markers expressions, ALPP and SPP1, at passage 15, compared to those at passages 5 and 10. (Fig. 3g and 3h). These results indicate that osteogenic potential of MSCs can be maintained under low cell densities even after prolonged passage.
Culturing at low density reduces DNA damage induced by ROS in long-term cultures
As cells become senescent, they show a direct correlation between decrease in stem cell function and accumulation of DNA damage (24-27). In particular, ROS induce oxidative DNA damage and decrease stem cell function, leading to MSC aging (25, 27). Accordingly, total cellular ROS were determined to identify whether ROS production was influenced by cell density. At passage 5, there were no significant differences in ROS production in LD, MD, and HD. On the contrary, at passages 10 and 15, ROS production was significantly decreased when cell density was lowered. Specifically, ROS production was significantly increased in HD compared to that in LD or MD (Fig. 4a). To confirm the above results, 8-OHdG, a DNA damage marker (28), was measured to assess ROS-dependent DNA damage. In our experiments, 8-OHdG production did not show any difference among the three cell densities at passages 5 and 10; however, at passages 15, it increased significantly with increase in cell density (Fig. 4b). These results indicate that DNA damage was induced by ROS at high cell density, resulting in increase in cell senescence.
Scavenging ROS promotes MSC proliferation in HD
To determine whether MSC proliferation was influenced by the ROS generated in high cell density cultures, HD were treated with AA, a well-known ROS scavenger. At passages 11∼15, AA was added to MSCs and their proliferative abilities were compared with those of untreated MSCs. At passage 11 of HD, FI values were 2.6±0.32 and 3.8±0.51 for AA-treated and untreated MSCs, respectively. At passage 15, the corresponding values were 1.6±0.14 and 2.5±0.27 (Fig. 4c). In addition, a decrease in ROS production due to AA treatment was confirmed at passage 15 (Fig. 4d). Overall, MSC proliferation ability was increased by ROS inhibition and it was maintained even after late passage. This suggests that the lifespan of MSCs can be improved via scavenging ROS. To confirm the above results, we examined the expressions of senescence-related genes, such as p15, p16, and PCNA in MSCs cultured at passage 15 of HD in the presence or absence of AA. According to scavenging ROS by treatment of AA, the expression levels of both p15 and p16 were decreased, but the expression of a proliferation marker, PCNA, was increased. (Fig. 4e). Moreover, the production of 8-OHdG, DNA damage marker, was significantly reduced by AA treatment, scavenging ROS (Fig. 4f). These results imply that senescence of MSCs can be delayed via scavenging ROS under high-density conditions.
Discussion
MSCs have been under research focus because of their properties such as multi-lineage differentiation, self-renewal, and therapeutic effect on various diseases (29). However, MSCs have limited expansion potential in vitro; therefore, research aimed at developing a large-scale production technology is urgently needed (30-32). MSCs become senescent during repetitive passages and lose their proliferation potential and characteristics, leading to the loss of their unique properties, such as anti-inflammation response, immune modulatory function, and/or cell migration (14, 25). MSC aging is influenced by various parameters including ROS production, DNA damage, hindrance to protein homeostasis, and mitochondrial dysfunction (6, 19, 23). The lifespan of MSCs can be extended if senescence is controlled by manipulating these aging-associated phenomena.
In this study, we found that LD in long-term cultures show about seven times higher PDT and four times higher PDL at passage 15 than HD (Fig. 3a). These results indicate that the lifespan of MSCs in LD can be extended in vitro in long-term cultures and it can significantly increase their mass-culture productivity. Our results are consistent with those of previous studies, which reported that the proliferation activity and expression of stemness-related gene increase at low cell density (15, 17). Stemness of MSCs indicates not only proliferation ability but also the inherent functions, such as differentiation and colony formation. Gharibi et al. (4) reported that the inhibition of age-dependent phenomena improves not only proliferation ability but also adipogenic and osteogenic differentiation. However, our results showed that adipogenic differentiation potential was not influenced by cell density, whereas osteogenic differentiation potential was significantly decreased at passage 15 in HD compared to that in LD and MD (Fig. 3). This indicates that low cell density culture may also suppress the decrease of age-dependent differentiation potential in long-term culture of MSCs. Further research is needed to confirm whether low cell density regulates osteogenic differentiation.
ROS production and DNA damage can be key mechanisms underlying MSC senescence (19, 27). MSC aging is also expedited by decreasing telomerase activity (21, 26, 28). A decrease in ROS production and DNA damage has also been reported in previous studies in which MSC senescence was attenuated by treating the cells with ROS or autophagy inhibitors (12, 13). However, no attempt has been made to increase MSC proliferation activity by observing and controlling ROS production by modulating cell density. In this study, senescence of MSCs was delayed by decreasing ROS production and DNA damage in low cell density cultures. No significant difference was found in telomerase activity. The changes associated with low cell density are considered independent of telomerase activity. We confirmed that proliferation ability was restored by treating HD with AA (a ROS scavenger). We found that proliferation activity was further enhanced when ROS production was inhibited in the same manner as in LD (data not shown). This implies that senescence- dependent changes can be attenuated by inhibiting ROS produced during MSC expansion.
To verify whether the extended lifespan of MSCs cultured at low density increased the mass production yield and boosted the efficacy of MSCs in clinical settings, we need to produce MSCs by culturing at low density on a large-scale and test them in animal models. In addition, further research is needed to explore the molecular mechanism underlying cell density-dependent changes observed in MSCs at low cell density.
In conclusion, we demonstrated that delaying MSC senescence and extending their lifespan are possible by modulating cell density in vitro. We achieved these results without introducing any chemical additives/genetic vehicles or changing complicated culture methods. We believe that this method is an important piece of information for developing a large-scale production technology and enhancing MSC function.

 XML Download