

 PDF
PDF Citation
 Print
Print


Introduction
The inflammatory response is a process that perceives “danger” signals via binding to a cognate specific receptor, and thereby is able to fight back in self-defense; this process is highly sensitive to tissue injury and also protects the host from excessive inflammation. Inflammasomes are important regulators of innate immunity, with an important function during inflammation in vivo (1). Their assembly is triggered when a member of the NOD-like receptor (NLR) proteins (NLRP1 and NLRP3) and non-NLR receptors, such as absent in melanoma-2 (AIM2), are activated (2). Upon activation, these innate immune sensor proteins oligomerize, leading to the recruitment of an adaptor protein such as apoptosis-associated speck-like protein containing a caspase-recruitment domain (ASC), which then binds with pro-caspase-1 to form an inflammasome. Inflammasome assembly promotes pro-caspase-1 cleavage to generate the active form, which leads to promoting of caspase-1 (Casp1)-dependent inflammatory cell death, termed pyroptosis, and the secretion of pro-inflammatory cytokines, such as interleukin (IL)-1β or IL-18. Accordingly, the aberrant activation of the inflammasomes is a risk factor for the emergence of autoimmune, autoinflammatory, chronic inflammatory, and metabolic diseases (3–6).
Mesenchymal stem cells (MSCs) exhibit multipotency with immunomodulatory and anti-inflammatory activity, which make them attractive for treating many diseases (7, 8). MSCs migrate to sites of tissue injury and produce various immunosuppressive factors such as tumor necrosis factor-α (TNF-α), indoleamine 2,3-dioxygenase, and prostaglandin E-2 (PGE-2) (9). Evidently, MSCs ameliorate inflammatory diseases by suppressing inflammasome activation in various tissues. Adipose tissue (AD)-derived MSCs were found to ameliorate chronic colitis by the reduction of total number of macrophages and M1 macrophages, mediated through the inhibitory action of PGE-2 on inflammasome complex formation in macrophages (10). In a rat spinal cord injury model, transplantation of Wharton’s jelly-derived MSCs was found to suppress the NMRP1 inflammasome and improve motor function recovery (11). Moreover, human umbilical cord (HUC)-derived MSCs have been shown to effectively reduce inflammatory responses through blocking NLRP3 inflammasome activation for therapies in type 2 diabetes (12). In recent years, accumulating evidence indicates that perivascular stem cells (PVCs), as a precursor of MSCs, offer promising prospects for their application in the development of cellular therapies due to their greater proliferative activity and regeneration potential compared to AD- and bone marrow (BM)-derived MSCs (13, 14). PVCs can be isolated from various fetal and adult tissues and are being extensively investigated in a number of preclinical studies for various diseases (15, 16). However, the therapeutic effects of PVCs on macrophage-mediated inflammatory diseases have been poorly investigated. Thus, given the beneficial anti-inflammatory properties of MSCs and greater therapeutic potential of PVCs, it is imperative to investigate the possibility that PVCs could suppress inflammasome activity during macrophage-mediated inflammatory responses.
In this study, we confirmed in vitro that PVCs effectively attenuate the secretion of pro-inflammatory cytokines in human and murine macrophages by suppressing inflammasome activation in a paracrine fashion. We also demonstrated that the PVC secretome significantly reduces inflammatory activity and endoplasmic reticulum (ER) stress in peritoneal macrophages in a monosodium urate (MSU)-induced peritonitis mouse model. Secretome analysis of PVCs revealed serpin E1 and angiogenin as potential factors for inhibiting mitochondrial reactive oxygen species (ROS) generation and inflammasome activation. Our findings provide a rationale for the possible application of PVCs in the treatment of macrophage- and inflammation-mediated diseases by paracrine action via the secretion of various biological factors.
Go to : 
Materials and Methods
PVC isolation and cultures
Unless otherwise indicated, all materials for PVC culture were purchased from Gibco (Thermo Fisher Scientific Inc., MA, USA). The study was approved by the institutional review board of Kangwon National University Hospital (2012-11-003-008). All participants provided written informed consent. As previously described (15), PVCs were isolated from HUC obtained following full-term birth after caesarian section. PVC purification was confirmed by FACS to represent >87%, CD146+ populations and be free of CD45+, CD34+, CD31+ cells. PVCs were maintained with α-MEM medium containing 10% FBS, 100 U/ml of penicillin, and 100 μg/ml of streptomycin at 37°C in a 5% CO2 atmosphere. All PVCs were studied at low passages (P3~P5).
Preparation of PVC-conditioned medium
To prepare conditioned medium (CM) from PVC cultures, when PVC cultures reached about ~70~80% confluence, the cells were washed once with phosphate-buffered saline (PBS), followed by incubation with α-MEM supplemented free medium. After 24 h, CM was harvested and concentrated using Amicon Ultra-15 Centrifugal Filter Units (Merck Millipore, Billerica, Massachusetts, USA) for 60 min at 6,000 g, 4°C. After filtering through a 0.22-μm filter (Merck Millipore), the final concentrated CM measured with approximately 10- to 12-fold for experimental studies. The concentration of the CM was determined using the BCA assay (Thermo Fisher Scientific Inc). The protein concentration of the prepared medium was then adjusted to 60 mg/ml for experiments. An equal amount of concentrated CM was diluted with RPMI 1640 at a volume ratio of 1:3 (concentrated CM: THP-1 cells media). It is usually useful to evaluate CM by making several serial dilutions.
Cell culture and inflammasome activation
A human peripheral blood-derived monocytic cell line, THP-1, was obtained from the Korea Cell Line Bank (KCLB No. 40202; Seoul, Republic of Korea) and these cells were differentiated into macrophage-like cells by incubating with phorbol 12-myristate 13-acetate (PMA, 100 nM, InvivoGen, CA, USA) for 72 h. Mouse peritoneal macrophages were obtained from C57BL/6 mice as described below for the MSU-induced peritonitis model. The PMA-differentiated THP-1 cells and mouse peritoneal macrophages were plated on 12-well plates (Falcon, USA) and primed with 1 μg/ml of lipopolysaccharide (LPS; Sigma-Aldrich Co., MO, USA) in RPMI 1640 containing 10% FBS and antibiotics for 3 h. The cells were then stimulated by NLRP3, NLRC4, AIM2 activator ATP (2 mM; InvivoGen), flagellin (500 μg/ml; InvivoGen), or dsDNA (2 μg/ml; pGL3 plasmid vector) for 1 h. To determine the inhibitory effects of PVC-CM (dosages of 20 μg/ml to 5 μg/ml), rhSerine E1 (2 unit/Rx, Novous, CO, USA), or rhAngiogenine (2 unit/Rx, R&D system, MN, USA) on inflammasome activation, the extracts were co-treated with the above activators. Cellular supernatant (Sup), lysate (Lys), and pellets (Pellet) cross-linked with suberic acid bis (Sigma-Aldrich Co.) were collected for further analysis.
Western blot analysis
Samples were separated on an SDS-PAGE gel (12% or 15%), transferred into PVDF membrane (Millipore, Billerica, MA, USA) and blocked. Then, the membrane was probed with primary antibodies against anti-human/mouse IL-1β antibody (AF-201-NA/ AF-401-NA, R&D systems), anti-caspase-1 p20 antibody (ab207802, Abcam., Cambridge, UK), anti-ASC antibody (sc-22514, Santa Cruz Biotechnology, CA, USA), anti-caspase-1 antibody (sc-622, Santa Cruz Biotechnology), anti-β-actin antibody (sc-47778, Santa Cruz Biotechnology) overnight at 4°C, the membranes were further probed with HRP-conjugated 2nd anti-sera (Sigma-Aldrich, St Louis, MO, USA) and visualized by western blot detection kit (WEST-SAVESTAR, Seoul, Republic of Korea) and ChemiDocTM MP Imaging System (Bio-Rad Laboratories, Inc.).
Cytotoxicity test
For cytotoxicity assay, THP-1 cells (2×10⁴ cells/well) allowed to be attached in 96-well plates to 90% confluence. The cells were treated with the indicated substances for 3 hrs and cytotoxicity was assessed by MTS assay (Abcam) according to the manufacture’s protocol.
Enzyme-linked immunosorbent assay (ELISA)
To quantitate secreted IL-1β and Caspase-1/ICE, cell culture supernatants from PMA-differentiated THP-1 cells and mouse peritoneal macrophages were measured using the human IL-1β and human Caspase-1/ICE Quantikine ELISA Kit (R&D Systems). The ELISA plates were read-out using a microplate reader (Molecular Devices, CA, USA).
Caspase-1 activity assay
For caspase-1 activity assay, human recombinant caspase-1 (1 unit/rx, #1081, BioVison Inc., CA, USA) was incubated with YVAD-pNA, a substrate of caspase-1, in the present of PVC-CM, Serpin E1, Angiogenin or Z-VAD-FMK (10 μM, tlrl-vad, InvivoGen). The activity of caspase-1 was measured by Caspase-1/ICE Colorimetric Assay Kit (#K111, BioVison Inc) according to the manufacturer’s protocol.
Quantitative real-time PCR
PMA-differentiated THP-1 cells and mouse peritoneal macrophages (1×10⁶ cells/well) in 6 well-culture plates have primed the absence or presence of 100 ng/ml LPS for 3 hrs with a dosage of PVC-CM. Total RNA was extracted using Trizol (Invitrogen) and reverse-transcribed into cDNA using the QuantiTect® reverse transcription kit according to the manufacturer’s protocol (Qiagen, Hilden, Germany). Transcripts were quantitated using Power SYBR® Green PCR Master Mix (Applied Biosystems, Carlsbad, CA, USA) and the QuantStudio 6 Flex Real-Time PCR system (Applied Biosystems). Primer sequences are listed in Table 1. All of the quantitation was normalized with β-actin.
Table 1
Primer sequences used for quantitative RT-PCR
![]()
Mitochondria ROS analysis
PMA-differentiated THP-1 cells were plated on Poly-L-Lysine (Sigma)-coated confocal dish (SPL Life Science Co., Gyeonggi-do, Republic of Korea) and 12 well plates for 3 days and then LPS primed cells were treated with Rotenone (10 μM, Sigma) or candidate inhibitors for 6 h. For confocal microscopy, the cells were loaded with Mitosox (2.5 μM, Invitrogen) and Mitotracker Green (100 nM, Invitrogen) probes for 30 min at 37°C. After washing three times with PBS, followed by a replacement cellular medium. Images were analyzed by Korea basic science institute chuncheon center (LSM 780 confocal microscope, Carl Zeiss, NY, USA).
Proteome profiling analysis
To search for candidate factors, cytokine assay was performed using the human XL Cytokine Antibody Array (R&D system). Briefly, PVC-CM and activated cell supernatants were incubated with the array’s membrane, following by the manufacturer’s protocol. A schematic representation of the cytokine/chemokine spot positions in duplicate on the membrane with respective internal controls. Dots were detected using ChemiDocTM MP Imaging System (Bio-Rad Laboratories, Inc.), and dots intensity were analyzed by Image J software.
Animals study and peritoneal macrophage isolation
C57BL/6 mice were obtained from DooYeol Biotech (Seoul, Republic of Korea). All animals used for the experiments were aged 6~8 weeks. All animal studies were conducted in compliance with the guidelines of the committee for the care and use of experiments on animals and approved by the Institutional Animal Care and Use Committee at the Kangwon National University. To generate the MSU-induced inflammatory disease model, mice were administered an intraperitoneal (IP) injection of 3% thioglycolate (3 ml) for priming. After 4 days, the mice were IP injected MSU (5 mg/mouse) with/without PVC-CM in 0.2 ml PBS for 6 h. For the white blood cell (WBC) differential count, mice were anesthetized by isoflurane (Aesica Queen Borough Limited, Kent, UK), and whole blood was collected from the orbital sinus. Mice were euthanized by cervical dislocation, and the peritoneal exudate cells were harvested from peritoneal cavity lavage fluid with 8 ml Opti-MEM medium. Whole blood and peritoneal exudate cells were analyzed by WBC differential count (XN-3000, Sysmex, Japan) and Wright-Giemsa staining.
Statistical analysis
Statistical analyses were performed with Student’s t-test and two-way analysis of variance for multiple groups using GraphPad Prism (GraphPad Software, San Diego, CA, USA). Data were collected from at least three independent experiments and represent the mean±SD. p<0.05 was considered to be significant.
Go to :
Results
PVC-CM inhibits the inflammasome activation during macrophage-mediated inflammatory response in a paracrine fashion
The MSC secretome has been widely applied in various preclinical studies as an acceptable alternative, because MSCs transplanted to site of injury mainly act via indirect paracrine effects. Thus, we first asked if the CM collected from PVC cultures could regulate inflammasome activation during macrophage-mediated inflammatory responses in vitro. Inflammasome activation is a two-step process: first, it requires a priming step, which leads to intracellular synthesis of NLRP3, pro-casp1, and pro-IL-1β. Next, a second activation step results in the assembly of the inflammasome complex and induced Casp-1 and IL-1β activation that can be stimulated by various triggers (Fig. 1A). We first treated LPS-primed human macrophages (PMA-differentiated THP-1 cells) with PVC-CM in the absence and presence of inflammasome activators. As shown in Fig. 1B, PVC-CM alone did not mediate the secretion of the active form of IL-1β (p17) in THP-1 cells, whereas ATP, a well-known NLRP3 inflammasome activator, significantly induced IL-1β secretion. To elucidate whether PVC-CM acts as an inhibitor for the NLRP3, NLRC4, and AIM2 inflammasomes, we treated inflammasomes triggered in LPS-primed human macrophages with PVC-CM and measured the active forms of Casp1 and IL-1β in the cellular supernatants. PVC-CM significantly inhibited Casp1 and IL-1β secretion mediated by several inflammasome activators, and also attenuated the formation of the ASC pyroptosome (Fig. 1C). The attenuation of Casp1 and IL-1β secretion by PVC-CM was further confirmed by ELISA (Fig. 1D and 1E). Similarly, PVC-CM attenuated inflammasome activation and IL-1β secretion in mouse peritoneal macrophages (Fig. 2A and 2B). Furthermore, PVC-CM treatment significantly reduced Caps1 activity without affecting cell survival (Fig. 2C and 2D). These results suggest that PVCs have anti-inflammatory activity through the suppression of inflammasome activation, which is a conserved mechanism in human and murine macrophages.
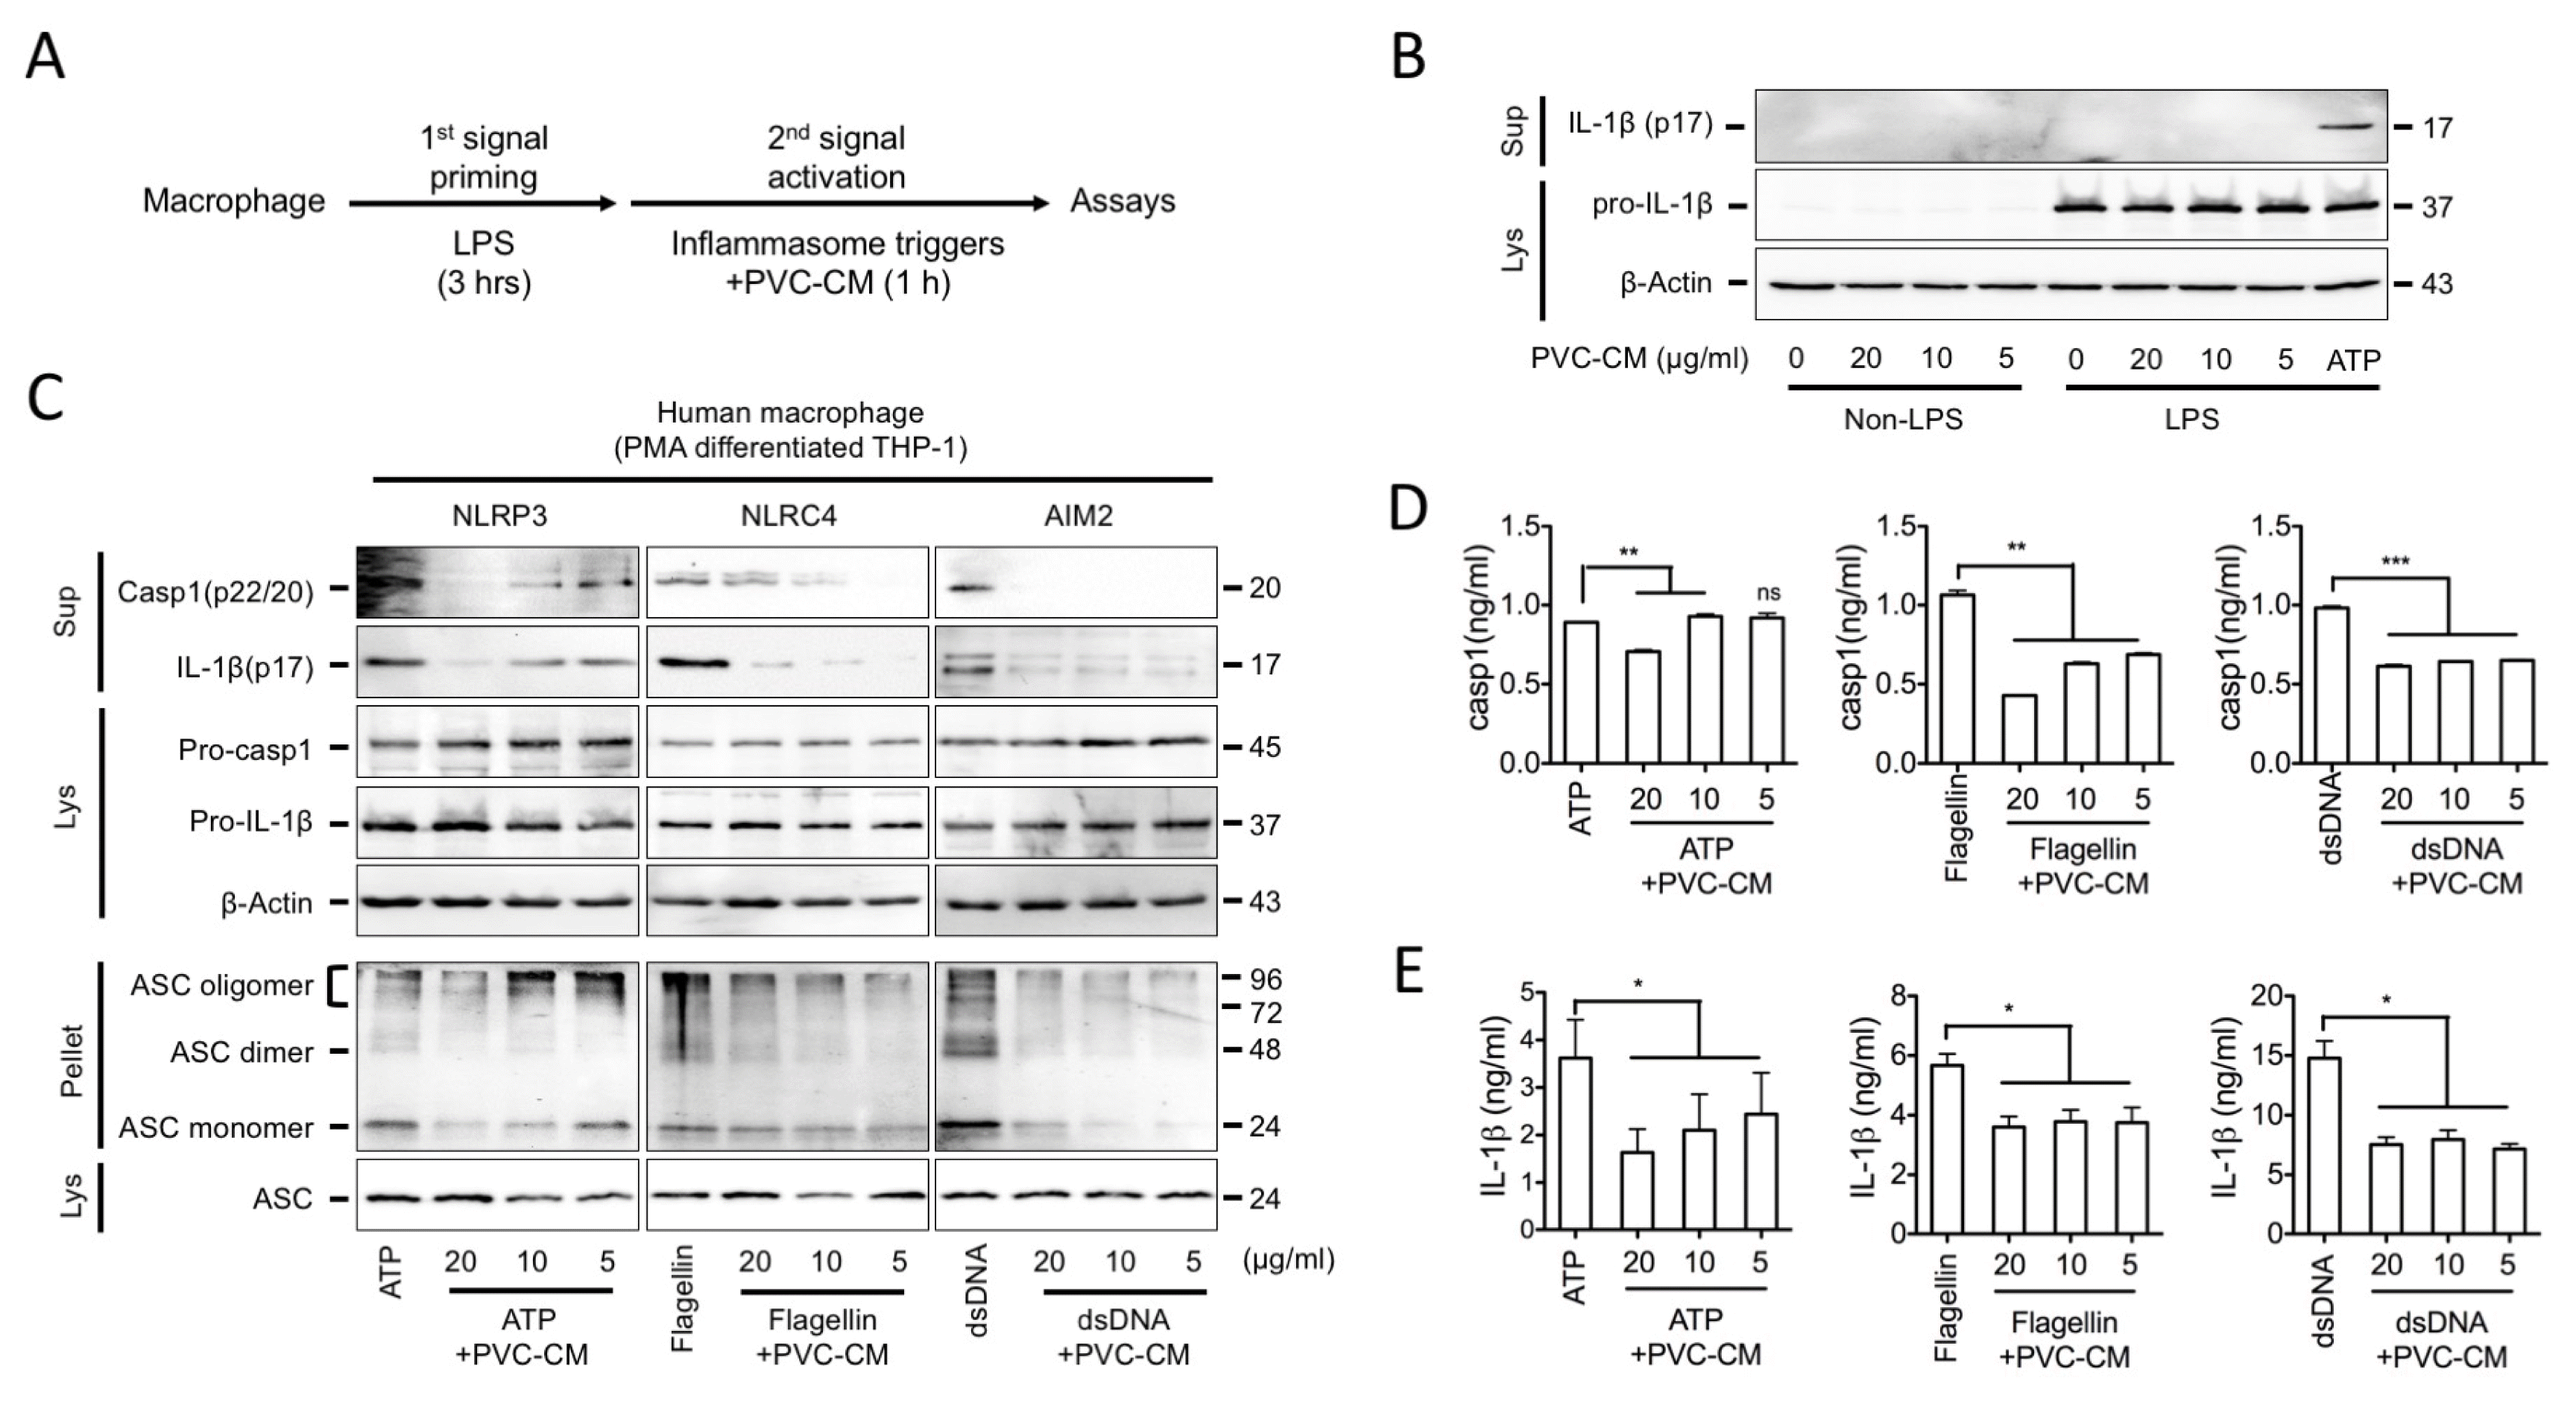 | Fig. 1The inhibitory effect of PVC-CM on inflammasome activation in human macrophage. PMA-differentiated THP-1 cells were primed with LPS (1 μg/ml) in RPMI medium containing 10% FBS and antibiotics for 3 h, followed by incubation with inflammasome activators for 1 h. (A) Schematic diagram of steps involved in the process of inflammasome activation. (B) Cells were cultured in RPMI media containing the indicated concentration of PVC-CM or ATP (2 mM) as a positive control for 1 h. IL-1β secretion was analyzed by immunoblotting. (C) PMA-differentiated THP-1 cells were treated with ATP (2 mM), flagellin (0.5 μg/ml), or dsDNA (2 μg/ml) for 1 h in the presence of PVC-CM. Cellular supernatant (Sup), lysate (Lys) and cross-linked pellets (Pellet) from whole-cell lysates were analyzed with the indicated anti-sera in an immunoblot assay. (D, E) Secreted caspase-1 and IL-1β were quantitated by an ELISA-based assay kit and the data are presented as bar graphs. Error bars indicate SD (*p<0.05, **p<0.01, ***p<0.001).
|
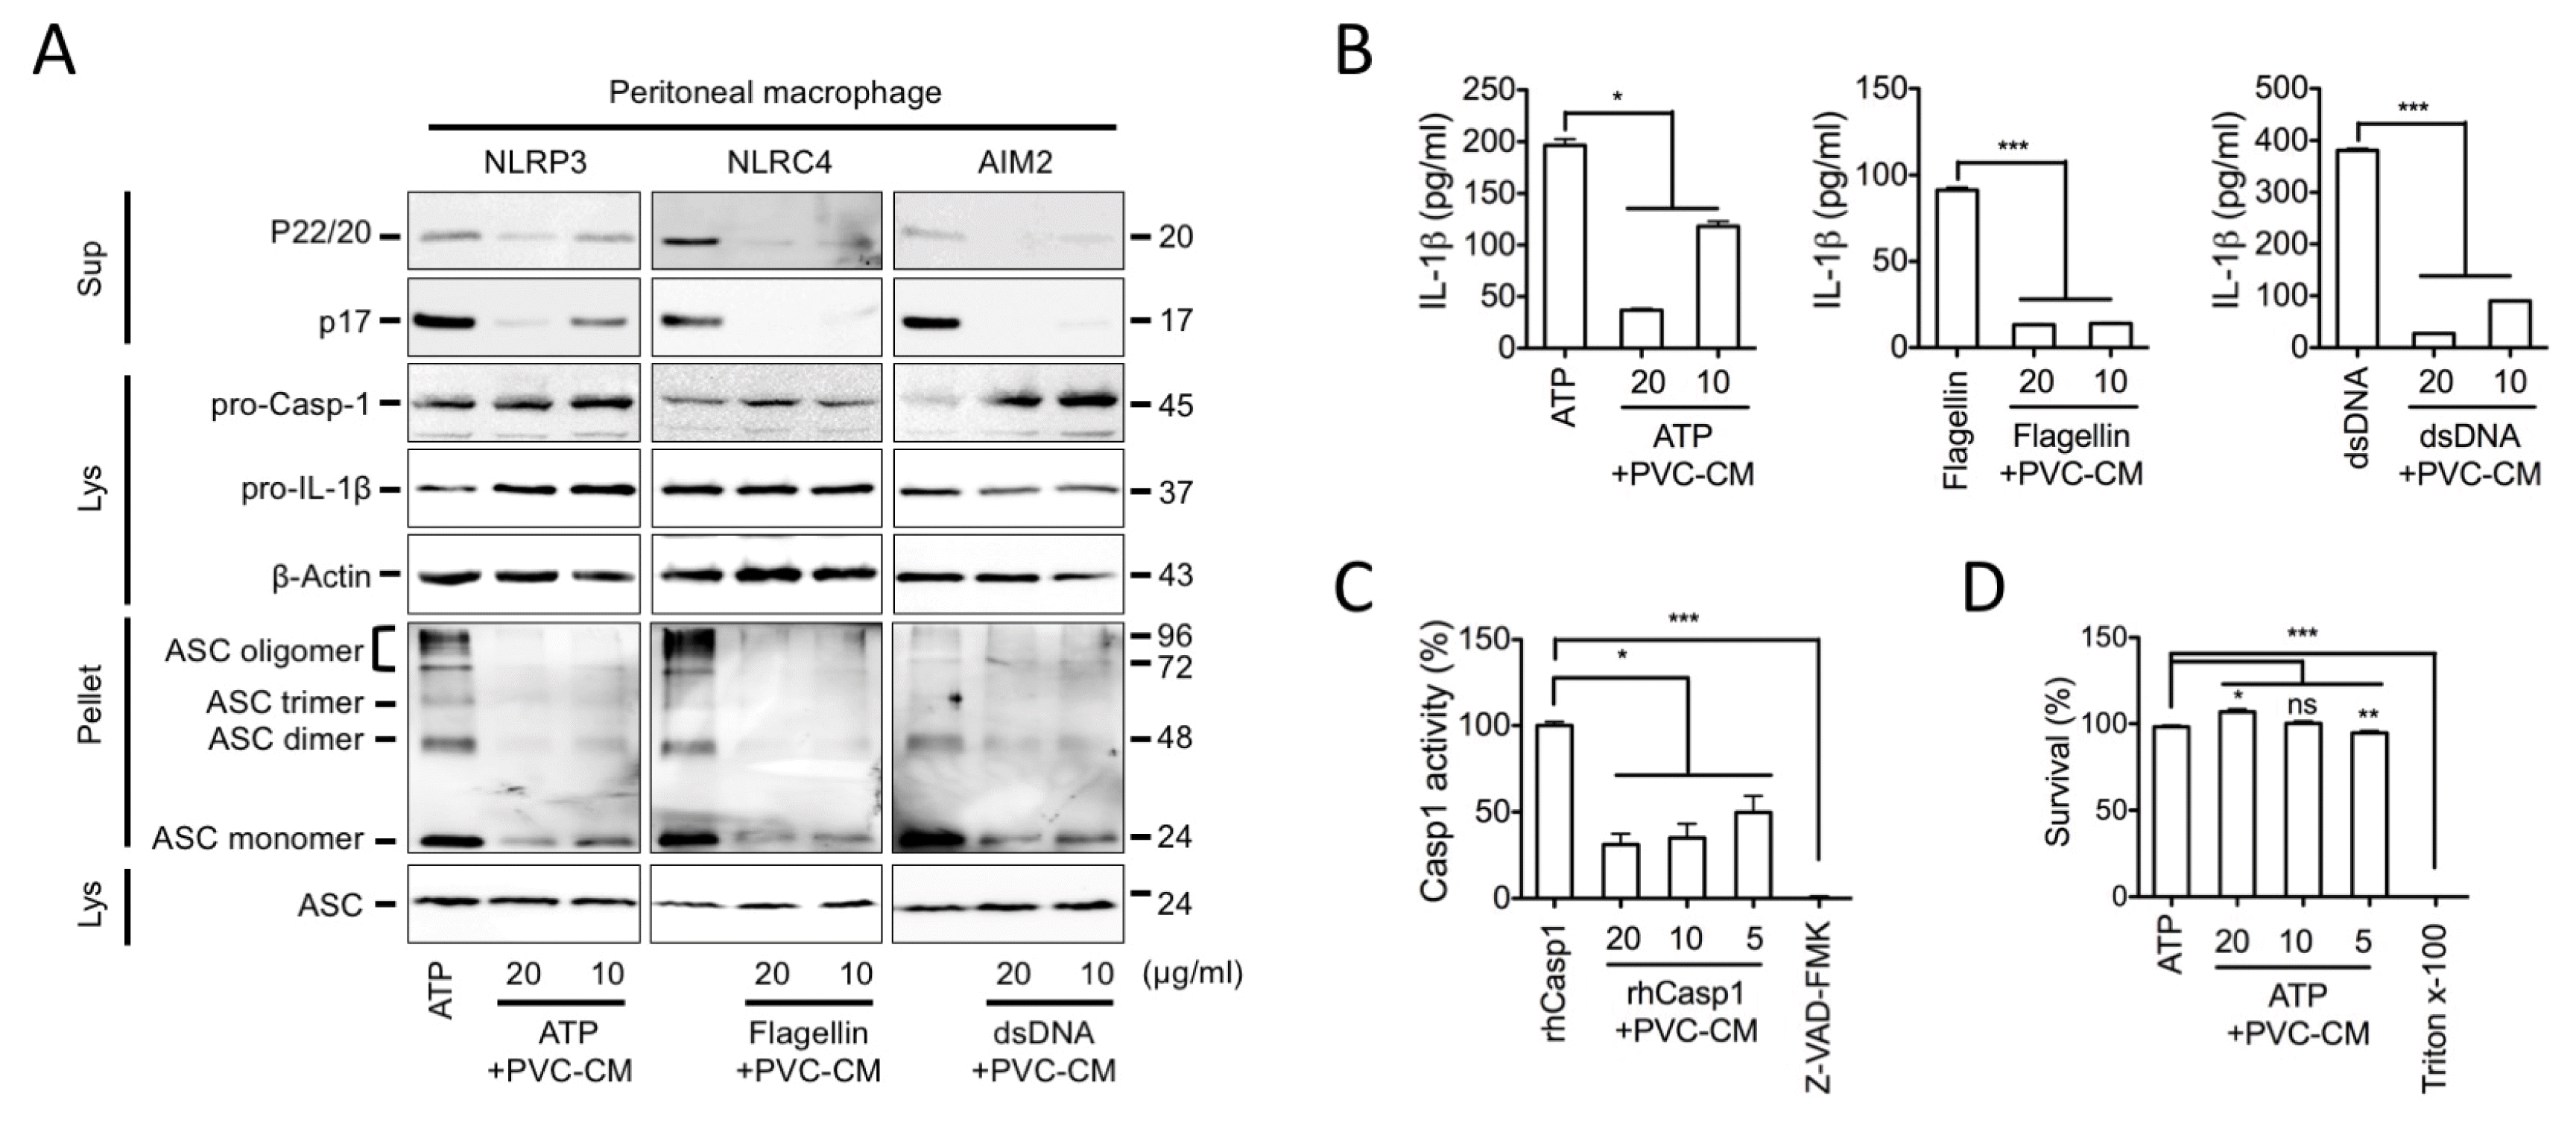 | Fig. 2PVC-CM inhibits the inflammasomes activation and caspase-1 activity in mouse peritoneal macrophage. Peritoneal macrophages were isolated, primed with LPS for 3 h, and subjected to the indicated inflammasome triggers in the present of PVC-CM. (A) Sup, Lys, and Pellet from whole-cell lysates were analyzed for caspase-1, IL-1β, or ASC pyroptosome by immunoblot assay. (B) Supernatant mouse IL-1β levels were measured by ELISA. (C) rhCasp1 was incubated with its substrate (YVAD-pNA) in the presence of PVC-CM as indicated. Relative Casp1 activity in the reaction without the rhCasp1 was set as 0% and that in the reaction with Casp1 and YVAD-pNA without PVC-CM was set as 100%. Z-VAD indicates Z-VAD-FMK, a pan-caspase inhibitor. (D) The cytotoxicity of PVC-CM was measured after applying the indicated dosage of PVC-CM to PMA-differentiated THP-1 for 1 h, identical with the inflammasome-activating step. The survival rate of the Triton-treated group was set as 0% and that of the non-treated group was set as 100%. Error bars indicate SD (*p<0.05, **p<0.01, ***p<0.001).
|
PVC-CM relieves inflammation and ER stress in macrophages of MSU-induced peritonitis
To determine whether PVCs are able to control inflammation through inflammasome activation in vivo, we evaluated the expression of inflammasome components and inflammatory cytokines in macrophages of experimental peritonitis model (Fig. 3A). Initially, we evaluated the total white blood cell count in peritoneal fluid from control- and inflamed mice, which reflects inflammation and the associated potential for tissue damage. As shown in Fig. 3B and 3C, MSU enhanced the total number of peritoneal exudate cells (PECs) and the infiltration of macrophages into the peritoneum, and this was significantly inhibited by PVC-CM treatment. In addition, the elevated expression levels of inflammatory cytokines (IL-1α and IL-1β), inflammasome components (NLRP3 and Casp1), and ER stress-related genes were significantly down-regulated in peritoneal macrophages of PVC-treated peritonitis mice compared to MSU-treated controls (Fig. 3D and 3E). These results suggest that PVCs can suppress inflammatory responses and ER stress by controlling the migration and activation of macrophages, and may be therapeutically useful for the treatment of inflammatory diseases.
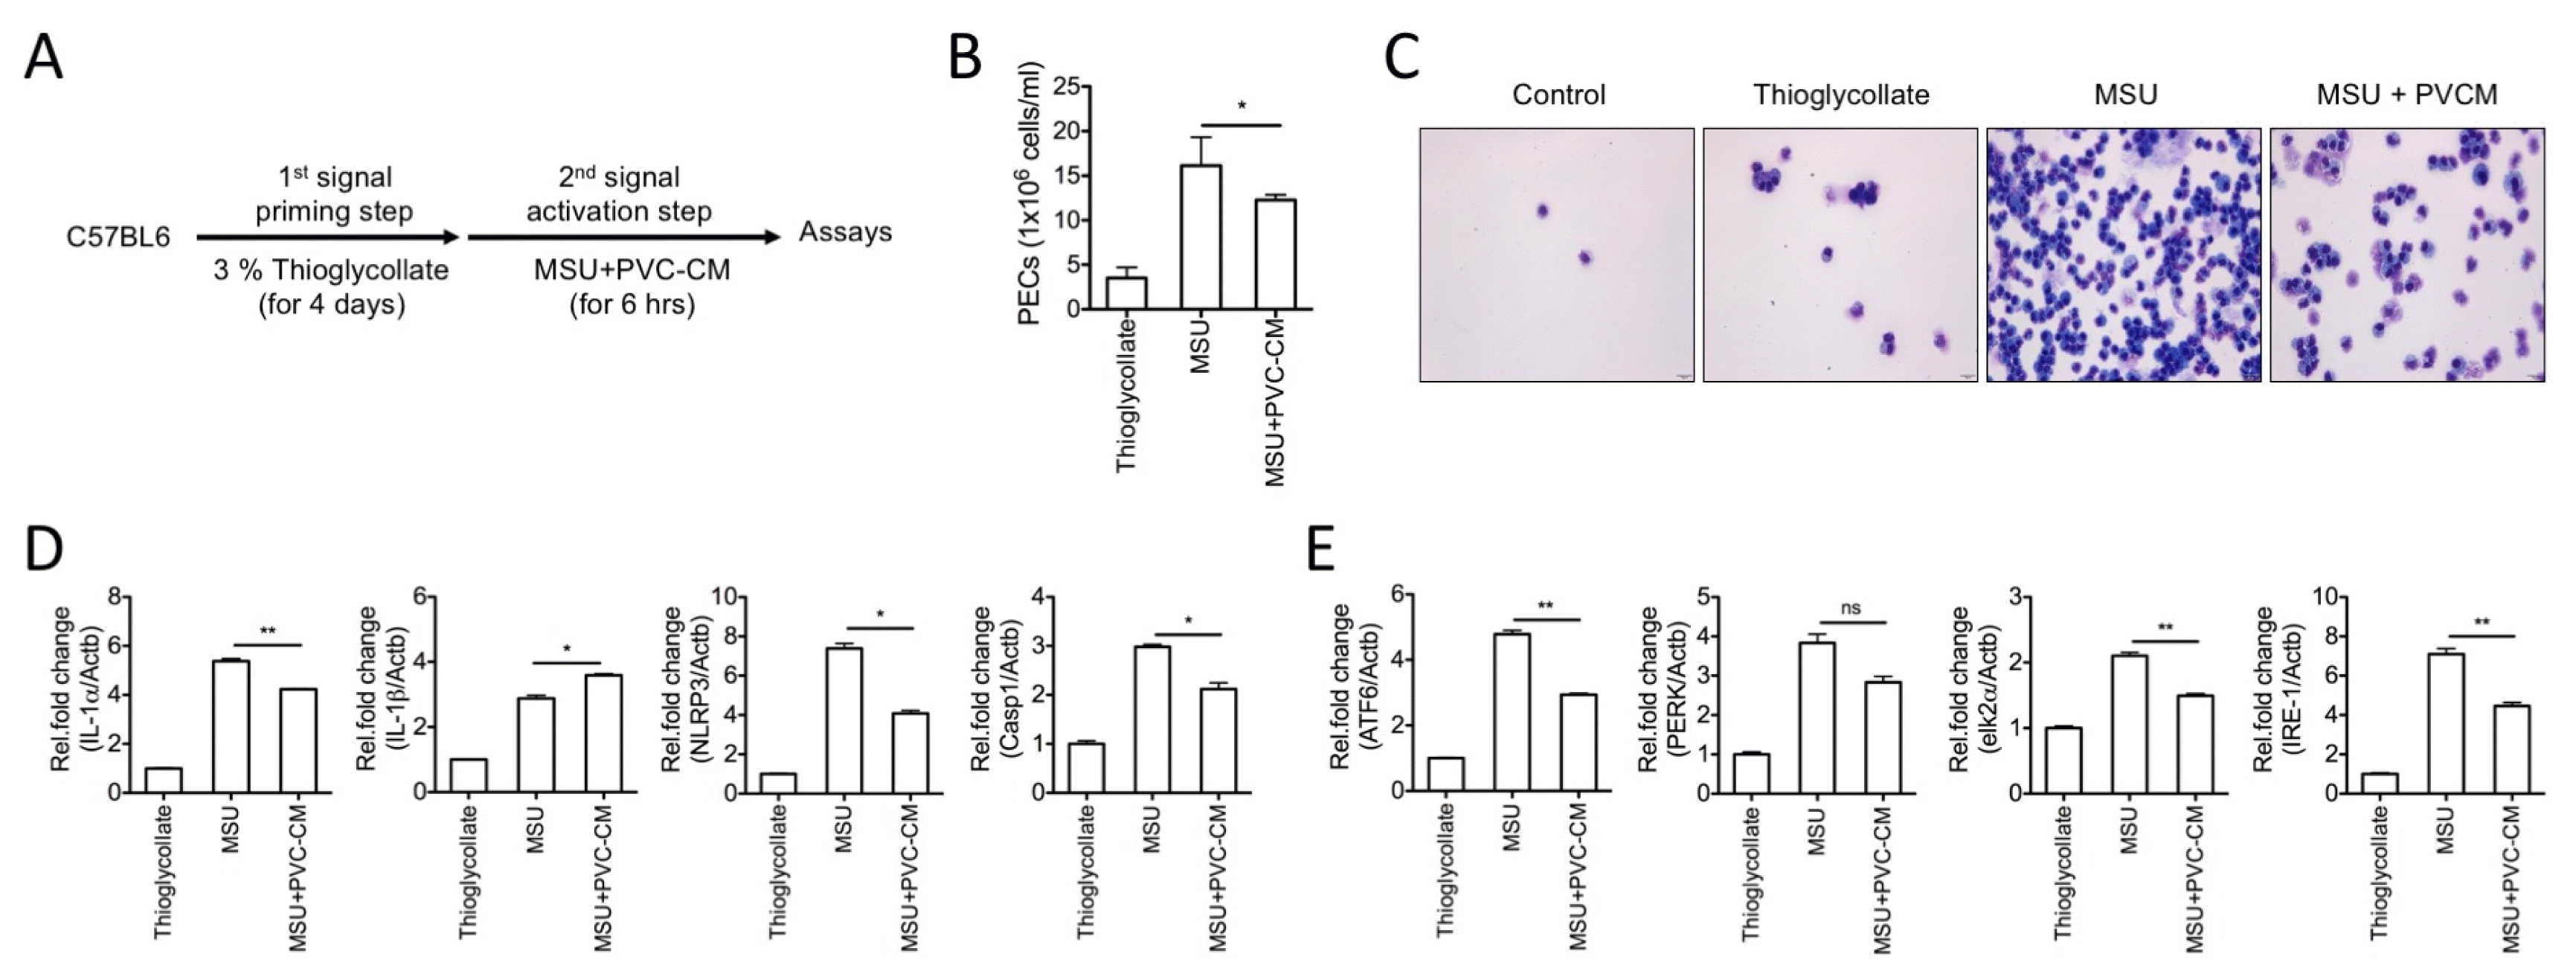 | Fig. 3PVC-CM reduces inflammation and ER stress in in macrophages of MSU-induced peritonitis. (A) Schematic diagram of experiments using the peritonitis mouse model (n=8 per group). (B) PECs were determined by counting exudate cells with a cell counter. (C) Cytospins of isolated PECs were stained with Wright-Giemsa stain. (D, E) Relative mRNA levels of inflammatory (IL-1α, IL-1β, NLRP3, and Casp1) and ER stress-related genes (ATF6, PERK, elk2α, and IRE-1) were analyzed using SYBR green-based quantitative real-time PCR. Error bars indicate SD (*p<0.05, **p<0.01).
|
PVC-CM treatment reduces IL-1β secretion in human macrophages through regulation of serpin E1 and angiogenin secretion
To identify which soluble factors play roles in the regulation of inflammatory responses and inflammasome activation, a human cytokine array was performed with the supernatant of human macrophage cultures treated with either PVC-CM alone or with ATP in the presence and absence of PVC-CM. The results identified serpin E1 and angiogenin as predominant candidates (Fig. 4A), and their association with the suppression of inflammation and inflammasome activation was investigated in human macrophages either at the LPS priming step or at the ATP licensing step. Treatment with serpin E1 or angiogenin significantly reduced the secretion of IL-1β in human macrophages (Fig. 4B and 4C). However, angiogenin had no effect on the activity of Casp1, whereas high-dose serpin E1 treatment significantly inhibited Casp1 activity (Fig. 4D). These results suggest that PVCs control inflammation in macrophages through the regulation of serpin E1 and angiogenin secretion.
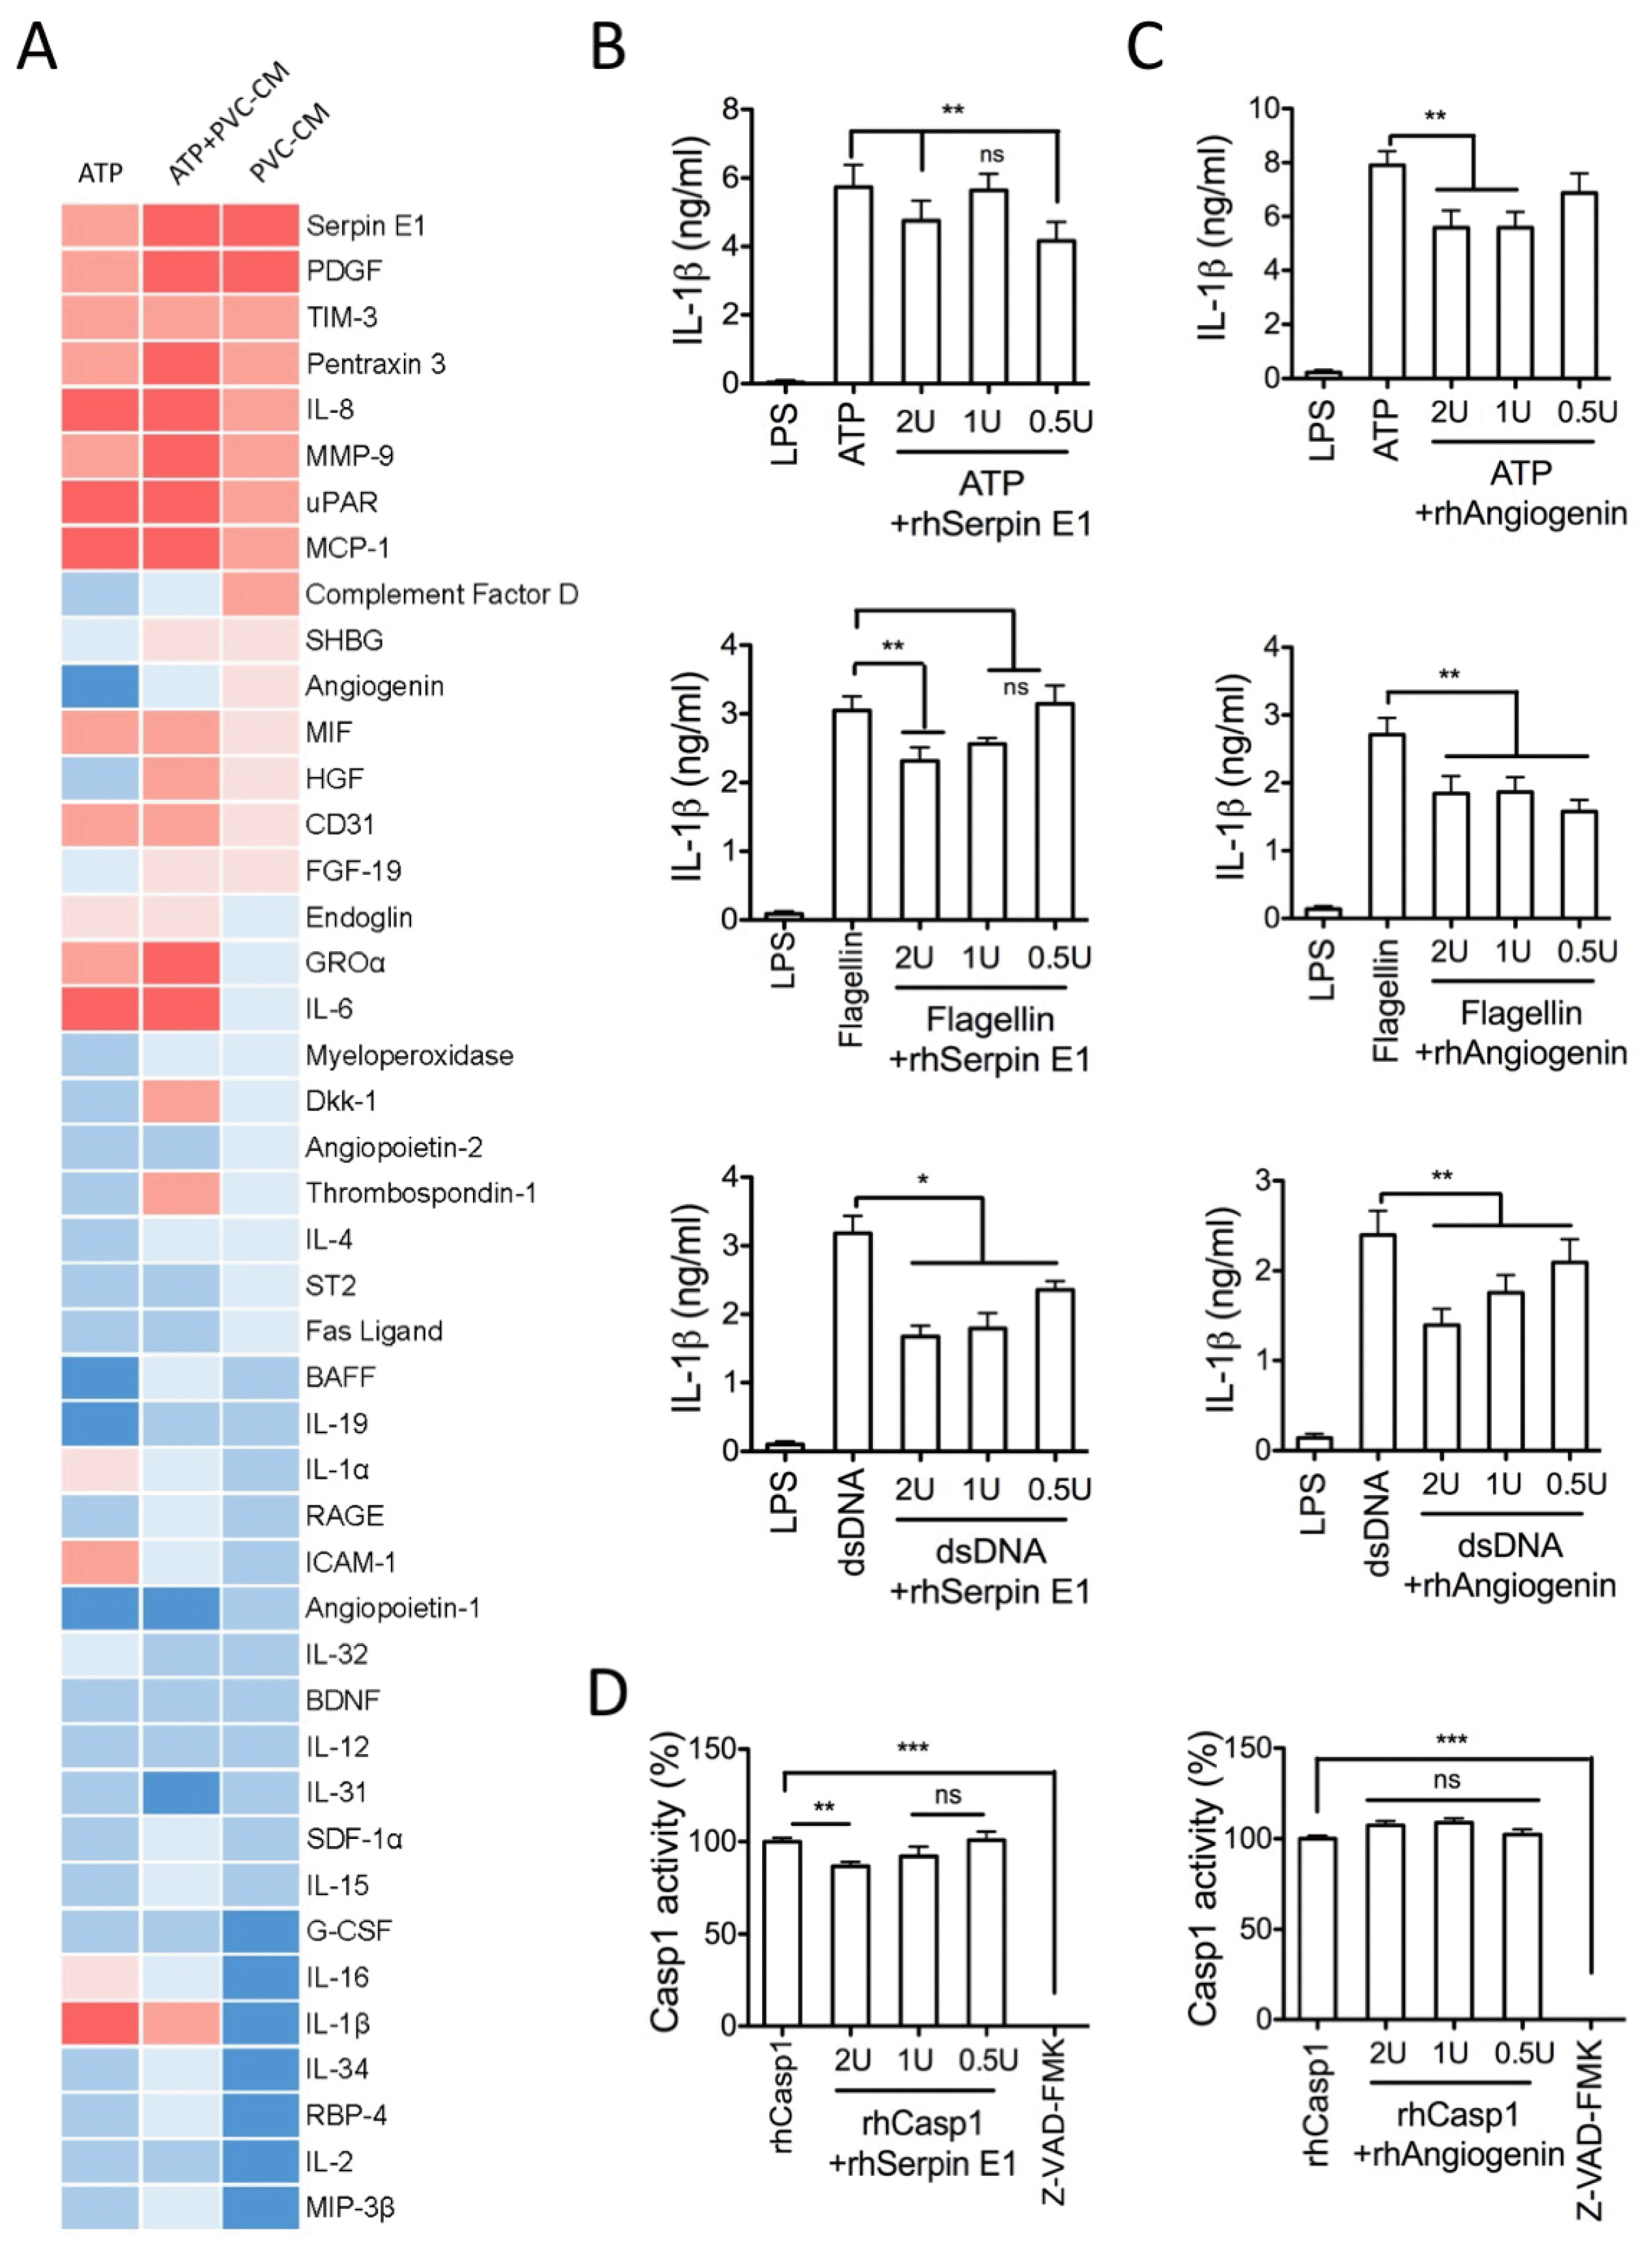 | Fig. 4Secretome analysis. Proteome profiler arrays were evaluated as described in Methods. (A) The heat map represents the subsequent image analysis and quantification of pixel intensity for each spot. (B, C) LPS-primed THP-1 cells treated with inflammasome triggers in the absence or presence of rhSerpin E1 or rhAngiogenin for 1 h. IL-1β levels in the supernatants were measured by ELISA. (D) Caspase-1 activity was determined by colorimetric assay. Error bars indicate SD (*p<0.05, **p<0.01, ***p<0.001).
|
PVC-CM suppresses NLRP3 inflammasome activation through mitochondrial ROS production in macrophages
Activation of the NLRP3 inflammasome is positively regulated by a common pathway of ROS (17). Thus, we asked whether PVC-CM, serpin E1, and angiogenin have a suppressive effect on NLRP3 inflammasome activation via regulation of mitochondrial ROS. We first examined the effects of DPI, an inhibitor of mitochondria-derived and NOX-dependent ROS production, on IL-1β release in human macrophages stimulated with ATP. As expected, IL-1β expression was blocked in DPI-treated macrophages stimulated with ATP (Fig. 5A). Similarly, PVC-CM also inhibited IL-1β expression in macrophages with rotenone-induced NLRP3 activation (Fig. 5B). We further confirmed, using luminescence and confocal analysis, that PVC-CM and angiogenin significantly attenuated the production of mitochondrial ROS resulting from rotenone treatment in human macrophages, whereas serpin E1 had no effect on ROS production (Fig. 5C and 5D). Collective ly, these results suggest that PVC-mediated ROS inhibition may suppress the activation of the NLRP3 inflammasome.
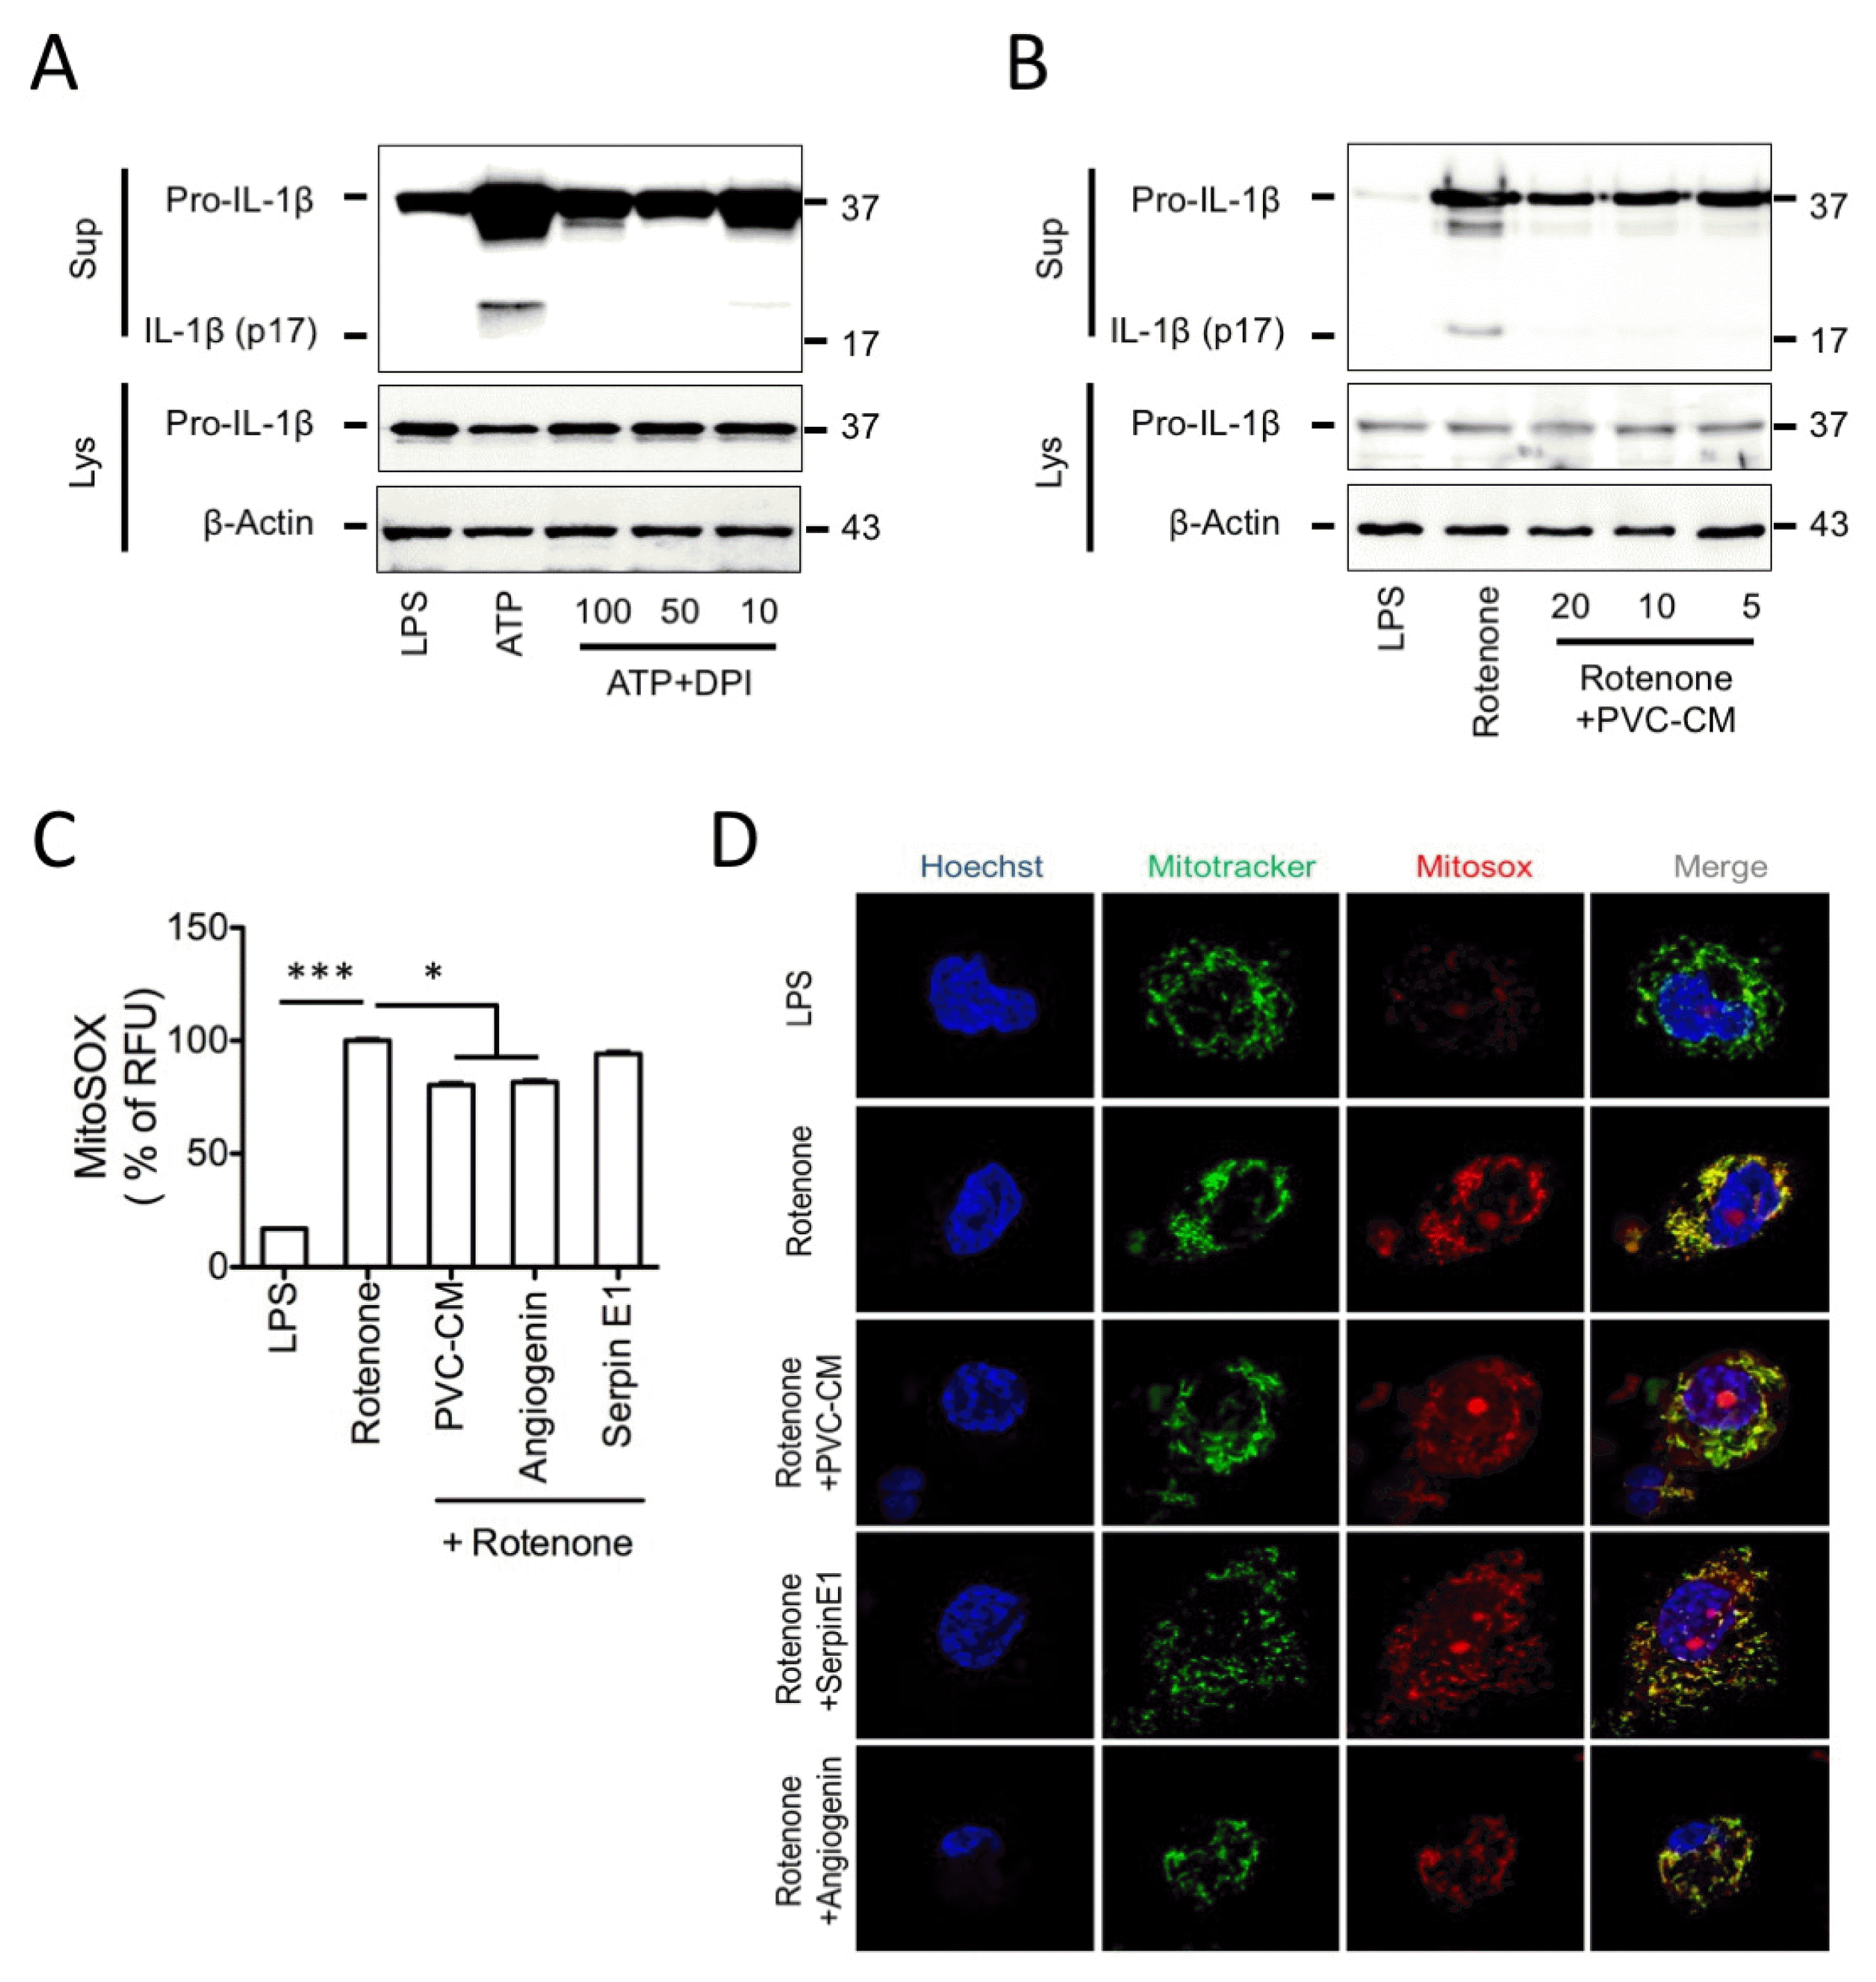 | Fig. 5The Mechanism underlying the inhibitory effect of PVC-CM on NLRP3 inflammasome via mitochondrial ROS generation. (A) LPS-primed THP-1 cells treated with ATP (2 mM) and the indicated DPI (100 to 10 μM) for 1 h. Sup and Lys were analyzed by immunoblot using the indicated anti-sera. (B) LPS-primed THP-1 cells were treated with rotenone (20 μM) and the indicated dosages of PVC-CM for 6 h, after which mitochondrial ROS generation was analyzed by immunoblot. (C) Mitochondrial ROS (MitoSOX) were quantified using a fluorometric microplate reader. (D) Relative fluorescence intensities of Mito Tracker (mitochondria) and MitoSOX (mitochondrial ROS) were analyzed using confocal microscopy. Hoechst was used for nuclear staining. Error bars indicate SD (*p<0.05, **p<0.01, ***p<0.001).
|
Go to :
Discussion
Multipotent PVCs have a definite advantage in being used for the treatment of various diseases and regulation of the tissue microenvironment. Recent studies have indicated that PVC deficiency is associated with irreversible blood retina barrier breakdown and initiates sustained inflammation, thereby indicating the pathological role of PVCs in various disorders such as diabetes, Alzheimer’s or ischemic tissues injuries (18). In addition, a recent report showed that PVCs control inflammatory and fibrotic responses to tissue injury via regulation of MyD88 and IRAK4 expression (19). Although the greater therapeutic potential of PVCs compared to BM- and AD-MSCs has been well demonstrated in various diseases, the regulatory role of PVCs on inflammasome activation during macrophage-mediated inflammatory responses has not been investigated. In the present study, we demonstrated that PVCs derived from HUC had potent inhibitory activity on inflammation and inflammasome activation in macrophages using in vitro and in vivo models. Our results are consistent with previous studies suggesting that MSCs attenuate the NLRP3 inflammasome via mitochondrial ROS damage (20). Similarly, our findings showed that the PVC-CM reduced Casp-1-dependent IL-1β secretion via inactivation of the NLRP3 inflammasome as well as the NLRC4 and AIM2 inflammasomes, suggesting that it acts on the upstream of ASC oligomerization to suppress a direct indicator of inflammasome activation. Furthermore, PVC-CM had inhibitory effects on mitochondrial ROS production, which is a critical step or upstream event for NLRP3 activation. Taken together, the PVC secretome might be a versatile tool to study inflammasome biology and may prove therapeutically useful for the treatment of inflammatory diseases.
In this study, secretome analysis revealed angiogenin as a potential molecule regulating inflammatory responses and ROS production. Angiogenin has been well characterized as a angiogenic factor in tumor growth and is induced by other angiogenic factors including vascular endothelial growth factor and epidermal growth factor (21). Angiogenin was also detected in the secretomes of human MSCs and has been found to be important for enhancing the regenerative potential of MSCs in various diseases, as well as in repairing vascular injury (22–25). Moreover, several lines of evidence suggest that angiogenin is involved in the innate immune system and is associated with inflammatory activation. For example, Angiogenin exerts anti-inflammatory activity in TNF-α and LPS-inflamed human corneal fibroblasts by suppressing NF-κB nuclear translocation through the inhibition of TANK-binding kinase 1 expression (26). In addition, it has been reported that the protein level of angiogenin in serum is increased during inflammatory responses, which may support the anti-inflammatory role of angiogenin (27, 28). Although angiogenin has shown a variety of biological activities including anti-inflammatory and antiviral activities via different molecular pathways, the effects of angiogenin on inflammasome activation have not been investigated. Here, we have shown that angiogenin attenuates the secretion of IL-1β through the activation of the NLRP3 inflammasome as well as the production of mitochondrial ROS, suggesting a new perspective for the regulation of inflammasome activation in inflammatory diseases.
In our study, we employed a macrophage cell line, as well as macrophages harvested from mice with MSU-induced peritonitis, to evaluate the effects of PVC and angiogenin on NLRP3, NLRC4, or AIM2 inflammasome activation. Previous findings demonstrated that AD-MSCs ameliorate colitis by suppression of inflammasome complex formation, which is due to the M1-to-M2 macrophage transition and reduction in the total number of macrophages (10). In fact, the therapeutic effects of MSCs in various inflammatory disease models was attributed to M1 to M2 macrophage polarization and infiltration of macrophages to injury sites (29–31). Thus, further study is needed to confirm the anti-inflammatory capacity of PVCs and angiogenin in controlling the macrophage population. In the present study, we found that PVC secretome effectively reduced the secretion of pro-inflammatory cytokines in human and murine macrophages by suppressing inflammasome activation. We further demonstrated that the PVC secretome significantly reduced inflammatory activity and endoplasmic reticulum (ER) stress in peritoneal macrophages. These results support that PVC secretome could act as a versatile tool to study inflammasome biology and for the treatment of inflammatory diseases.
Go to :
 XML Download