Journal List > Int J Stem Cells > v.12(2) > 1159023

Jeong, Shin, Lim, Kim, Kang, Yin, Kim, Kim, Kim, Kang, Shin, Choi, and Kim: Monitoring Glutathione Dynamics and Heterogeneity in Living Stem Cells

Abstract

Glutathione (GSH) is a major antioxidant in cells, and plays vital roles in the cellular defense against oxidants and in the regulation of redox signals. In a previous report, we demonstrated that stem cell function is critically affected by heterogeneity and dynamic changes in cellular GSH concentration. Here, we present a detailed protocol for the monitoring of GSH concentration in living stem cells using FreSHtracer, a real-time GSH probe. We describe the steps involved in monitoring GSH concentration in single living stem cells using confocal microscopy and flow cytometry. These methods are simple, rapid, and quantitative, and able to demonstrate intracellular GSH concentration changes in real time. We also describe the application of FreSHtracer to the sorting of stem cells according to their GSH content using flow cytometry. Typically, microscopic or flow cytometric analyses of FreSHtracer and MitoFreSHtracer signals in living stem cells take ~2~3 h, and the fractionation of stem cells into subpopulations on the basis of cellular GSH levels takes 3~4.5 h. This method could be applied to almost every kind of mammalian cell with minor modifications to the protocol described here.

Introduction

Glutathione (GSH) is the most abundant non-protein thiol in cells, being present at a concentration of 1~10 mM. It plays a central role in the cellular defense against reactive oxygen species (ROS), such as hydroperoxides and free radicals, and in the regulation of redox signals (1). GSH is produced in the cytoplasm and transferred to subcellular organelles, such as mitochondria and the nucleus, where the GSH redox buffering system is required. GSH detoxifies hydroperoxides, forming GSSG, an oxidized form of GSH, which is then reduced by glutathione reductase, which requires NADPH (2). Moreover, GSH regulates the intensity and duration of ROS-induced signals by modulating the redox status of thiol groups on the amino acid cysteine in various signaling proteins (3). Therefore, GSH concentration is an important marker of redox capacity and redox signal transduction in cells. Abnormal intracellular GSH concentrations, which result from alterations in its synthesis, metabolism, or homeostasis, can result in a number of diseases and accelerated aging (4).
Cellular redox status affects the core functions of stem cells (SCs), including their self-renewal capacity, pluripotency, viability, and genomic stability. For example, an increase in ROS suppresses self-renewal activity, committing SCs to differentiate into various mature cell types (5). Moreover, the fact that SCs reside within hypoxic niches and rely upon anaerobic glycolysis to reduce ROS production is consistent with the importance of redox homeostasis in the preservation of the self-renewal capacity of SCs (68). However, detailed mechanistic investigations of the role of GSH in SC function have been limited by lack of a direct and reliable tool for the real-time monitoring of dynamic changes in the GSH content of SCs. Recently, we developed the first reversible chemical probe for GSH, FreSHtracer (9, 10), and we have reported that cellular GSH concentrations are heterogeneous, varying according to cellular conditions, and affecting the in vitro function and therapeutic efficacy of SCs (10). Therefore, the assessment of GSH concentration in SCs should provide valuable information for the development of stem cell therapy.

Overview of the procedure

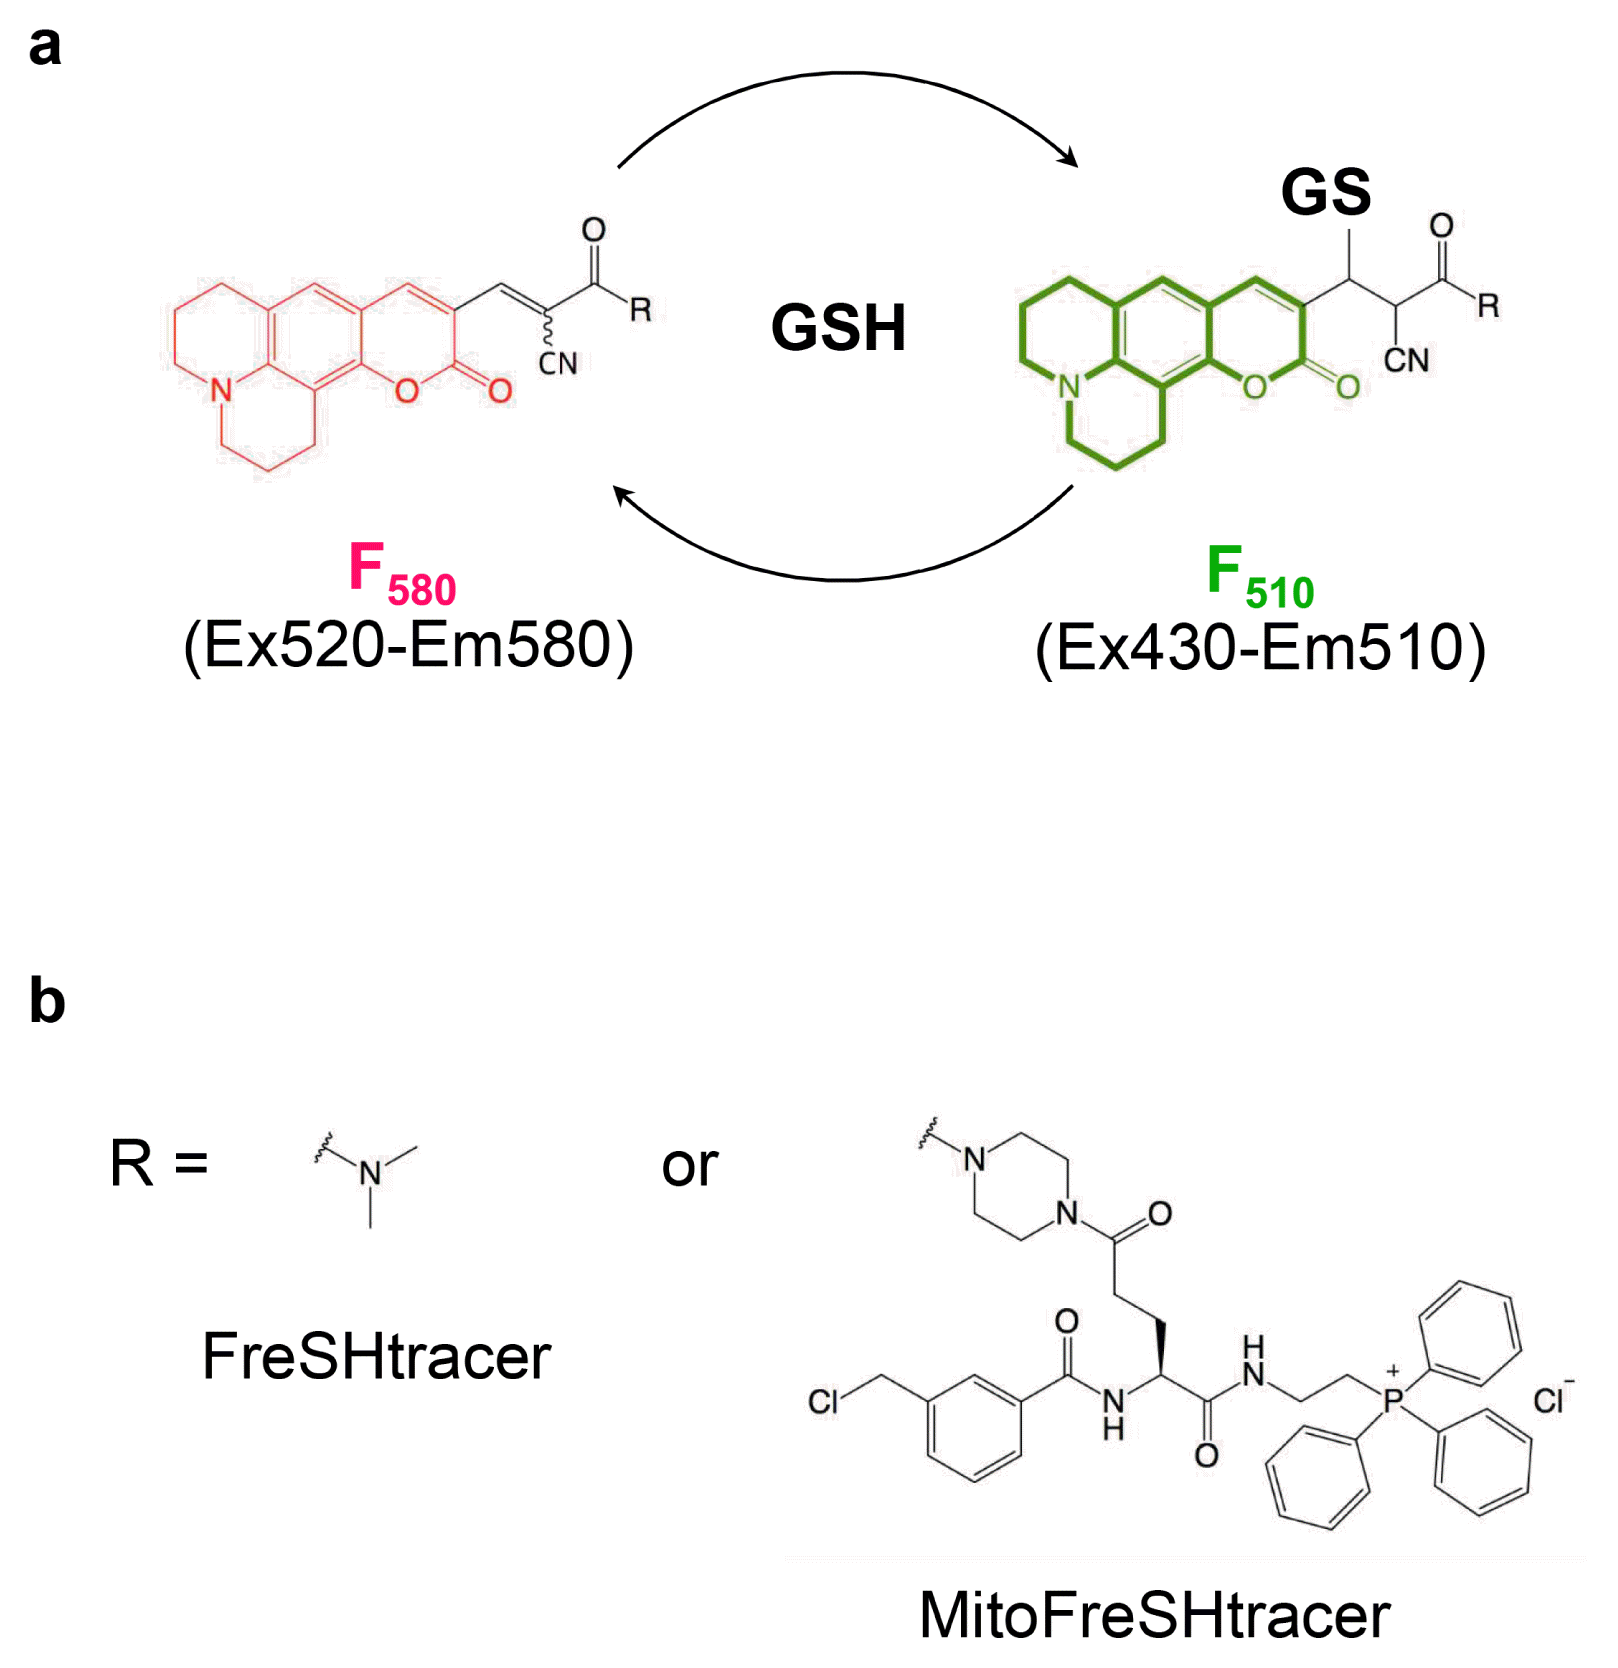
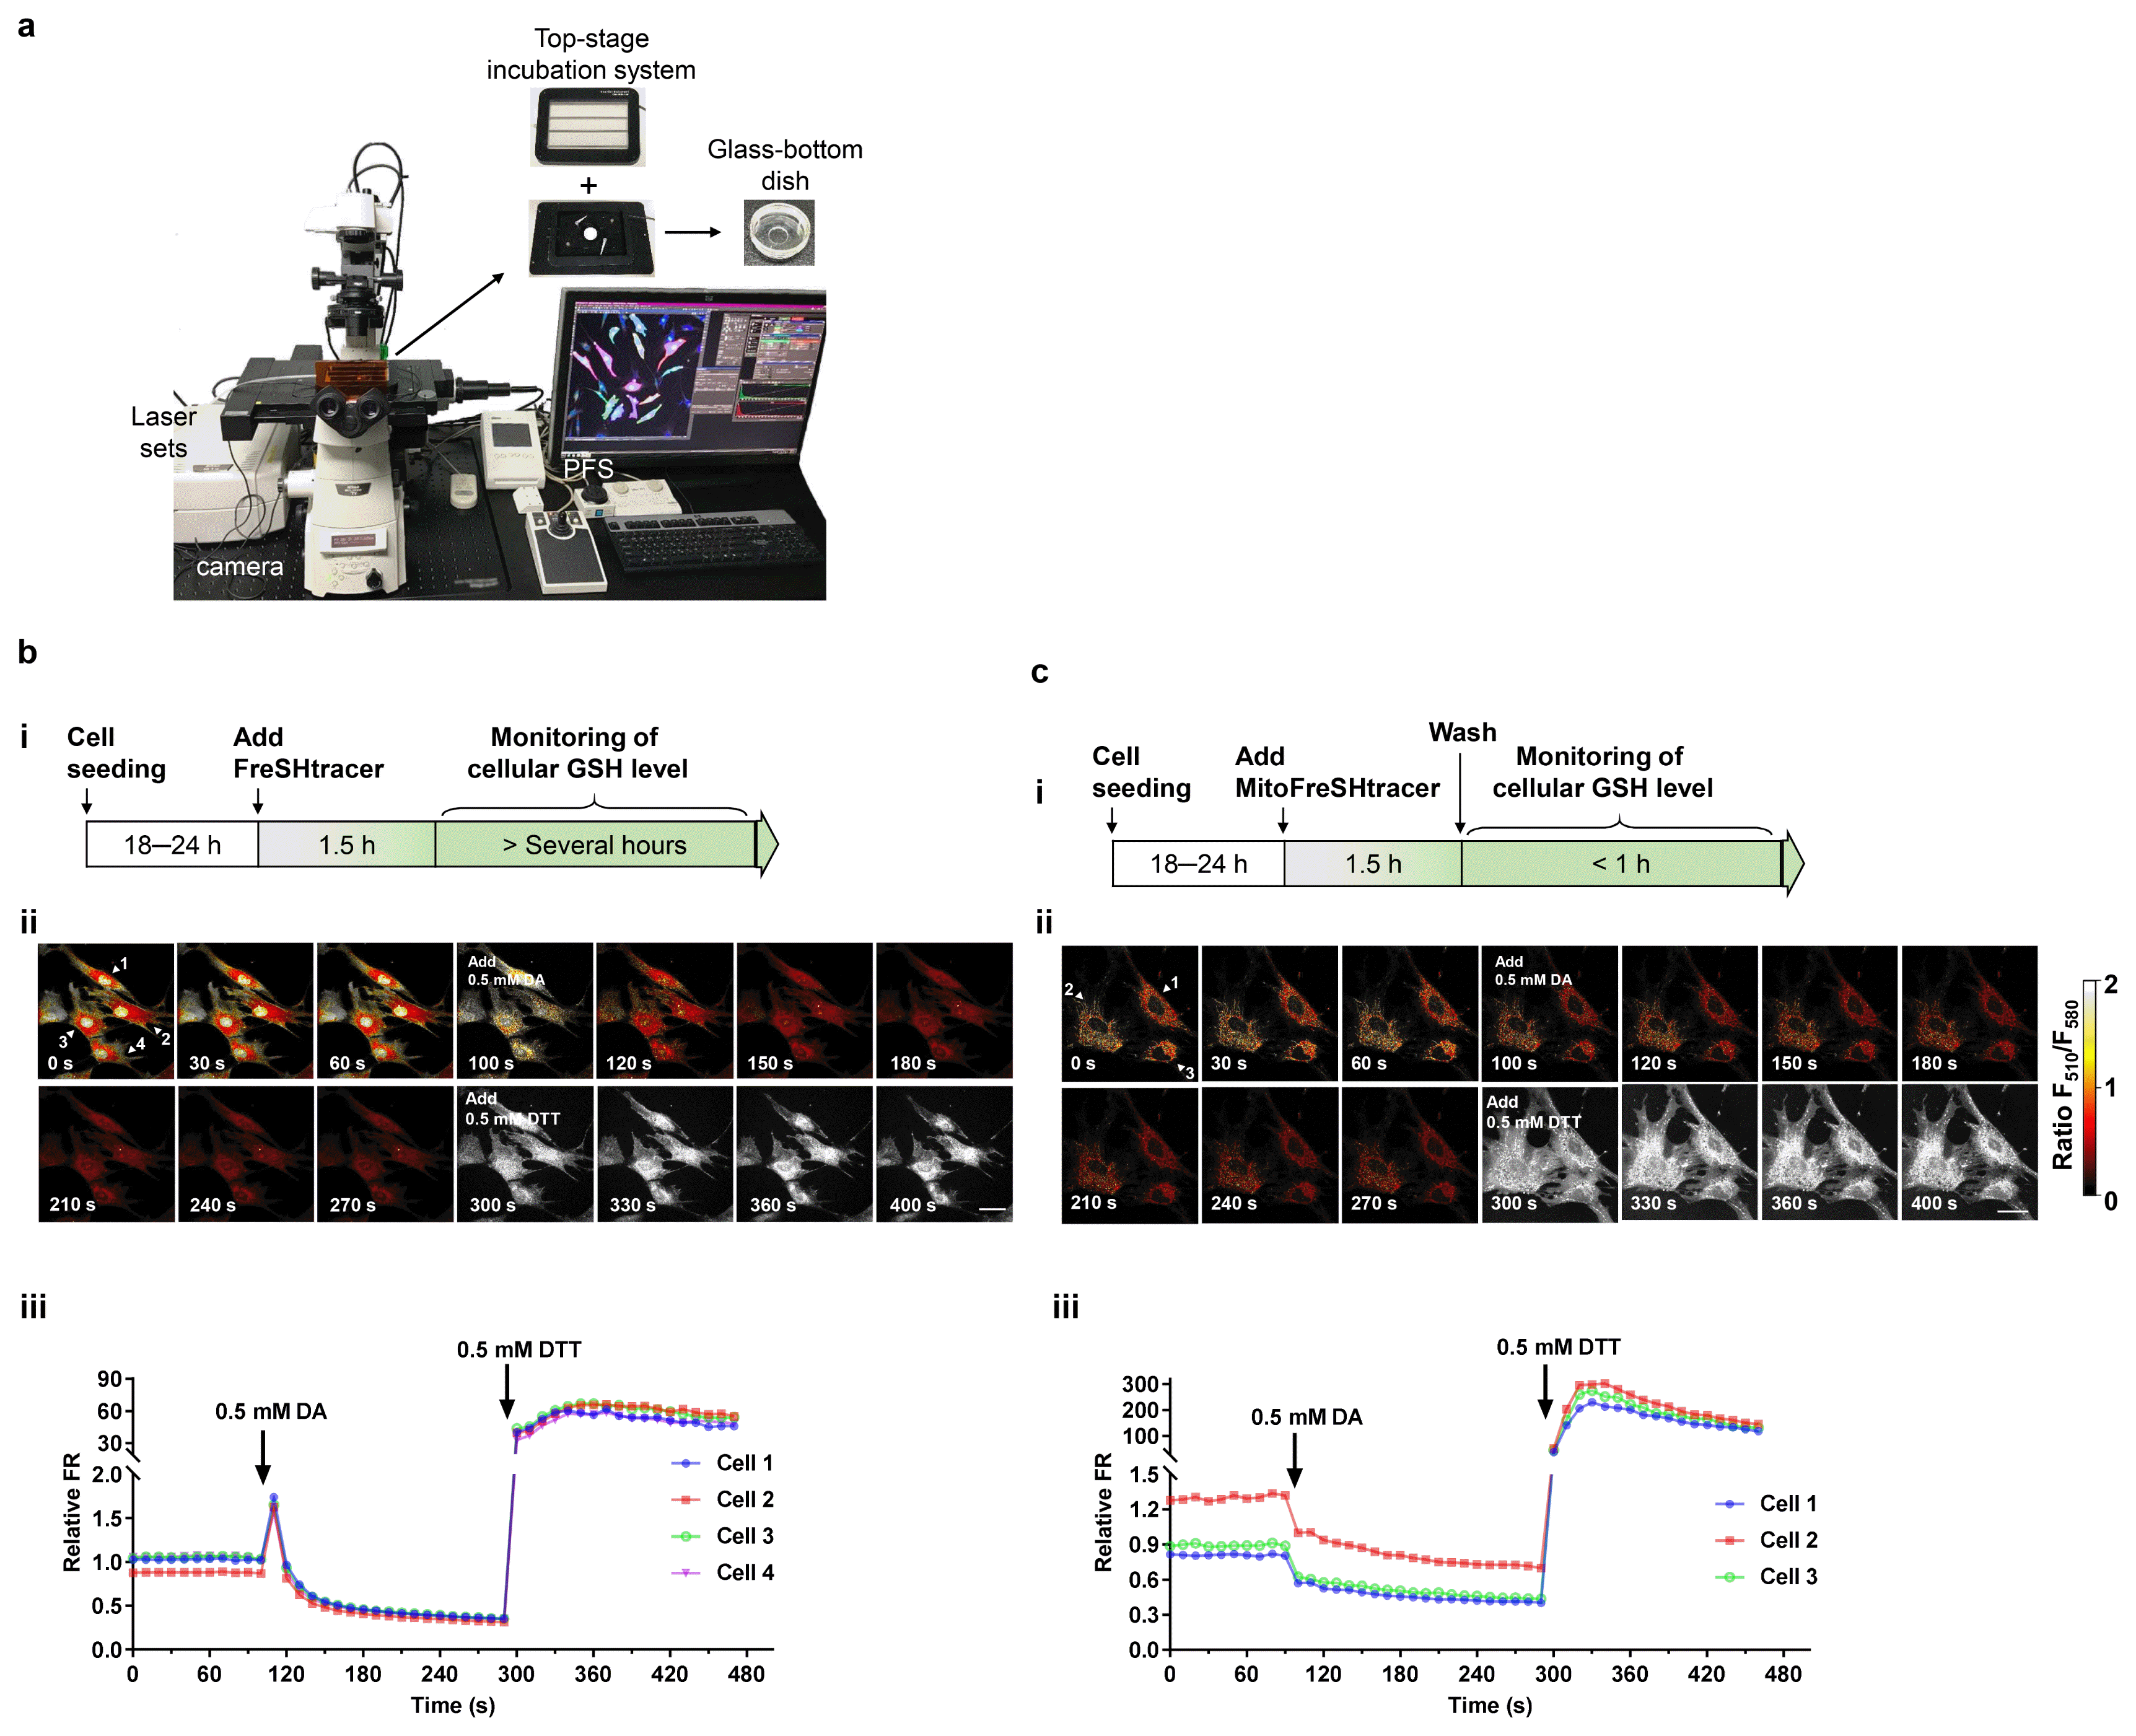
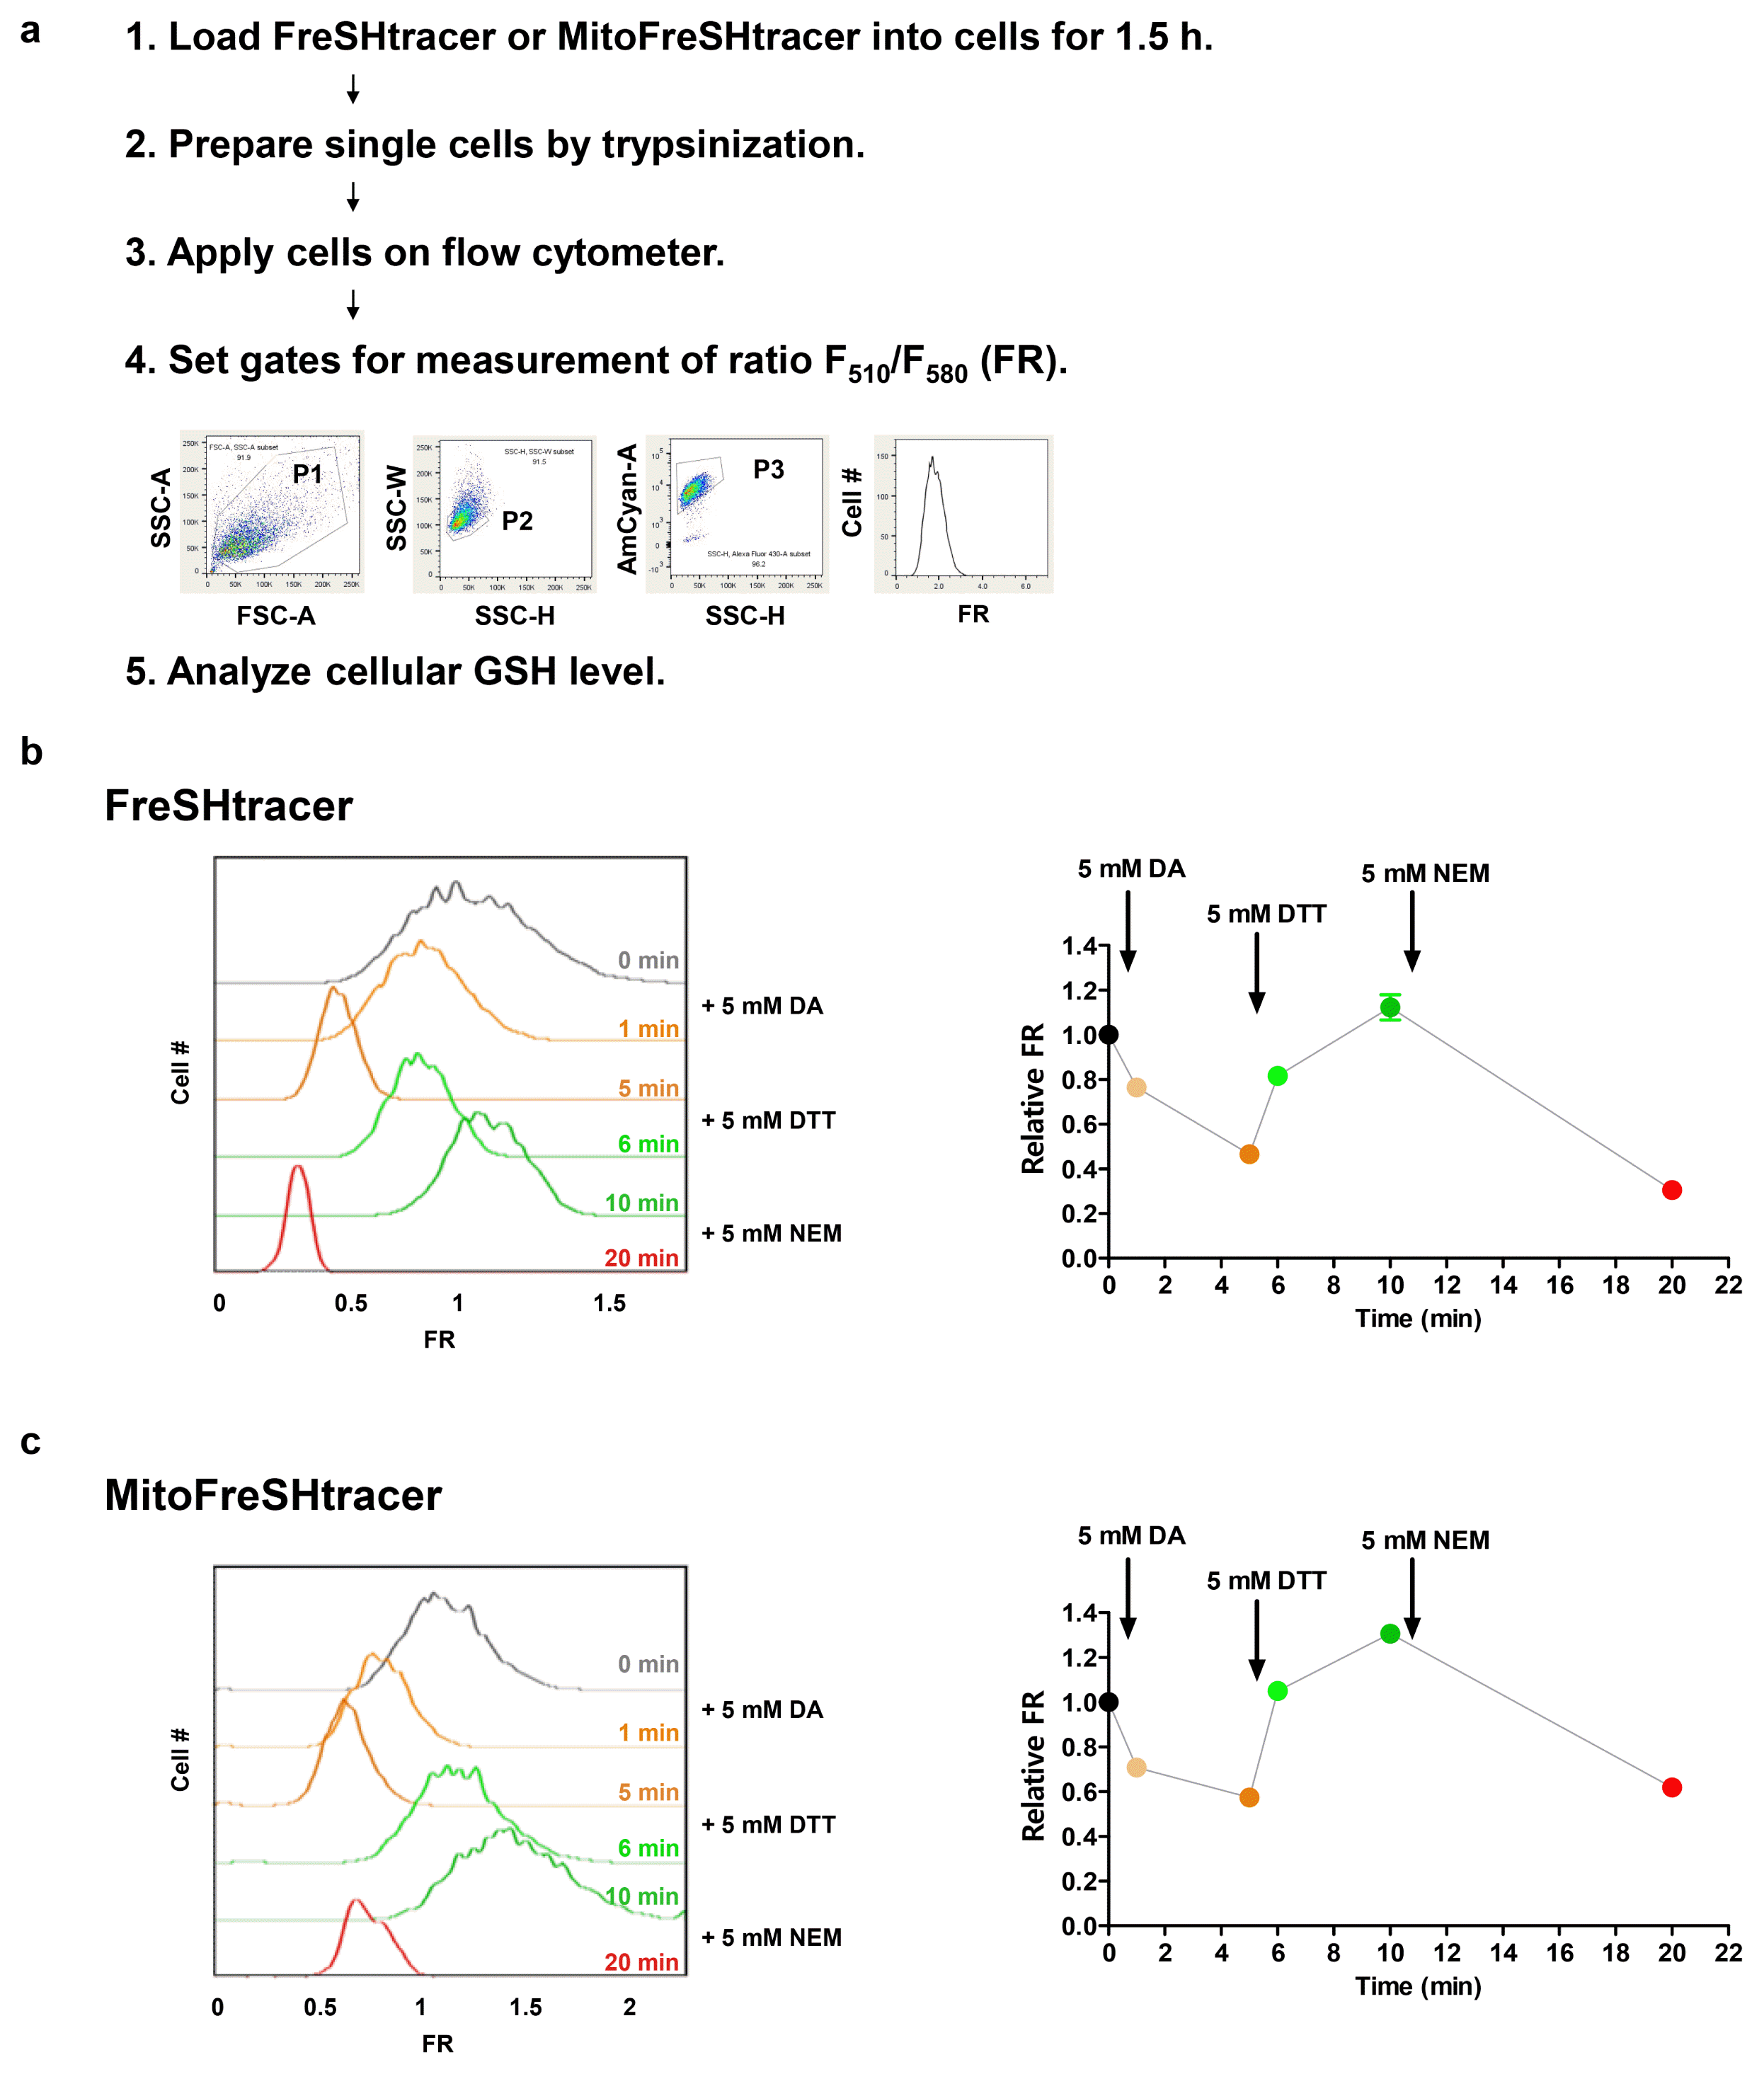
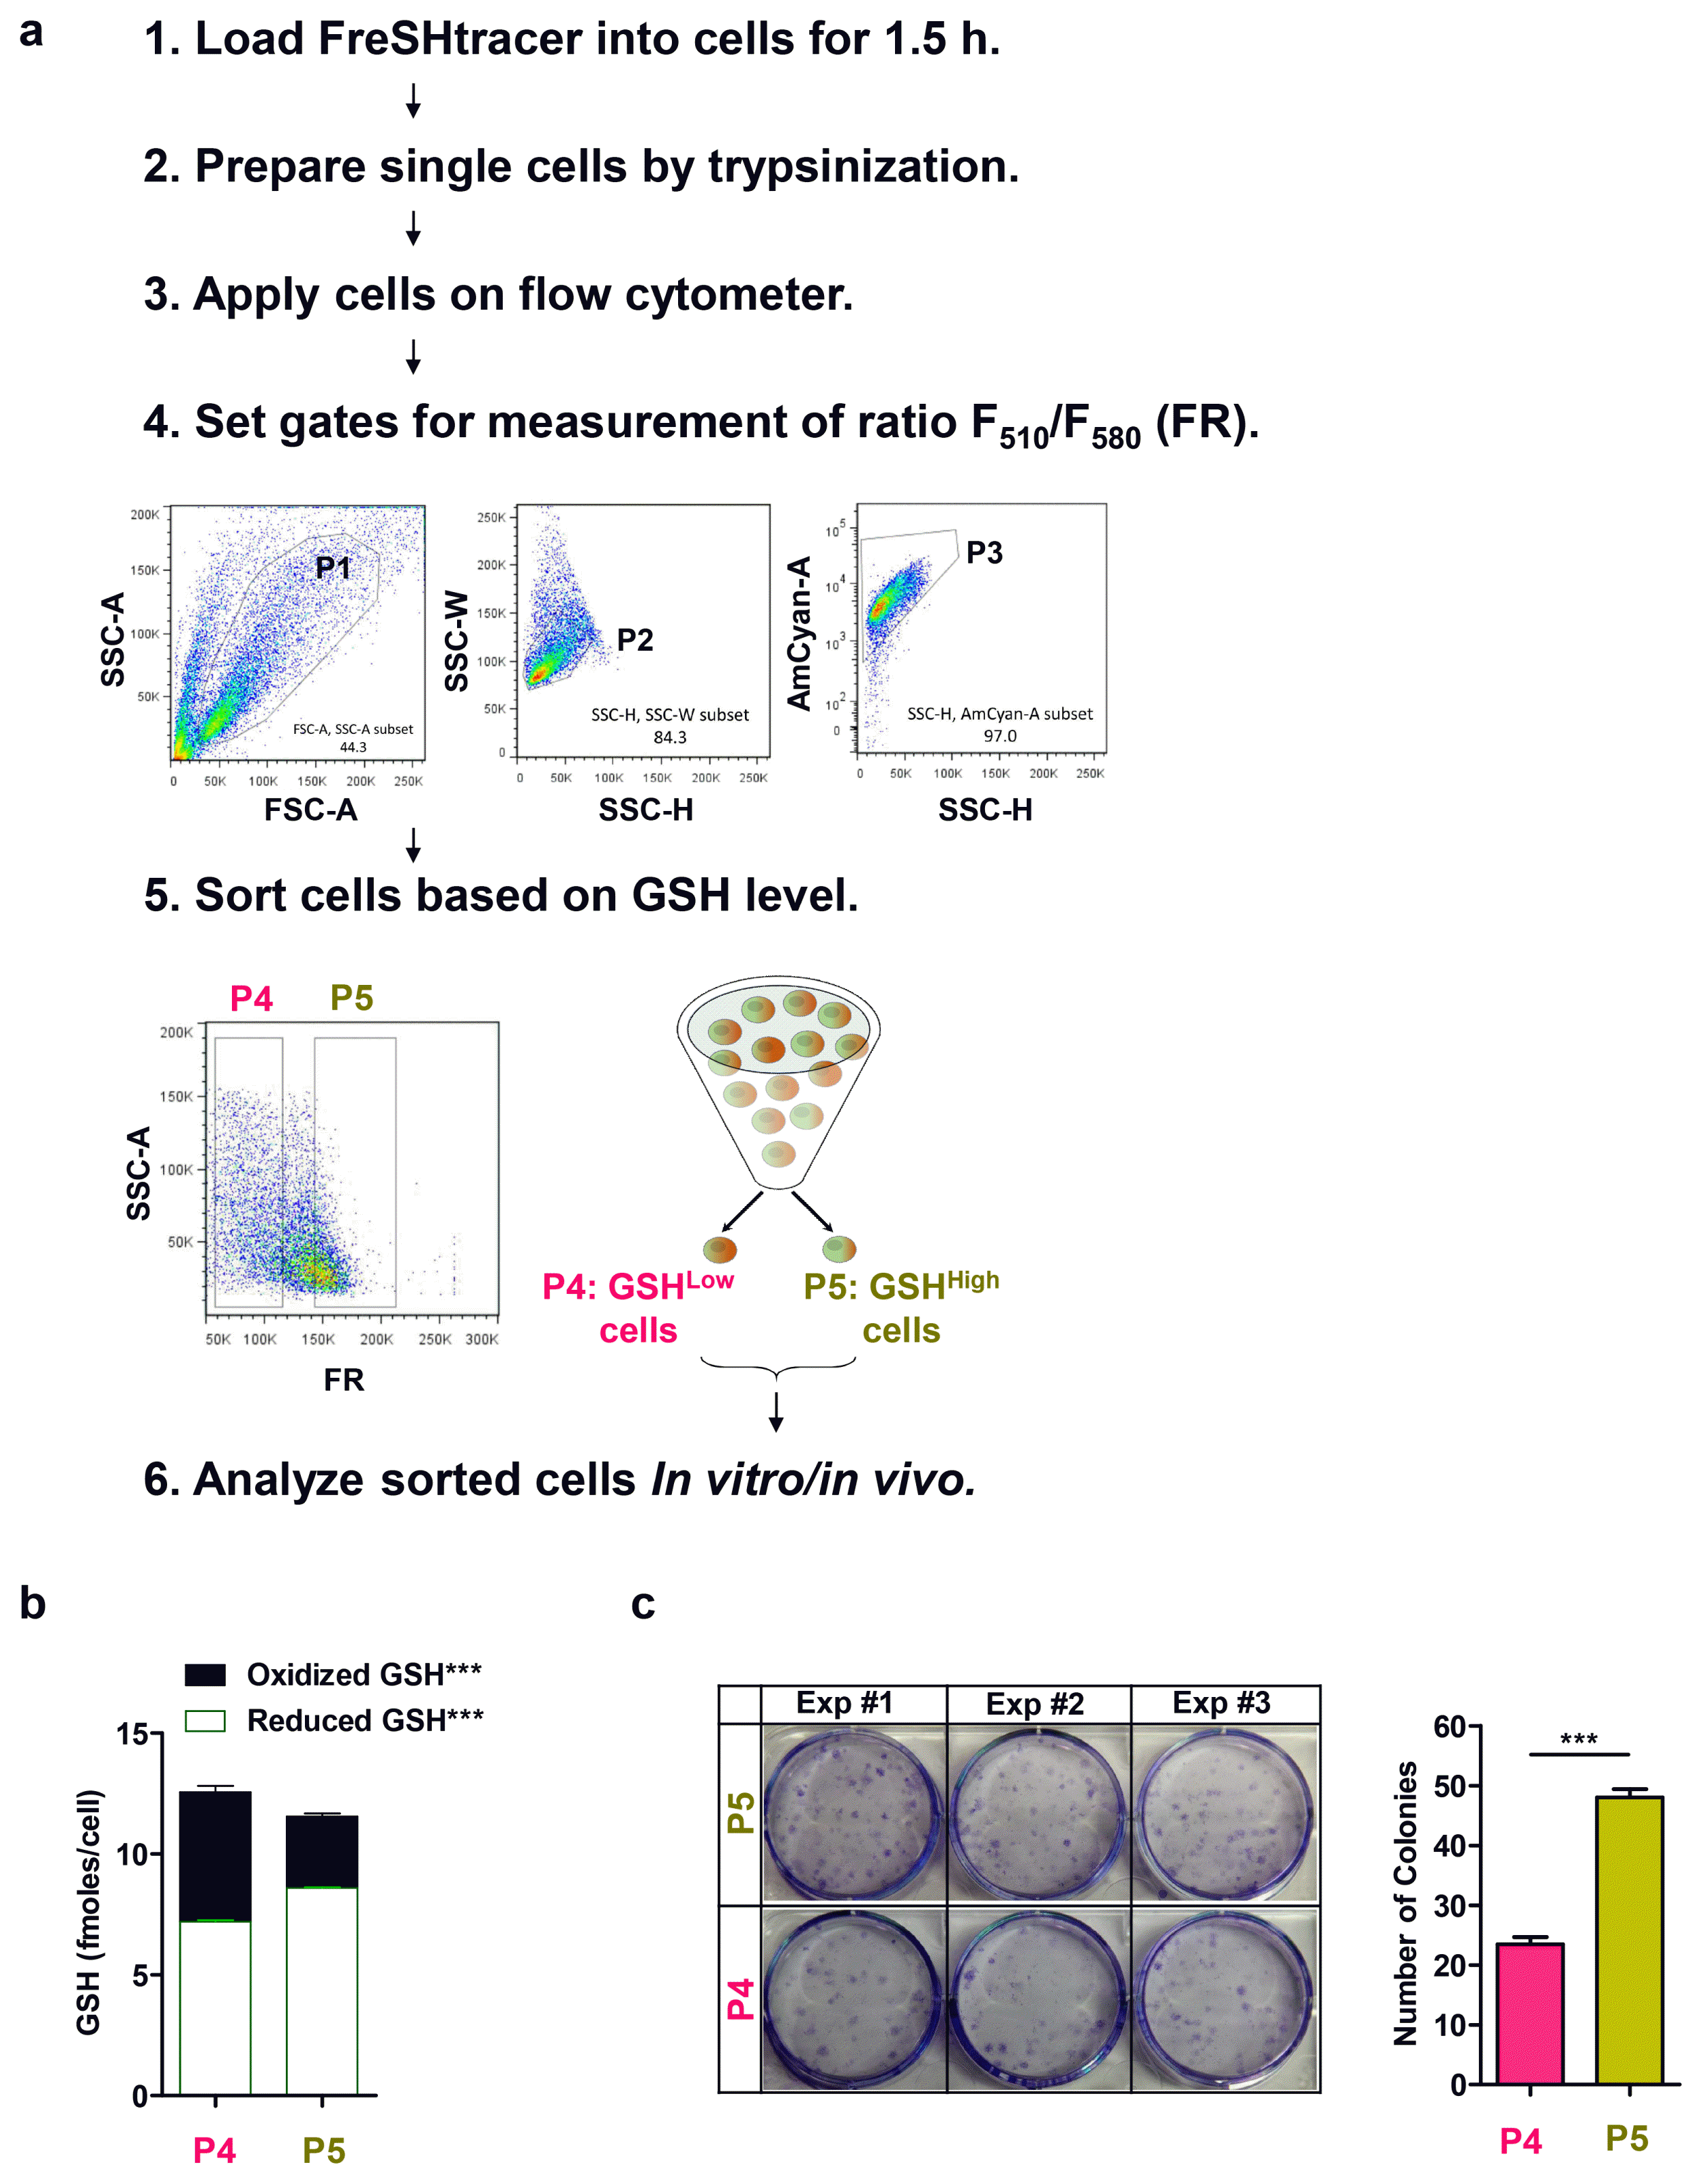
In this protocol, we utilize FreSHtracer and Mito-FreSHtracer, which ratiometrically report GSH levels in the whole cell and mitochondria, respectively, in real time and without causing cytotoxicity (10) (Fig. 1, Supplementary Fig. S1). We describe methods for the quantification of GSH concentrations in cultured SCs using confocal microscopy (Steps 1~7; Fig. 2) and flow cytometry (Steps 8~14; Fig. 3), and for the sorting of cells into subpopulations according to their GSH content (Steps 15~30; Fig. 4). The experiments described herein as exemplars were designed for the analysis of GSH concentrations in human umbilical cord-derived mesenchymal stem cells (hUC-MSCs). Some critical considerations for these applications are also highlighted. This approach could be applied to almost any kind of mammalian cell with minor modifications to the protocol described here.

Comparison with other methods

GSH has previously been quantified in cell extracts using biochemical techniques, including enzymatic cycling assays, chromatography, electrophoresis, and mass spectrometry (11, 12). However, these assays are time-consuming and often involve the oxidation of GSH during sample preparation; therefore, they only provide static and incomplete information regarding a population of cells. To measure GSH concentration in single and intact cells, a number of membrane-permeable chemical probes have been developed over the years (1315). However, most of these probes undergo irreversible reactions with GSH, and are therefore incompatible with the study of temporal dynamics in living cells. Genetically encoded fluorescent redox sensor proteins, such as roGFP, rxRFP, and rxYFP, have also been developed (16). However, these sensors report GSH/GSSG redox potential but not intracellular GSH concentration. Moreover, the poor efficiency with which they can be transfected or infected into cells makes their use difficult.
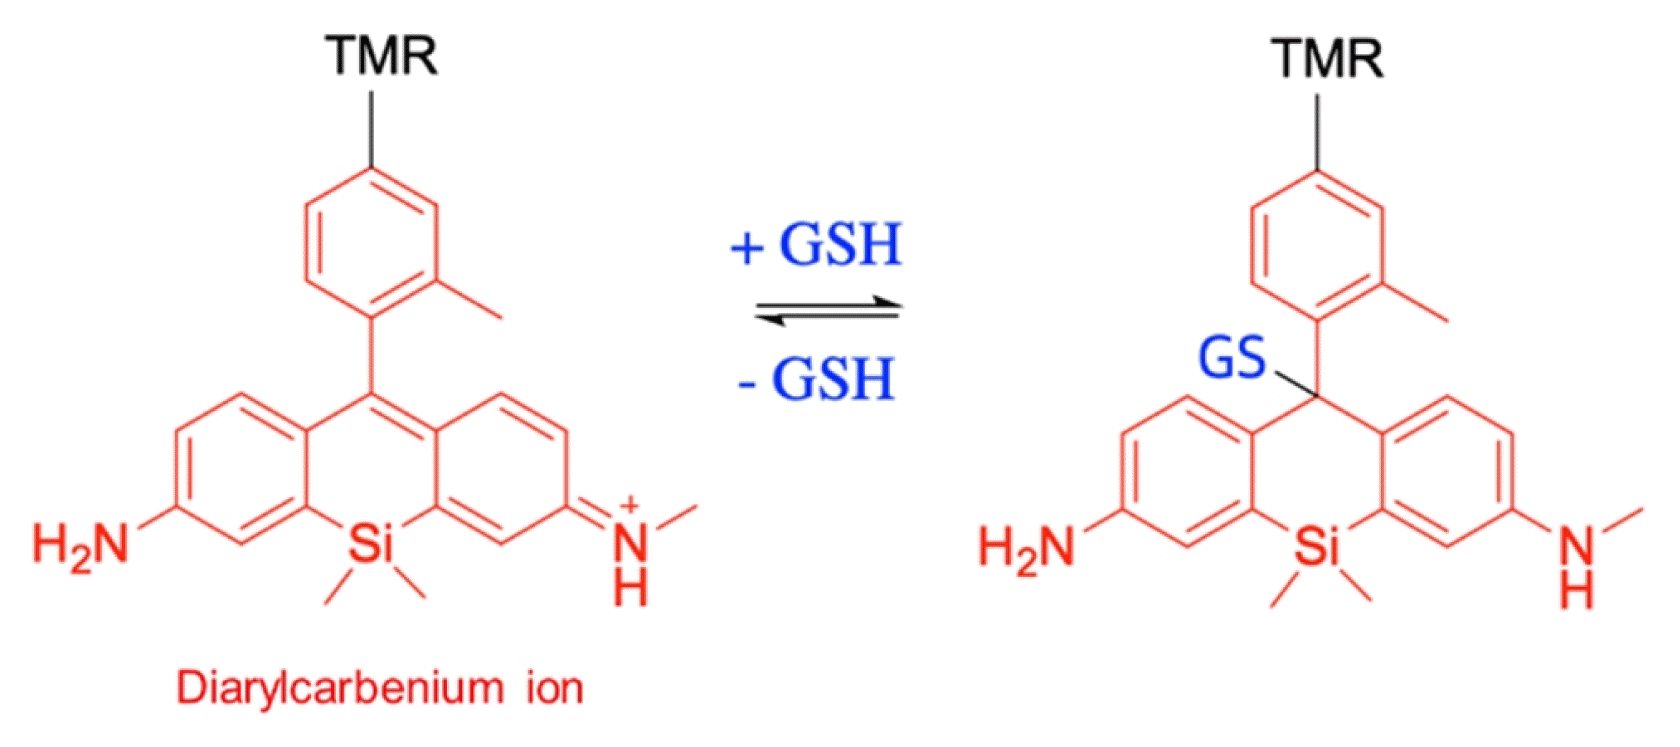
Recently, reversible chemical probes have been developed for the real-time monitoring of cellular GSH, such as cyanoacrylamide-based probes (10, 17, 18), an α, β-unsaturated ketone-based probe (19), and a rhodamine-based probe (20) (Table 1). Cyanoacrylamide electrophiles have been used to develop reversible inhibitors targeting non-catalytic cysteines in kinases (21). However, for the first time, we used this moiety to synthesize a reversible GSH probe, FreSHtracer, which has a cyanoacrylamide-conjugated coumarin fluorophore (9). FreSHtracer has appropriate characteristics for the monitoring of intracellular GSH concentration, as described below. FreSHtracer reversibly and rapidly reacts with GSH and ratiometrically reports GSH concentrations in aqueous solutions (KD≈3.6 mM) in the pH range 6.0~9.0 (10). In addition, FreSHtracer is cell membrane-permeable and is not cytotoxic (10) (Supplementary Fig. S1). Although FreSHtracer also reacts with cysteine thiols in cellular proteins (PSH) that are as abundant as GSH in cells (22), it reacts 12- and 8-fold faster with GSH in terms of forward and reverse kinetics, respectively, than with PSH. In addition, PSH-induced FreSHtracer signal is unaffected by treatment with H2O2, implying that FreSHtracer is appropriate for the rapid and selective monitoring of intracellular GSH concentration changes (10).
We also synthesized MitoFreSHtracer, which is targeted to mitochondria because of the addition of triphenylphosphonium (–P+Ph3) and chloromethyl moieties (10), which help the probe accumulate in mitochondria and covalently bind to the organelle proteins, respectively (23, 24). Whereas MitoFreSHtracer-treated cells retain their staining pattern when treated with oxidants (10), cells treated with a FreSHtracer derivative containing only the –P+Ph3 moiety lose their mitochondrial staining pattern during oxidative stress (Supplementary Fig. S2). In recent years, similar 2-cyanoacrylamide-conjugated coumarin derivatives, including RealThiol and HaloRT, have been reported to be useful for the quantification of intracellular GSH (18, 25). However, in these studies the reactivity of the probes with PSH was not characterized and they were used for the measurement of GSH concentration for no longer than 15 min, whereas we have shown that GSH monitoring using FreSHtracer can be conducted for at least several hours. Another reversible GSH probe, α,β-unsaturated ketone-based TQ-green, exhibited low quantum yield and slow kinetics (19), and a rhodamine-based probe, QG3.0, showed rapid reaction kinetics but localization to mitochondria, owing to its cationic fluorophore (20).

Experimental design and critical parameters

We have developed FreSHtracer and MitoFreSHtracer to analyze GSH levels in the whole cell and mitochondria, respectively (Fig. 1). Both FreSHtracers demonstrate a distinct fluorescence spectral change when they bind GSH: the fluorescence intensities at 510 nm (F510, λex 430 nm) and 580 nm (F580, λex 520 nm) are increased and reduced by reaction with GSH, respectively (Fig. 1), meaning that the F510/F580 ratio (FR) linearly correlates with GSH concentration (10).
To monitor GSH in living cells, we usually treat cells with 2~5 μM FreSHtracer or 10~15 μM MitoFreSHtracer; within these concentration ranges, no significant cytotoxicity was observed in HeLa cells, human bone marrow-derived mesenchymal stem cells (hBM-MSCs), human embryonic stem cell-derived MSCs (hES-MSCs) (10), or hUC-MSCs (Supplementary Fig. S1). We would recommend that the potential toxicity of FreSHtracers is evaluated at first use in other cell types and then the concentrations required for staining are optimized within the non-toxic concentration range.
FreSHtracer rapidly reacts with GSH, reaching equilibrium within 5 min, but reacts 8~12-fold slower with PSH (10). Thus, to quantify intracellular GSH concentrations reliably, cells should be pre-incubated for 60~90 min with FreSHtracers. Time-lapse images of cells can be acquired using a stage-top incubation system over a long period of time. This system provides suitable conditions for the visualization of live cells, while maintaining appropriate temperature, humidity, and CO2 levels (Fig. 2a). The initial FR values should be recorded at steady state (Fig. 2b and 2c), before the monitoring of dynamic changes in GSH concentration is commenced.
As shown in Fig. 2b and 2c, FreSHtracer and MitoFreSHtracer react with GSH and generate whole-cell and mitochondrial signals, respectively, in hUC-MSCs. FreSHtracer is membrane-permeable, and its intra- and extracellular concentrations are in equilibrium. Thus, FreSHtracer should be present in the culture media during intracellular GSH monitoring (Fig. 2b). By contrast, MitoFreSHtracer covalently attaches to mitochondrial proteins, and therefore mitochondrial GSH concentration can be monitored in cells being incubated in probe-free media, after washing with DPBS or HBSS (Fig. 2c).
We also synthesized FreSHtracer derivatives as di-acetoxymethyl esters (FreSHtracer-diAM), to encourage their intracellular retention (Supplementary Fig. S3). However, the intensity of FreSHtracer-diAM signals inside cells decreased with their incubation time in probe-free media. Moreover, the probe signals were detected in the cytoplasm but not in the nucleus of HeLa cells (Supplementary Fig. S3). Therefore, FreSHtracer is preferable for the continuous whole-cell monitoring of GSH over a long period.
As control experiments, we suggest monitoring GSH concentration changes induced by diamide (DA, a thiol-specific oxidant), N-ethylmaleimide (NEM, a thiol-alkylating reagent), and dithiothreitol (DTT, a thiol reagent) treatment. As shown in the confocal fluorescence microscopy images in Fig. 2b and 2c, the FR in FreSHtracer- or MitoFreSHtracer-loaded hUC-MSCs gradually decreased after the addition of 0.5 mM DA to the culture media and markedly increased following treatment with 0.5 mM DTT. Similarly, the analysis of GSH concentration using flow cytometry showed that FR was reduced by treatment with 5 mM DA, then raised by the addition of 5 mM DTT, and was reduced by the addition of 5 mM NEM (Fig. 3). These results suggest that FreSHtracer and MitoFreSHtracer are efficient probes for the monitoring of GSH concentration at the whole-cell level and in the mitochondria of living SCs, assessed using both microscopic and flow cytometric analyses.
For further applications, to study the biological significance of intracellular GSH level, cells can be sorted according to their FR by flow cytometry. As shown in Fig. 4a, we sorted FreSHtracer-treated hUC-MSCs into FRLow (P4) and FRHigh (P5) subgroups. The concentrations of GSH in cell lysates measured using a conventional in vitro assay correlated well with the FR values of the subgroups (Fig. 4b), validating the FreSHtracer-based sorting technique. FRHigh cells showed higher colony formation capacity than FRLow cells (Fig. 4c), suggesting that GSHHigh UC-MSCs have higher “stemness”.

Limitations of the method

It should be noted that FreSHtracer probes also have limitations, which are shared with other reversible GSH probes. First, FreSHtracer probes provide information regarding reduced GSH, but not the oxidized form. Thus, the probes are not applicable to the direct measurement of GSH redox potential. Second, FreSHtracer probes can react with various thiols. They exhibit KD values in the mM range for cysteine, cysteamine, β-mercaptoethanol, DTT, and N-acetyl cysteine (NAC), as well as GSH (10). However, because the intracellular concentration of GSH is significantly higher than that of other thiols, FreSHtracer probes are appropriate for the monitoring of intracellular GSH. However, in any experiment in which cells are treated with high concentrations of cell-permeable thiol compounds, these thiols could compete with intracellular GSH and interfere with the probe signals. In this situation, experiments should be carefully designed so that the GSH level is monitored only when the direct effects of exogenous thiol compounds on the probe signals are negligible. Lastly, both the GSH-bound and unbound forms of FreSHtracer are not affected by fixatives, and more importantly, GSH can be easily oxidized in fixed cells.

Materials and Methods

REAGENTS

  • DMSO (Merck Millipore, cat. no. 1.02931.1000)

  • FreSHtracer (Cell2in, cat. no. F-402)

  • MitoFreSHtracer (Cell2in, cat. no. M-377)

  • Cells of interest: in this study, we used hUC-MSCs from umbilical cord collected at the Obstetrics Department of Seoul National University Hospital (SNUH). The study was approved by the Internal Review Board (IRB) of the SNUH (IRB No. C-1708-083-878). CAUTION: Cells should be regularly checked to ensure that they are not infected with Mycoplasma.

  • Water, Ultra-Pure (Biosesang, cat. no. W2006)

  • MEM Alpha (Gibco, cat. no. 12561056)

  • FBS (Gibco, cat. no. 16000044)

  • Penicillin/streptomycin, 100× (Gibco, cat. no. 15140122)

  • HBSS (Welgene, cat. no. LB 003-02)

  • Dulbecco’s PBS×1 sterile solution (DPBS, pH 7.4; Welgene, cat. no. LB 001-02)

  • TrypLE Express Enzyme, 1×, no phenol red (Gibco, cat. no. 12604-013)

  • Trypan blue (Sigma-Aldrich, cat. no. T8154)

  • Dithiothreitol (DTT; Sigma-Aldrich, cat no. D9779)

  • Diamide (DA; Sigma-Aldrich, cat no. D3648)

  • N-Ethylmaleimide (NEM; Sigma-Aldrich, cat no. E1271)

  • Pluronic F-127 (Invitrogen, cat no. P6866)

  • HEPES (Corning, cat no. 25-060-Cl)

  • GSH-Glo Glutathione Assay kit (Promega, cat no. V6911)

  • Crystal Violet (Sigma, cat no. C3886)

EQUIPMENT

  • Confocal microscope (A1, Nikon)

  • Perfect Focusing System (PFS, Nikon)

  • Stage-top incubation system (Chamlide TC, Live Cell Instrument)

  • Laser sets for microscope imaging (Nikon; 405 and 488 nm)

  • Cover glass bottom dish (35 mm, SPL, cat. no. 200350)

  • Special glass cover for 35 mm culture dish (Chamlide TC, Live Cell Instrument, cat no. SG-C-10)

  • Clean bench (Labconco, class II type A2)

  • Centrifuge (Eppendorf, 5415R)

  • Centrifuge (Tomy, Flex-Spin LC-200)

  • Centrifuge tube (15 ml; SPL, cat no. 50015)

  • Centrifuge tube (50 ml; SPL, cat no. 50050)

  • Cell culture dish (100 mm; Corning, cat no. 430167)

  • Cell culture dish (150 mm; Sarstedt, cat no. 83.3903)

  • Six-well cell culture plate (Costar, cat no. 3516)

  • 96-well plates (Corning white flat bottom; Sigma, cat no. CLS3922)

  • Pipet-Aid XP (Drummond Scientific Co, cat. no. 4-000-201-E)

  • Serological pipette (SPL, cat no. 91005, 91010, 91025)

  • Micropipettes (Thermo Scientific, cat no. 4641060, 4641080, 4641100)

  • Micropipette tips (Sorenson, cat no. 15730, 10040)

  • Hemocytometer (Marienfeld, cat. no. 0610039094)

  • FACS tube (5 ml Polystyrene Round-Bottom Tube 12×75 mm style; Falcon, cat. no. 352054)

  • FACS filter tube (5 ml Polystyrene Round-Bottom Tube with Cell-Strainer Cap; Falcon, cat. no. 352235)

  • Flow cytometer (BD FACS LSRFortessa)

  • Flow cytometer (BD FACS AriaIII)

  • Luminometer (TECAN Infinite M200 Pro)

REAGENT SETUP

FreSHtracer: Dissolve the FreSHtracer powder in DMSO to a stock concentration of 10 mM.
  • CRITICAL: Store the stock solution at −20°C (up to 6 months) and protect it from light.

MitoFreSHtracer: Dissolve the MitoFreSHtracer powder in DMSO to a stock concentration of 10 mM.
  • CRITICAL: Store the stock solution at −20°C (up to 6 months) and protect it from light.

Culture medium: hUC-MSCs are incubated in alpha-MEM supplemented with 10% FBS, 100 U/ml penicillin, and 100 μg/ml streptomycin. This medium should be stored at 4°C until the expiration date.
FACS solution: For flow cytometry analysis, cells are suspended in DPBS containing 2% FBS.

EQUIPMENT SETUP

High-performance fluorescence microscopy system

The confocal microscopy system, as shown in Fig. 2a, consists of a Nikon A1 confocal microscope equipped with 405 and 488 nm laser sets, a perfect focus system, and a stage-top incubation system (Live Cell Instrument). An oil-immersion CFI Plan apochromat 60×, 1.40-numerical aperture objective was used. For dual-excitation ratio imaging, 405 and 488 nm lasers, and 525-BP 25 nm and 595-BP 25 nm emission filters, were utilized. The stage-top incubation system was set with a temperature of 37°C and a flow rate of pre-mixed gas (5% CO2, 95% air) of 40~50 ml/min, and cells were incubated in a 35 mm culture dish with a special glass cover to maintain humidity. All the instruments were pre-warmed for at least 20 min.

Software for dual-excitation ratio image analysis

To obtain fluorescence intensity ratio images of cells, raw data were analyzed and converted to pseudo-color images using NIS-Elements AR software. Alternatively, intensity images were exported as TIFF files and then converted to pixel-by-pixel ratio images using ImageJ software. The ratios were calculated by dividing F510 (Ex405-Em525/50) by F580 (Ex488-Em595/25) intensities.

Flow cytometry

A flow cytometry system equipped with 405 and 488 nm (or 561 nm) laser sets was used. For dual-excitation analysis, cells were monitored at two fluorescence channels: F510 (Ex405-Em525/50) and F580 (Ex488-Em575/25 or Ex561-Em582/15). Two predefined parameter settings for AmCyan and PE dyes were used for F510 and F580 measurements, respectively. Cells were gated using forward scatter area (FSC-A), side scatter area/height/width (SSC-A/SSC-H/SSC-W), and AmCyan (F510), as shown in Fig. 3a. The FreSHtracer ratio was then determined, and cells were sorted on the basis of this ratio.

Software for flow cytometry data analysis

To analyze single-cell flow cytometry data, FlowJo software was used. P1, P2, and P3 gates were created in a hierarchical way, as shown in Fig. 3a. Briefly, the P1 gate was adjusted using FSC-A×SSC-A to exclude debris, then the P2 gate was adjusted using SSC-H×SSC-A to identify single cells, and the P3 gate was adjusted using SSC-H versus Amcyan (F510) to exclude dead cells. The ratio between F510 and F580 (FR) was calculated for the cells in the P3 subset population using the “Derive Parameters” tool of the FlowJo software.

Characterization of sorted hUC-MSCs in vitro

In vitro assays for GSH and the number of colony-forming units of fibroblasts (CFU-F) were performed as previously described (10). Briefly, for the GSH assay, 1×10⁴ sorted cells were resuspended in 25 μl of DPBS, added to wells of a 96-well plate, and analyzed using a GSH-Glo Glutathione Assay kit, using the suspension cell protocol and a luminometer. For CFU-F assay, 600 sorted cells were seeded into 6-well culture plates, and then incubated in culture media for 12 days. The colonies formed were then washed with DPBS, fixed for 5 min using methanol pre-chilled at −20°C, and stained with 0.5% crystal violet.

PROCEDURE

Imaging and monitoring of GSH concentration in single living SCs

  • TIMING: 2~3 h after seeding cells.

    1│ Plate cells of interest on 35 mm cover glass bottom dishes.
  • CRITICAL STEP: Adjustment of the cell seeding density is crucial because cellular GSH concentration is sensitive to cell confluence (10).

    2│ Load FreSHtracer (option A) or MitoFreSHtracer (option B) into cells as follows.
  • CRITICAL STEP: FreSHtracers react not only with GSH but also with PSH. Whereas FreSHtracers equilibrate with GSH within 5 min, they show 8~12-fold slower reaction kinetics with PSH. Therefore, cells should be incubated with FreSHtracers for ≥1.0~1.5 h to equilibrate the probes with all the cellular thiols before measurements are made (10).

  • CRITICAL STEP: If a CO2 supply is not available, cell culture media containing 10~25 mM HEPES could be used to minimize pH changes during the experiment. However, this alternative method is not recommended for the continuous monitoring of live cells for a long period of time.

  • ? TROUBLESHOOTING

    (A) Change the culture medium to 2 ml fresh medium containing 5 μM FreSHtracer and incubate for 1.5 h at 37°C in 5% CO2.
  • CRITICAL STEP: After this FreSHtracer-loading step, avoid washing the cells with buffers or medium that does not contain FreSHtracer.

    (B) (i) Change the culture medium to fresh medium containing 10 μM MitoFreSHtracer and incubate for 1.5 h at 37°C, 5% CO2.
  • CRITICAL STEP: Adding small amounts of Pluronic F-127, a non-ionic surfactant known to facilitate the solubilization of organic dyes, to the culture medium is helpful, but not required, for the staining of cells with MitoFreSHtracer.

  • CRITICAL STEP: MitoFreSHtracer might also stain nuclei as the incubation time increases (>1 h).

  • ? TROUBLESHOOTING

    (ii) Discard the medium, wash the cells twice with HBSS, and then add 2 ml of fresh medium containing no MitoFreSHtracer.
    3│ Using a stage-top incubator, maintain the cells at 37°C in a humidified atmosphere containing 5% CO2 for 10~20 min, then visualize the cells using a confocal fluorescence microscope (for microscopy settings, see EQUIPMENT SETUP).
  • CRITICAL STEP: Turn on the confocal microscope and lasers 1 h before image acquisition, and adjust the temperature to 37°C and the atmospheric CO2 content to 5%.

  • CRITICAL STEP: Cellular GSH concentration is affected by thermal stress. Thus, it is important to maintain a constant temperature during the observation period. To prevent rapid changes in temperature, the volume of culture medium present in a 35 mm imaging dish should be at least 2 ml.

    4│ Turn on the perfect focus system and select 3~4 cells. Stabilize the two-channel fluorescence intensities for 5 min at intervals of 5~30 s.
  • CRITICAL STEP: Phototoxicity is an important concern for fluorescence microscopy experiments conducted in living cells. Therefore, adjustments of laser strength and time interval are required to avoid this.

  • ? TROUBLESHOOTING

    5│ Start image acquisition.
  • ? TROUBLESHOOTING

    6│(Optional) Gently add a stock solution of the test compound (such as DA or DTT) into the culture medium (Fig. 2b and 2c).
  • CRITICAL STEP: Large changes in the volume of media present can lead to focus drift. Therefore, the volume of added solution should not exceed 1% (20 μl in 2 ml of media) of that of the culture medium.

  • CRITICAL STEP: The concentrations of the cell-permeable FreSHtracer in the medium and intracellularly are lowered by adding a stock solution of the test compound to the media. To prevent this dilution effect, the probe could be added to the stock solution at the same concentration as it is present in the culture medium. However, highly reactive test compounds may react with the probe, especially when present at high concentrations. Therefore, it is recommended that the stability of the probe is checked first (for the example of H2O2, see Supplementary Fig. S4) and the appropriate concentration of stock solution to be used is determined. By contrast, the MitoFreSHtracer signal is not affected by the addition of a test solution, because it is designed to be anchored inside the organelle.

    7│ Analyze the acquired images using image-processing software, such as NIS-Elements or ImageJ.

Analysis of the GSH concentration in living SCs using flow cytometry

  • TIMING: 3 h after seeding cells.

    8│ Seed 5×10⁴ cells in each well of a 6-well plate, add 3 ml of culture medium to each, and incubate overnight at 37°C in 5% CO2.
  • CRITICAL STEP: Prepare unstained cells simultaneously, which will be used to adjust flow cytomter parameters.

    9│ Stain cells with FreSHtracer (option A) or Mito-FreSHtracer (option B) as follows.
  • CRITICAL STEP: Turn on the flow cytometer 30 min before analyzing the samples to stabilize its optical system.

  • CRITICAL STEP: FreSHtracers react not only with GSH but also PSH. Whereas FreSHtracers equilibrate with GSH within 5 min, they show 8~12-fold slower reaction kinetics with PSH. Therefore, cells should be incubated with FreSHtracers for ≥1.0~1.5 h to equilibrate the probes with all the cellular thiols before measurements are made (10).

    (A) (i) Change the culture medium to 2 ml of fresh medium containing 2 μM FreSHtracer and incubate for 1.5 h at 37°C in 5% CO2.
    (ii) Wash cells with 3 ml of DPBS twice. Add 300 μl of TrypLE to each well and incubate at 37°C in 5% CO2 for 1~2 min until all the cells detach from the culture plate.
    (iii) Resuspend the cell pellet in 300 μl of DPBS containing 2% FBS and 4 μM FreSHtracer per well, then transfer the suspension to a FACS filter tube.
    (B) (i) Change the culture medium to 2 ml of fresh medium containing 5 μM MitoFreSHtracer and incubate for 1.5 h at 37°C in 5% CO2.
  • ? TROUBLESHOOTING

    (ii) Wash the cells with 3 ml of DPBS twice. Add 300 μl of TrypLE to each well and incubate at 37°C in 5% CO2 for 1~2 min until all the cells detach from the culture plate.
    (iii) Resuspend the cell pellet in 300 μl of DPBS containing 2% FBS per well, then transfer to a FACS filter tube.
    10│ (Optional) Treat cells with ultra-pure water, 0.5 mM DA, or 0.5 mM DA and 0.5 mM DTT at the time points indicated in Fig. 3b, and incubate at room temperature (25°C).
    11│Keep cells on ice until flow cytometer analysis.
  • PAUSE POINT: Keep cells at 4°C for a maximum of 30 min until they are loaded into the flow cytometer.

  • ? TROUBLESHOOTING

    12│ Adjust the flow cytometer settings as follows. Select FSC, SSC, AmCyan (F510), and PE (F580) parameters in the inspection window of the BD FACSDiva software. Vortex the unstained sample, load it into the sample injection port (SIP), and use it to optimize the voltages required for the application. Then, adjust the P1, P2, and P3 gates, and create a histogram for the FR value, as shown in Fig. 3a.
    13│ Analyze the stained samples using the optimized flow cytometer settings.
  • CRITICAL STEP: The fluorescence intensities of FreSHtracers can be affected by temperature changes. Therefore, it is important to maintain a constant temperature (4°C) during flow cytometer analysis.

  • ? TROUBLESHOOTING

    14│ Export the raw data into FlowJo software in FCS format for further analysis.

Sort cells according to their GSH concentration using flow cytometry

  • TIMING: 3~4.5 h after seeding the cells.

    15│Seed cells into 150 mm dishes containing 25 ml of culture medium at a density of 30~60%.
  • CRITICAL STEP: The typical yield of FreSHtracer-based cell sorting is <30%. Therefore, to obtain 1×10⁶ cells from the upper and lower 30% of the entire cell population, 1~2×10⁷ cells need to be sorted.

  • CRITICAL STEP: Prepare unstained cells in one well of a 6-well plate.

    16│ Change the culture medium to 25 ml of fresh medium containing 2 μM FreSHtracer and incubate for 1.5 h at 37°C in 5% CO2.
    17│ Turn on the cytometer 30 min before use to stabilize the system.
    18│ Install a 100 μm nozzle and stabilize the stream.
    19│ Set the drop delay using AccuDrop beads to assign the most appropriate value for sorting.
    20│ Adjust the plate voltages to locate the stream in the center of the collection tube.
    21│ Turn on the cooling and aerosol management systems for aseptic sorting at 4°C.
  • CRITICAL STEP: It takes about 45 min to cool the sample injection chamber.

    22│ Wash cells with 25 ml (3 ml for the unstained sample) of DPBS twice. Add 3 ml (300 μl for the unstained cells) of TrypLE to a 150 mm dish (one well of a 6-well plate for the unstained sample) and incubate at 37°C in 5% CO2 for 1~2 min until all the cells detach after tapping the culture dish. Resuspend the cell pellet in 30 ml (3 ml for the unstained sample) of ice-cold culture medium containing 2.2 μM FreSHtracer (no probe for the unstained sample). Collect cells in 50 ml (15 ml for the unstained sample) tubes and count the cell number using a hemocytometer.
    23│ Centrifuge the cells at 500×g at 4°C for 5 min.
  • CRITICAL STEP: The centrifugal force and time that should be used are cell type-dependent.

    24│ Discard the medium and resuspend the cell pellet in 1 ml of PBS containing 2% FBS and 2 μM FreSHtracer, and then transfer the suspension to a FACS filter tube.
    25│ Keep the tubes on ice until flow cytometer analysis.
    26│ Adjust the flow cytometer settings using the following steps: FSC-A versus SSC-A (P1) to capture all cells; SSC-A versus SSC-H (P2) to capture single cells; SSC-H versus AmCyan (P3) to capture all live cells; and SSC-A versus FR to capture cells according to their GSH content (P4, P5, etc.). Optimize the voltages for the application using the unstained sample. Examples of typical flow cytomter plots are shown in Fig. 4a.
    27│ Sort the cells on the basis of their FR value into 1 ml of culture medium in collection tubes.
  • CRITICAL STEP: Fluorescence intensities of FreSHtracer can be affected by temperature changes. Therefore, it is important to maintain a constant temperature (4°C) during flow cytometer analysis.

  • ? TROUBLESHOOTING

    28│ For further functional studies, wash the sorted cells twice with ice-cold DPBS to remove FreSHtracer from the cells.
    29│ (Optional) To confirm the GSH concentration in the collected cells, analyze the lysates using an in vitro GSH assay kit, as described in EXPERIMENTAL SETUP (Fig. 4b).
    30│ (Optional) To test the in vitro function of the collected cells, analyze their CFU-F, as described in EXPERIMENTAL SETUP (Fig. 4c).
  • ? TROUBLESHOOTING

    Troubleshooting advice can be found in Table 2.
  • TIMING

Imaging and monitoring of GSH concentration in single living SCs

Step 1, cell plating: 1 day
Step 2, loading probes into cells: 1.5 h
Steps 5 and 7, imaging and monitoring of intracellular GSH in single living cells: <30 min
Step 6, cell treatment with DA and/or DTT (optional): <10 min

Analysis of GSH concentration in living SCs using flow cytometry

Step 8, cell plating: 1 day
Step 9, loading probes into cells and detaching the cells from culture plates: 1.5~2 h
Step 10, cell treatment with DA and/or DTT and/or NEM (optional): 10~20 min
Steps 11~14, flow cytometric analysis of intracellular GSH in living cells: <30 min

Sorting cells according to their GSH content using flow cytometry

Step 15, cell plating: 1 day
Steps 16~25, loading probes into cells, detaching them from culture plates, and setting up the cytometer: 2~2.5 h
Steps 26~28, sorting living cells according to their GSH content: 1~2 h
Step 29, in vitro GSH assay of cell lysates (optional): 1~ 2 h
Step 30, colony formation assay of the sorted SCs (optional): <2 weeks

Anticipated Results

The results of exemplar experiments are described in the Introduction and in Figs. 2~4.

Supplementary Information

Acknowledgments

We thank the staff of the Biomedical Imaging Center and FACS Center of the Core Research Facilities of Seoul National University College of Medicine for their technical advice and assistance. This work was funded by the National Research Foundation of Korea through the Basic Science Research Program (NRF-2017R1D1A1B03035059, 2017R1D1A1B03031379, NRF-2017M3A9B4061890, and NRF-2018R1A2B3008541); the Korea Healthcare Technology R&D Project, Ministry of Health and Welfare, Republic of Korea (HI14C3339 and HI18C2396); and the Brain Korea 21 PLUS program of the Korean Ministry of Education, Science and Technology.

Notes

Potential Conflict of Interest

I-G.K., H.S.K., K.C., D-M.S., E.M.J., and J-W.S. have established Cell2in, a company developing cell therapy that uses FreSHtracer-based technologies to assess cell quality.

Author Contributions

E.M.J., J-W.S., and J.L. designed the experiments; E.M.J., J-W.S., J.L., J.H.K., H.K., Y.Y., H-M.K., Y.K., S-G.K., J.S., and K.C. performed the experiments; E.M.J., D-M.S., K.C., and I-G.K. wrote the paper.

Supplementary Materials

Supplementary data including four figures can be found with this article online at http://pdf.medrang.co.kr/paper/pdf/IJSC/IJSC-12-s18151.pdf.

References

1. Wu G, Fang YZ, Yang S, Lupton JR, Turner ND. Glutathione metabolism and its implications for health. J Nutr. 2004; 134:489–492. DOI: 10.1093/jn/134.3.489. PMID: 14988435.
crossref
2. Lu SC. Glutathione synthesis. Biochim Biophys Acta. 2013; 1830:3143–3153. DOI: 10.1016/j.bbagen.2012.09.008. PMID: 22995213. PMCID: PMC3549305.
crossref
3. Winterbourn CC, Hampton MB. Thiol chemistry and specificity in redox signaling. Free Radic Biol Med. 2008; 45:549–561. DOI: 10.1016/j.freeradbiomed.2008.05.004. PMID: 18544350.
crossref
4. Townsend DM, Tew KD, Tapiero H. The importance of glutathione in human disease. Biomed Pharmacother. 2003; 57:145–155. DOI: 10.1016/S0753-3322(03)00043-X. PMID: 12818476. PMCID: PMC6522248.
crossref
5. Ok JS, Song SB, Hwang ES. Enhancement of replication and differentiation potential of human bone marrow stem cells by nicotinamide treatment. Int J Stem Cells. 2018; 11:13–25. DOI: 10.15283/ijsc18033. PMID: 29699388. PMCID: PMC5984055.
crossref
6. Kim Y, Jin HJ, Heo J, Ju H, Lee HY, Kim S, Lee S, Lim J, Jeong SY, Kwon J, Kim M, Choi SJ, Oh W, Yang YS, Hwang HH, Yu HY, Ryu CM, Jeon HB, Shin DM. Small hypoxia-primed mesenchymal stem cells attenuate graft-versus-host disease. Leukemia. 2018; 32:2672–2684. DOI: 10.1038/s41375-018-0151-8. PMID: 29789652. PMCID: PMC6286327.
crossref
7. Heo J, Lim J, Lee S, Jeong J, Kang H, Kim Y, Kang JW, Yu HY, Jeong EM, Kim K, Kucia M, Waigel SJ, Zacharias W, Chen Y, Kim IG, Ratajczak MZ, Shin DM. Sirt1 regulates DNA methylation and differentiation potential of embryonic stem cells by antagonizing Dnmt3l. Cell Rep. 2017; 18:1930–1945. DOI: 10.1016/j.celrep.2017.01.074. PMID: 28228259.
crossref
8. Lee CW, Kang D, Kim AK, Kim DY, Kim DI. Improvement of cell cycle lifespan and genetic damage susceptibility of human mesenchymal stem cells by hypoxic priming. Int J Stem Cells. 2018; 11:61–67. DOI: 10.15283/ijsc17054. PMID: 29699381. PMCID: PMC5984059.
crossref
9. Cho AY, Choi K. A coumarin-based fluorescence sensor for the reversible detection of thiols. Chem Lett. 2012; 41:1611–1612. DOI: 10.1246/cl.2012.1611.
crossref
10. Jeong EM, Yoon JH, Lim J, Shin JW, Cho AY, Heo J, Lee KB, Lee JH, Lee WJ, Kim HJ, Son YH, Lee SJ, Cho SY, Shin DM, Choi K, Kim IG. Real-time monitoring of glutathione in living cells reveals that high glutathione levels are required to maintain stem cell function. Stem Cell Reports. 2018; 10:600–614. DOI: 10.1016/j.stemcr.2017.12.007. PMID: 29307581. PMCID: PMC5830891.
crossref
11. Rahman I, Kode A, Biswas SK. Assay for quantitative determination of glutathione and glutathione disulfide levels using enzymatic recycling method. Nat Protoc. 2006; 1:3159–3165. DOI: 10.1038/nprot.2006.378. PMID: 17406579.
crossref
12. Monostori P, Wittmann G, Karg E, Túri S. Determination of glutathione and glutathione disulfide in biological samples: an in-depth review. J Chromatogr B Analyt Technol Biomed Life Sci. 2009; 877:3331–3346. DOI: 10.1016/j.jchromb.2009.06.016. PMID: 19560987.
crossref
13. Kim GJ, Lee K, Kwon H, Kim HJ. Ratiometric fluorescence imaging of cellular glutathione. Org Lett. 2011; 13:2799–2801. DOI: 10.1021/ol200967w. PMID: 21548608.
crossref
14. Sebastià J, Cristòfol R, Martín M, Rodríguez-Farré E, Sanfeliu C. Evaluation of fluorescent dyes for measuring intracellular glutathione content in primary cultures of human neurons and neuroblastoma SH-SY5Y. Cytometry A. 2003; 51:16–25. DOI: 10.1002/cyto.a.10003. PMID: 12500301.
crossref
15. Peng H, Chen W, Cheng Y, Hakuna L, Strongin R, Wang B. Thiol reactive probes and chemosensors. Sensors (Basel). 2012; 12:15907–15946. DOI: 10.3390/s121115907. PMID: 23202239. PMCID: PMC3522992.
crossref
16. Zou Y, Wang A, Shi M, Chen X, Liu R, Li T, Zhang C, Zhang Z, Zhu L, Ju Z, Loscalzo J, Yang Y, Zhao Y. Analysis of redox landscapes and dynamics in living cells and in vivo using genetically encoded fluorescent sensors. Nat Protoc. 2018; 13:2362–2386. DOI: 10.1038/s41596-018-0042-5. PMID: 30258175.
crossref
17. Chen J, Jiang X, Zhang C, MacKenzie KR, Stossi F, Palzkill T, Wang MC, Wang J. Reversible reaction-based fluorescent probe for real-time imaging of glutathione dynamics in mitochondria. ACS Sens. 2017; 2:1257–1261. DOI: 10.1021/acssensors.7b00425. PMID: 28809477. PMCID: PMC5771714.
crossref
18. Jiang X, Chen J, Bajić A, Zhang C, Song X, Carroll SL, Cai ZL, Tang M, Xue M, Cheng N, Schaaf CP, Li F, MacKenzie KR, Ferreon ACM, Xia F, Wang MC, Maletić-Savatić M, Wang J. Quantitative real-time imaging of glutathione. Nat Commun. 2017; 8:16087. DOI: 10.1038/ncomms16087. PMID: 28703127. PMCID: PMC5511354.
crossref
19. Jiang X, Yu Y, Chen J, Zhao M, Chen H, Song X, Matzuk AJ, Carroll SL, Tan X, Sizovs A, Cheng N, Wang MC, Wang J. Quantitative imaging of glutathione in live cells using a reversible reaction-based ratiometric fluorescent probe. ACS Chem Biol. 2015; 10:864–874. DOI: 10.1021/cb500986w. PMID: 25531746. PMCID: PMC4371605.
crossref
20. Umezawa K, Yoshida M, Kamiya M, Yamasoba T, Urano Y. Rational design of reversible fluorescent probes for live-cell imaging and quantification of fast glutathione dynamics. Nat Chem. 2017; 9:279–286. DOI: 10.1038/nchem.2648. PMID: 28221345.
crossref
21. Serafimova IM, Pufall MA, Krishnan S, Duda K, Cohen MS, Maglathlin RL, McFarland JM, Miller RM, Frödin M, Taunton J. Reversible targeting of noncatalytic cysteines with chemically tuned electrophiles. Nat Chem Biol. 2012; 8:471–476. DOI: 10.1038/nchembio.925. PMID: 22466421. PMCID: PMC3657615.
crossref
22. Hansen RE, Roth D, Winther JR. Quantifying the global cellular thiol-disulfide status. Proc Natl Acad Sci U S A. 2009; 106:422–427. DOI: 10.1073/pnas.0812149106. PMID: 19122143. PMCID: PMC2626718.
crossref
23. Murphy MP, Smith RA. Targeting antioxidants to mitochondria by conjugation to lipophilic cations. Annu Rev Pharmacol Toxicol. 2007; 47:629–656. DOI: 10.1146/annurev.pharmtox.47.120505.105110.
crossref
24. Presley AD, Fuller KM, Arriaga EA. MitoTracker Green labeling of mitochondrial proteins and their subsequent analysis by capillary electrophoresis with laser-induced fluorescence detection. J Chromatogr B Analyt Technol Biomed Life Sci. 2003; 793:141–150. DOI: 10.1016/S1570-0232(03)00371-4. PMID: 12880861.
crossref
25. Jiang X, Zhang C, Chen J, Choi S, Zhou Y, Zhao M, Song X, Chen X, Maletic-Savatic M, Palzkill TG, Moore D, Wang MC, Wang J. Quantitative real-time imaging of glutathione with sub-cellular resolution. Antioxid Redox Signal. 2018; [Epub ahead of print]. DOI: 10.1089/ars.2018.7605. PMID: 30358421. PMCID: PMC6486671.
crossref

Fig. 1
FreSHtracer, a reversible GSH probe. (a) The structure of the FreSHtracer backbone and its fluorescence spectral changes when it reacts with GSH. (b) The structures of R for FreSHtracer and MitoFreSHtracer.
ijsc-12-367f1.gif
Fig. 2
Imaging and monitoring of GSH concentration in single living cells. (a) Overview of the fluorescence confocal microscopy setup. (b, c) (i) Scheme for the whole-cell (b) and mitochondrial (c) staining of GSH. (ii, iii) sequential pseudo-color images with red hot scale (ii) and kinetics (iii) of F510/F580 ratio (FR) for FreSHtracer- or MitoFreSHtracer-loaded hUC-MSCs, which were treated with 0.5 mM diamide (DA) or 0.5 mM dithiothreitol (DTT).
ijsc-12-367f2.gif
Fig. 3
Flow cytometric analysis of living cells according to their GSH content. (a) Flowchart showing an overview of the procedure for measuring cellular GSH concentration using flow cytometry. (b, c) Flow cytometric analysis of GSH concentration in hUC-MSCs treated with 5 mM diamide (DA), 5 mM dithiothreitol (DTT), or 5 mM N-ethylmaleimide (NEM), using FreSHtracer (b; n=3 independent biological replicates) or MitoFreSHtracer (c; n=3 independent biological replicates).
ijsc-12-367f3.gif
Fig. 4
Flow cytometric sorting of living cells according to their GSH content. (a) Flowchart showing an overview of the procedure for the division of cells into subpopulations on the basis of their GSH content, using flow cytometry. (b) In vitro GSH assay of lysates and (c) count of colony-forming units of fibroblasts (CFU-F; n=3 independent biological replicates) in hUC-MSCs, sorted on the basis of FR.
ijsc-12-367f4.gif
Table 1
Comparison of reversible chemical probes for GSH
Probe name KD (mM, GSH) Forward reaction rate constant (M−1s−1) Quantum yield Distribution in cells Continuous monitoring time Fluorophore Publication year (reference)

GSH PSH
Cyanoacrylamide-based probes
ijsc-12-367f5.gif - Advantages: Can be targeted to subcellular organelles
- Disadvantages: Coumarin has been the only working fluorophore up to now
FreSHtracer 3.6 1.2 0.1 0.28 Whole-cell >several hours Coumarin 2012 (9), 2018 (10)
MitoFreSHtracer 1.3 N.D. N.D. N.D. Mitochondria <1 h Coumarin 2018 (10)
FreSHtracer-diAM 3.8 N.D. N.D. N.D. Cytoplasm <1 h Coumarin this paper
RealThiol 3.7 7.5 N.D. 0.86 Whole-cell <15 min Coumarin 2017 (18)
Mito-RealThiol 3.7 Biphasic (102 → 0.82) N.D. 0.97 Mitochondria N.D. Coumarin 2017 (17)
HaloRT 121 N.D. N.D. N.D. Various N.D. Coumarin 2018 (25)

α,β-unsaturated ketone-based probe
ijsc-12-367f6.gif - Advantages: -
- Disadvantages: Slow reaction, low quantum yield
TQ-Green 1.6 0.15 N.D. 0.0059 Whole-cell N.D. Coumarin 2015 (19)

Diarylcarbenium ion-based probe
ijsc-12-367f7.gif - Advantages: Fast reaction
- Disadvantages: Reports only mitochondrial GSH
QG3.0 3.0 560 N.D. 0.27 Mitochondria N.D. Rhodamine 2017 (20)

N.D.: not determined.

Table 2
Troubleshooting table
Step Problem Possible reason Solution
2,4,5 Cell death occurs High concentration of FreSHtracer Test the toxicity of FreSHtracer in cells of interest and load probes in the non-toxic concentration range
Phototoxicity Adjust laser power or time interval for image acquisition
2-B-i MitoFreSHtracer stains mitochondria unevenly Low solubility of MitoFreSHtracer in medium Add 0.03% Pluronic F-127 to the culture medium
4,5,13 Fluorescence intensity is low Background fluorescence of the culture medium Use Phenol red-free medium or buffer solutions during probe loading and observation
4,5 Basal fluorescence intensity is not constant Laser power unstable Wait 20~60 min before image acquisition
Temperature unstable Incubate cells at 37°C during the entire experimental procedure
10,13,27 FR measurements are not consistent Cellular GSH concentration is affected by thermal stress Maintain cells at a constant temperature (4°C) until flow cytometer analysis
TOOLS
Similar articles