Introduction
Materials and Methods
Animals
Ethics declarations
Experimental groups
Group I: Sham-operated control group that was supplemented with a single I.V. infusion of phosphate buffer solution in the rat tail vein for 4 weeks.
Group II: Untreated subtotally nephrectomized group: subtotal (five-sixths) nephrectomy was performed, and 4 weeks later, rats were supplemented with a single I.V. infusion of phosphate buffer solution in the rat tail vein.
Group III: Treated subtotally nephrectomized group: subtotal (five-sixths) nephrectomy was performed, and 4 weeks later, rats were supplemented with a single I.V. infusion of 0.5 ml of phosphate buffer solution (PBS) containing bone marrow-derived stem cells (1.5×10⁶) in the rat tail vein with a modified protocol from Yuen et al. (12).
Five-sixths nephrectomy technique
Bone marrow-derived stem cell treatment
Measurement of arterial blood pressure
Experimental procedure
Isolated heart study
Determination of kidney and heart weights
PCR detection of male-derived MSCs
Biochemical analysis
Results
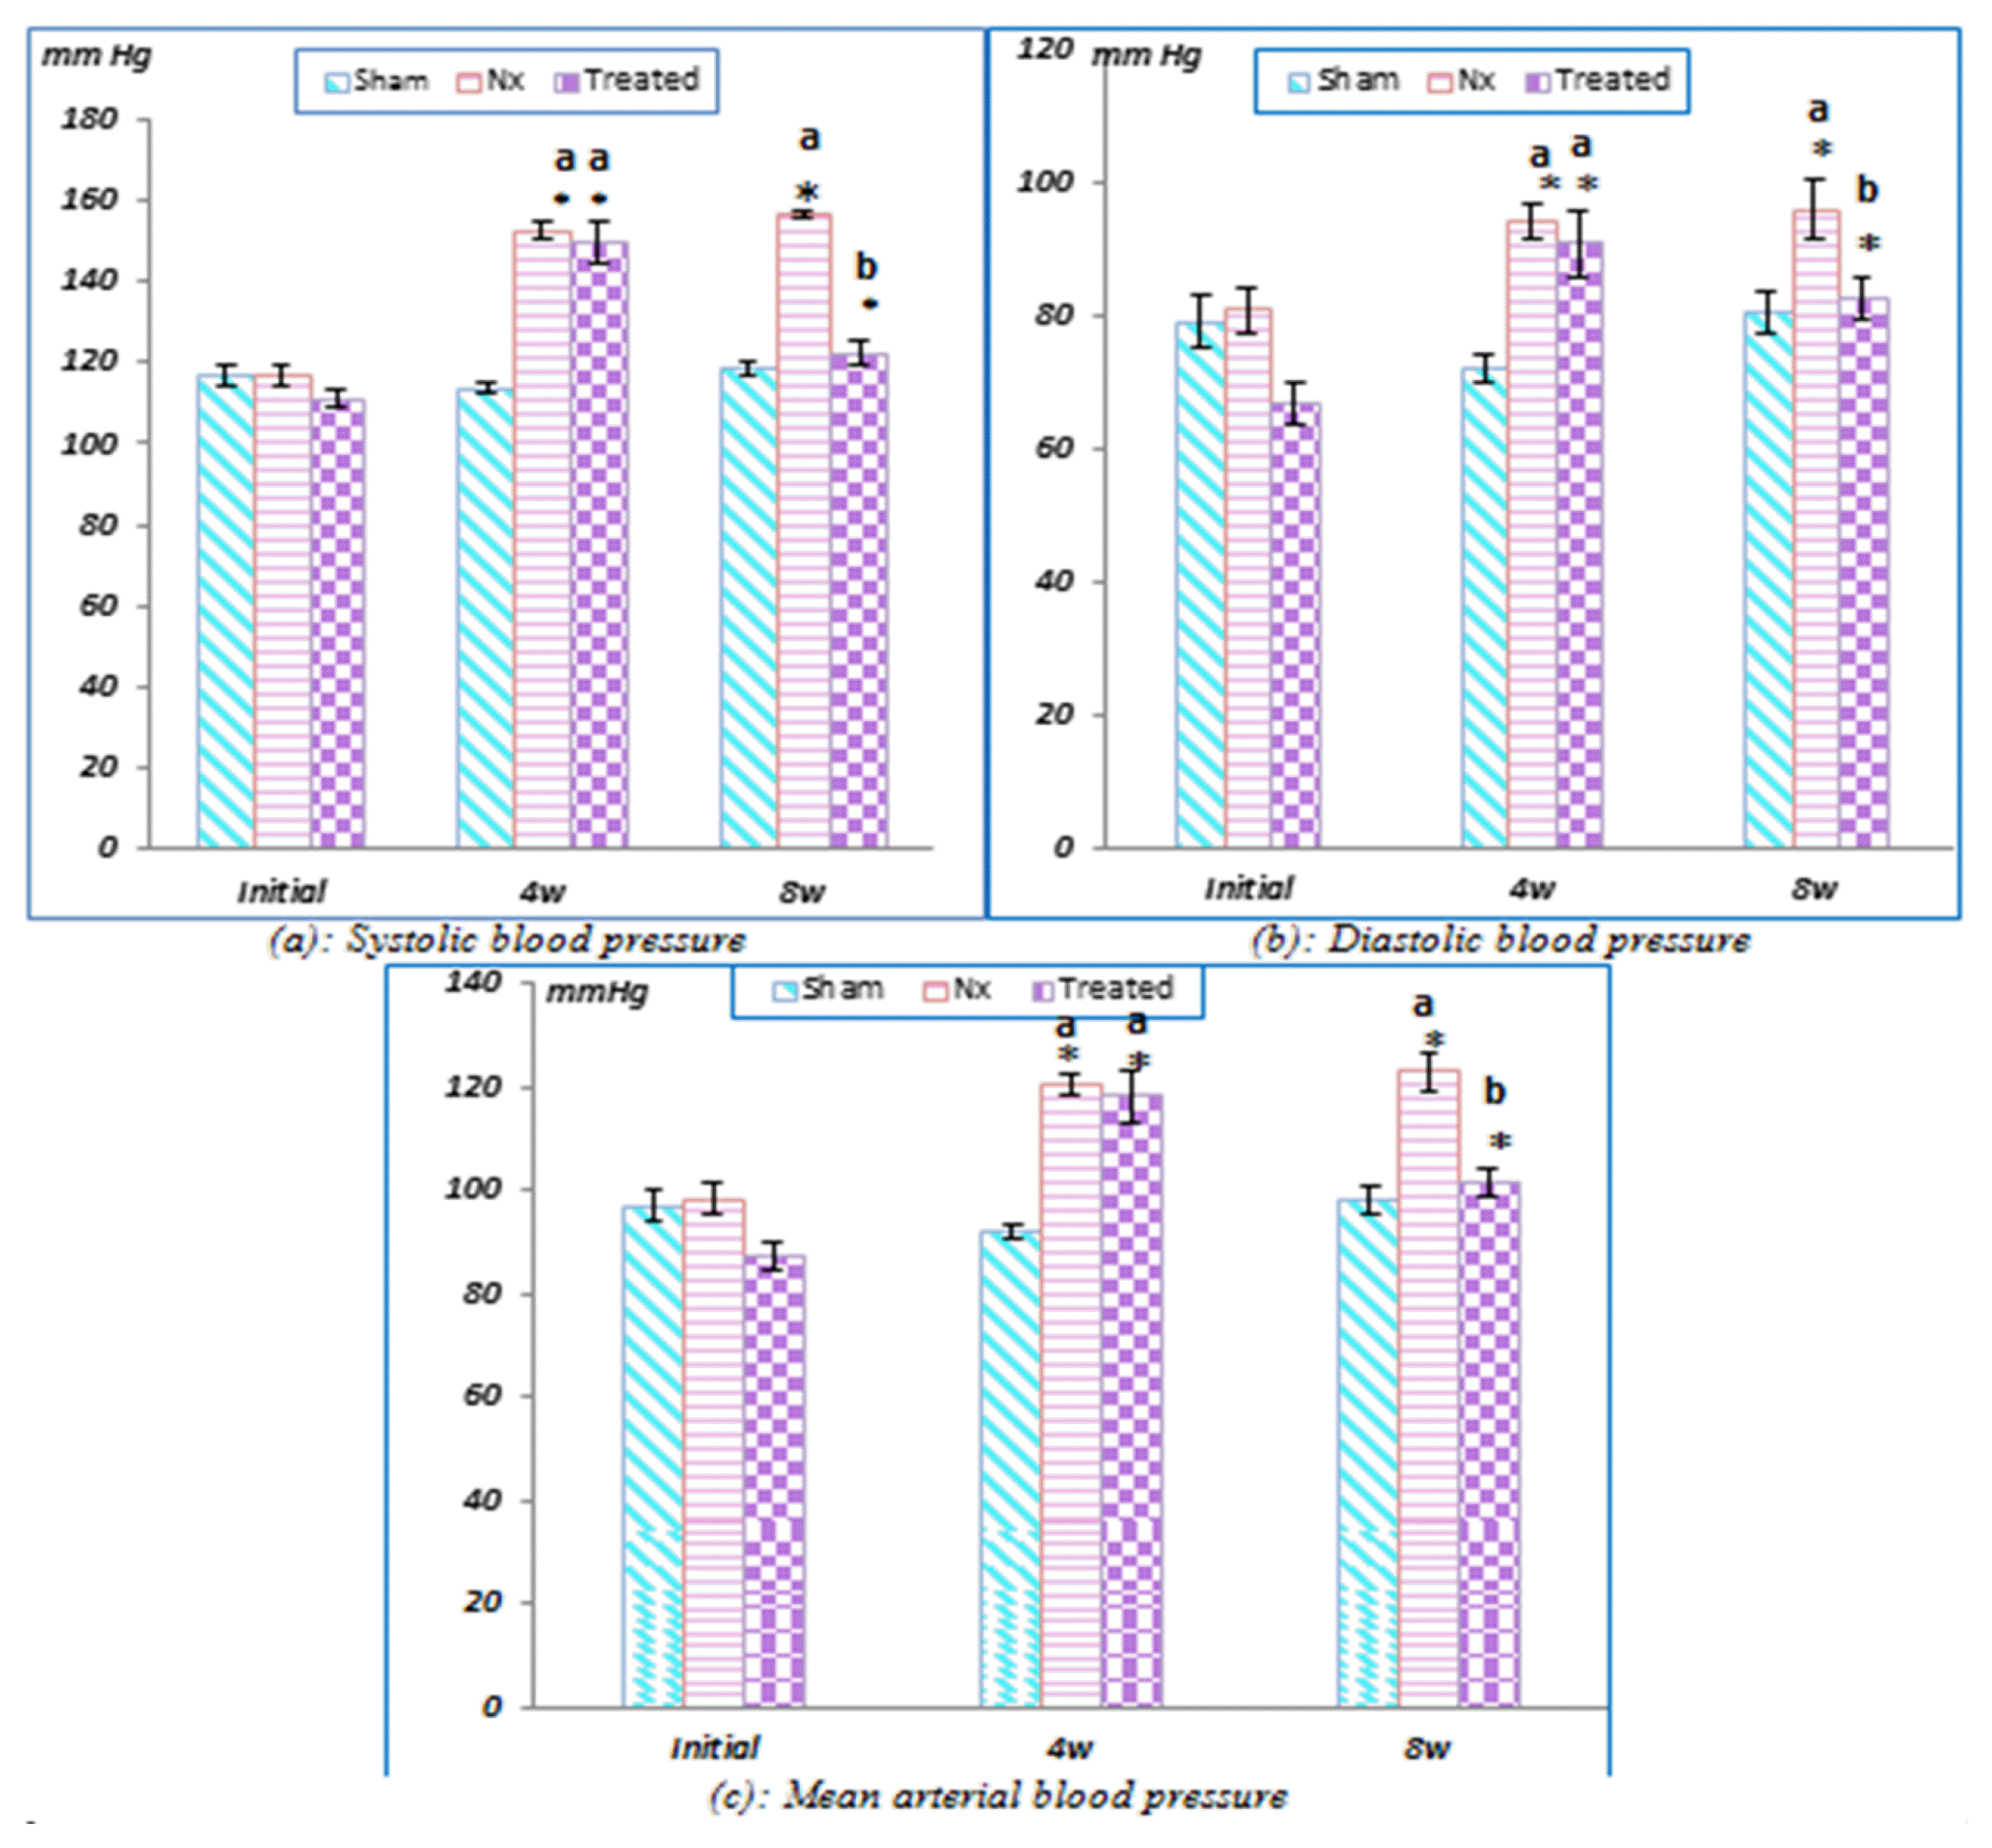
 | Fig. 2Initial, 4-week and 8-week (a) systolic blood pressure (SBP), (b) diastolic blood pressure and (c) mean arterial blood pressure values in the three studied groups. *: Significant difference compared to their initial values as calculated by Student’s t-test for paired data. a: Significant difference compared to the sham-operated control (Sham) group as calculated by the LSD at p<0.05. b: Significant difference compared to the untreated subtotally nephrectomized (untreated STNx) group as calculated by the LSD at p<0.05. |
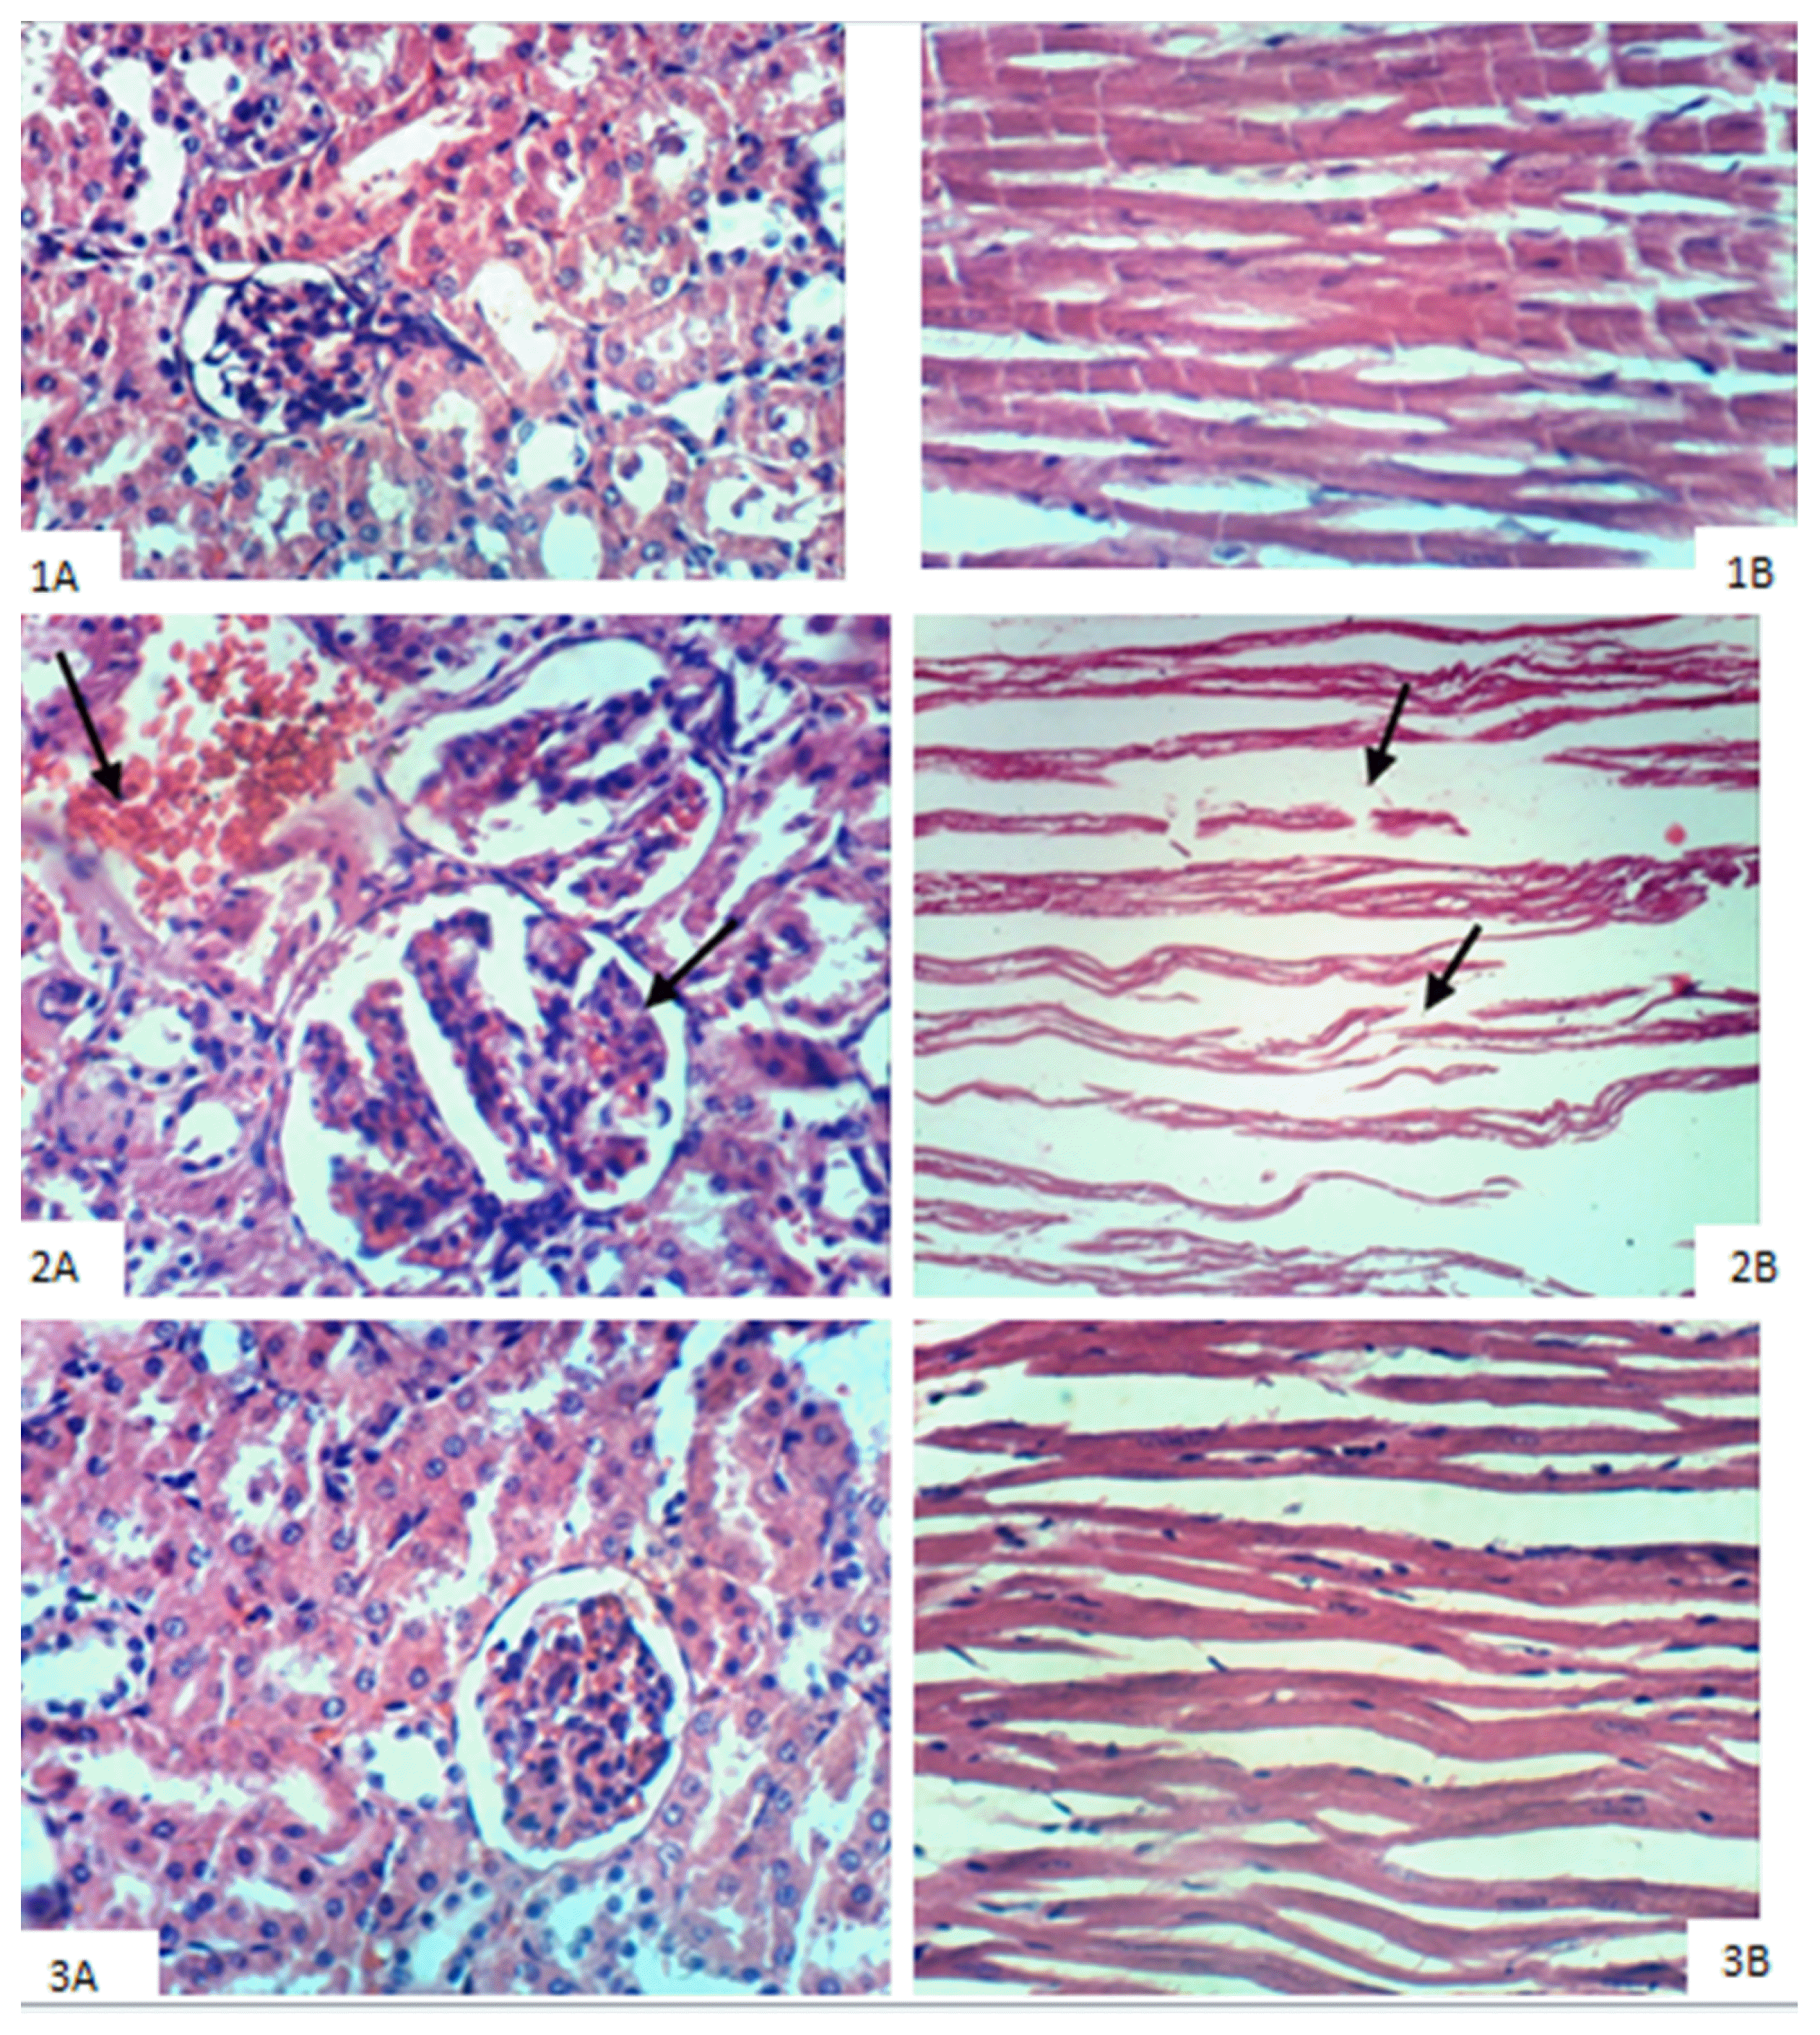
 | Fig. 4Histopathological changes in 1-Control group: (A) Renal tissues (B) Cardiac muscles. 2-Untreated nephrectomised group (A) Renal tissues showing hypertrophy of the glomerular tufts and congestion of renal blood vessels (B) Cardiac muscle showing intramuscular oedema that caused dispersion of the cardiomyocytes. 3-MSCs treated group (A) Renal tissues showing apparent normal renal parenchyma (B) Cardiac muscles showing regained normal morphology (H&E ×400). |
Table 1
| Sham (15) | Untreated STNx (15) | Treated STNx (15) | |
|---|---|---|---|
| BW% change | 23.02±1.21 | 13.31±2.61a | 27.61±1.74b |
| Left kidney remnant weight (mg) | 787.14±34.35 | 737.52±35.69 | 1047.78±53.26ab |
| LV (mg) | 518.81±11.69 | 569±16.71a | 588.27±18.17a |
| LV/BW (mg/gm) | 2.09±0.05 | 2.47±0.08a | 2.30±0.05a |
| WH/BW (mg/gm) | 3.03±0.09 | 3.63±0.18a | 3.37±0.08a |
| Creatinine (mg/dl) | 0.47±0.02 | 1.17±0.07a | 0.66±0.02ab |
| Urea (mg/dl) | 33.54±1.31 | 67.15±3.47a | 42.85±1.72ab |
Table 4
| Sham (15) | Untreated STNx (15) | Treated STNx (15) | |
|---|---|---|---|
| PT (gm) | 6.28±0.26 | 6.00±0.22 | 7.33±0.42ab |
| Pre-ischaemia baseline | |||
| 5 min of reperfusion | 4.77±0.33* | 4.34±0.40* | 4.86±0.29* |
| 15 min of reperfusion | 4.69±0.39* | 3.84±0.37* | 4.97±0.30b* |
| 30 min of reperfusion | 4.29±0.30* | 3.07±0.29a* | 5.11±0.30ab* |
| PT/LV (gm/100 mg) | 1.23±0.30 | 1.17±0.27 | 1.19±0.35 |
| Pre-ischaemia baseline | |||
| 5 min of reperfusion | 0.91±0.28* | 0.87±0.37* | 0.79±0.24* |
| 15 min of reperfusion | 0.91±0.35* | 0.76±0.33* | 0.84±0.29* |
| 30 min of reperfusion | 0.82±0.27* | 0.60±0.25a* | 0.83±0.24b* |
| TPT (msec) | 113.67±8.27 | 120.33±7.93 | 89±2.14ab |
| Pre-ischaemia baseline | |||
| 5 min of reperfusion | 133.67±11.07 | 137±11.75* | 91±3.39ab |
| 15 min of reperfusion | 110.33±8.24 | 150.67±12.58a* | 91.67±3.30b |
| 30 min of reperfusion | 114.33±9.17 | 165.67±11.61a* | 93.33±3.44b |
| HRT (msec) | 80.67±7.05 | 67.33±5.16 | 75±2.84 |
| Pre-ischaemia baseline | |||
| 5 min of reperfusion | 99.33±10.75 | 86.67±6.70* | 86.67±3.80* |
| 15 min of reperfusion | 97.67±7.86 | 95±8.31* | 85±2.13* |
| 30 min of reperfusion | 94.33±8.90 | 103.33±6.82* | 83.67±3.67b* |
| CT (msec) | 194.33±10.63 | 184.67±10.29 | 164±3.85a |
| Pre-ischaemia baseline | |||
| 5 min of reperfusion | 233±15.90 | 223±14.97* | 177.67±6.11ab* |
| 15 min of reperfusion | 208±12.42 | 243±15.60a* | 176.67±3.92b* |
| 30 min of reperfusion | 208.67±14.70 | 269±12.73a* | 177±5.60b* |
a : Significant difference between the untreated subtotally nephrectomized (untreated STNx) group and sham-operated control group (Sham) as calculated by the LSD at p<0.05.
Changes in body weight percentage and kidney weight
Changes in heart weight values
Kidney function tests
Changes in systolic, diastolic and mean arterial blood pressure
Electrocardiographic changes
Table 2
| Sham (15) | Untreated STNx (15) | Treated STNx (15) | |
|---|---|---|---|
| Heart rate (bpm) | 235.67±5.46 | 207.43±12.77a | 232±4.36b |
| PR interval (msec) | 91.43±4.04 | 80±4.78 | 104.44±4.73b |
| QRS duration (msec) | 40±0 | 30.48±2.62a | 40±0b |
| QRS voltage (μv) | 695.24±41.68 | 466.67±47.97a | 750±72.87b |
| Q-To (msec) | 129.52±3.81 | 172±6.55a | 137.78±4.82b |
| Q-Tc (msec) | 258.57±6.10 | 323.50±7.69a | 273.33±9.53b |
Isolated perfused hearts studies
Table 3
| Sham (15) | Untreated STNx (15) | Treated STNx (15) | |
|---|---|---|---|
| HR (bpm) | 160±11.88 | 160.53±15.34 | 184.20±8.56 |
| Pre-ischaemia baseline | |||
| 5 min of reperfusion | 130.93±15.24 | 132.13±14.53 | 198.53±14.82ab |
| 15 min of reperfusion | 134.07±9.57 | 133.87±15.14 | 179.80±13.48ab |
| 30 min of reperfusion | 133.33±10.29 | 122.60±14.55 | 170.53±15.19ab |
| MFR/LV (ml/min/100 mg) | |||
| Pre-ischaemia baseline | 1.20±0.16 | 1.10±0.09 | 1.20±0.08 |
| 5 min of reperfusion | 0.89±0.11* | 0.97±0.08* | 0.96±0.07* |
| 15 min of reperfusion | 0.78±0.11* | 0.87±0.09* | 0.76±0.05* |
| 30 min of reperfusion | 0.68±0.10* | 0.66±0.06* | 0.66±0.06* |
Inotropic activity is illustrated in Table 4
Myocardial flow rate
PCR detection of male-derived MSCs
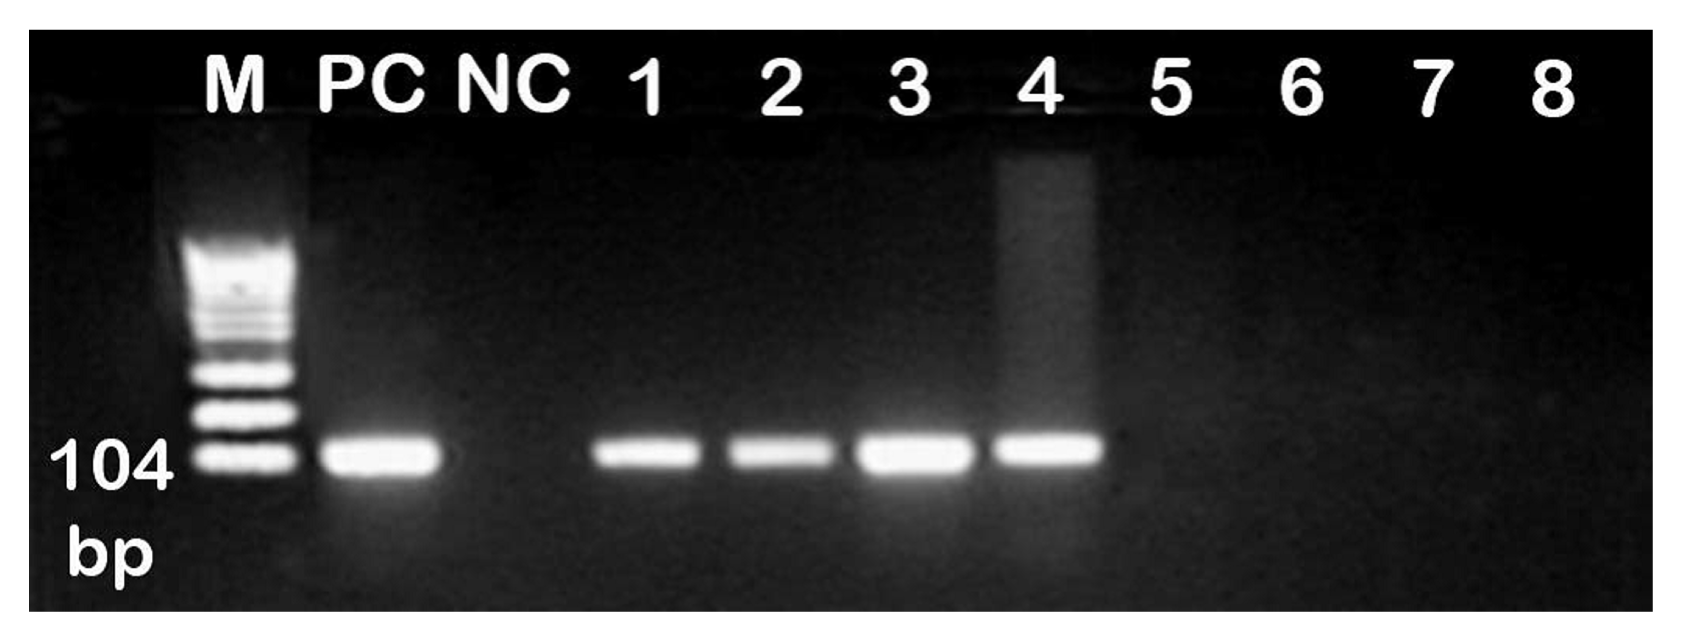
 | Fig. 3Results of the PCR assay for the male Y chromosome (sry) gene following 2% agarose gel electrophoresis and staining with ethidium bromide. M: DNA 100-bp marker, PC: positive PCR control (male rat genomic DNA), NC: negative PCR control (female rat genomic DNA). Lane 1~4: MSC-treated group, which was injected with mesenchymal stem cells (MSCs). Lane 5~8: Control and untreated groups that were not injected with male MSCs. |


 PDF
PDF Citation
 Print
Print


 XML Download