

 PDF
PDF Citation
 Print
Print


Introduction
Mesenchymal stem cells (MSCs) have recently received worldwide attention because of their potential in tissue engineering applications. MSCs are a cell population that possesses self-renewal capacity, multi-lineage potential, and long-term viability. MSCs are fibroblast-like adherent cells with a high proliferation rate (1). Stem cell circulation is a system that induces the rapid proliferation of hematopoietic stem cells in the bone marrow and the release of many stem cells into the bloodstream (2). One of the more clinically attractive traits of stem cells is their ability to home to specific microenvironments after infusion (3). For example, MSCs home to damaged tissues and have therefore attracted attention as possible therapeutic tools for tissue repair (1, 4). Moreover, MSCs are involved in tissue regeneration throughout life and show potential for the treatment of many diseases (5, 6). Bone marrow (BM) or peripheral blood is the most commonly used MSC sources in clinical applications because of their convenience and autologous properties (7).
Peripheral blood (PB) has been suggested as an alternative source of MSCs for cell-based therapy in the treatment of meniscus injuries and bone and cartilage defects (8, 9), although a significant presence of MSCs in human PB has been disputed (10). The major limitations of PB MSCs for clinical purposes are the extremely low frequency of MSCs in PB and the inadequate success rate of PB MSC isolation. Like stem cells, PB MSCs are also limited in their ability to proliferate over long culture periods without loss of stem cell characteristics.
Nonetheless, several studies have demonstrated the presence of mesenchymal stem cells or stromal stem cells in peripheral blood (11–14). In these experiments, MSCs were isolated by the classic adhesion procedure and expanded by subculture. Using the same method, other teams have isolated MSCs from PB, but their attempts to evaluate stem cell characteristics in PB MSCs ended in failure (15). Even though there is no doubt that circulating MSCs exist, there is no established method for obtaining them efficiently from PB. The classic plastic adhesion method (16) is widely used to acquire MSCs from PB, but this procedure has limitations because true PB MSCs are likely to be missed due to their poor ability to adhere to plastic. The efficient isolation of potent MSCs forms the basis for the development of new methods for cell therapy and tissue regeneration; therefore, the development of new isolation techniques for such cells is of great interest.
In the previous study, we showed the isolation and expansion of PBMSCs on the BMMSC-derived natural ECM could be differentiated into osteoblast in vitro. Furthermore, PBMSC transplanting in the double-canaled implant in rabbit tibia increased the bone regeneration. The capacity was comparable to BMMSCs proved by bone formation assays (14). However, direct comparison of the characterization and differentiation capacity between BMMSC and PBMSC for osteogenesis would be required.
The cell adhesion ability with alveolar bone and the metallic implant would be important during implant surgery in dentistry. The phosphatidylinositol 3-kinase (PI3K) pathway has been implicated in transformation and cell growth (17). PI3K has many downstream effector molecules and plays a central role in signal transduction for various cellular responses (18). The PI3Ks are grouped into three classes (I, II, and III) according to their substrate specificities and different modes of regulation. The evolution of this family of enzymes and their critical role in cell proliferation, growth, death, and differentiated cell function has been reviewed recently (19).
The role of PI3K in the cell differentiation of osteoblasts is unknown but emerging evidence suggests that PI3K may play a role in differentiation and survival in these cells. Even less is known about the role of PI3K in cell attachment.
In this study, we compared the characters and the differentiation capacity between PBMSC on the natural ECM with BMMSC in vitro and in vivo. Furthermore, we examined the possible involvement of PI3K in MSC attachment using specific inhibitors of PI3K. Our data indicate that the PI3K signal pathway is directly or indirectly associated with MSC attachment.
Go to : 
Materials and Methods
Animals
Animal experiments were carried out with male 8- to 10-week-old C3H/HeNCrljOri mice and 6- to 9-month-old New Zealand White rabbits weighing 3.0~3.5 kg. The animal protocols were approved by the Institutional Animal Care and Use Committee at Seoul National University (Approval No. SNU-101125-1 and SNU-120312-5) and all procedures were performed in compliance with institutional guidelines.
Bone marrow cell isolation and culture
Mouse
Bone marrow was extracted from the femurs and tibiae of mice by aspiration with an 18-gauge needle through a 1-cm skin incision. The bone marrow cells were washed in PBS containing 2% FBS (Equitech-Bio) and antibiotics, filtered through a 70-mm nylon mesh filter (Becton Dickinson, San Jose, CA, USA), and treated with ACK (Ammonium-Chloride-Potassium ) lysing buffer for 5 min at room temperature followed by centrifugation at 1,600 rpm for 5 min. After removal of the red blood cell (RBC) lysate supernatant, the mononuclear cells (MNCs) were re-suspended in complete alpha-modified Eagle’s medium (α-MEM) supplemented with 15% FBS, 2 mM L-glutamine (Sigma Chemical Co., St Louis, MO, USA), 55 μM 2-mercaptoethanol (Sigma), 100 μM L-ascorbic acid 2-phosphate (Wako), and penicillin/streptomycin solution (Sigma).
Rabbit
Bone marrow was aspirated from the tibia of each rabbit and BM MSCs were cultured using a modification of a previously reported method (20). Briefly, the tibias and femurs were harvested from 6- to 9-month-old New Zealand White rabbits. A 10 ml syringe containing 1 ml of heparin (3,000 U/ml) with a 16-gauge needle was used to aspirate or flush out the BM from the tibial or femoral shaft. Marrow was placed in a 50 ml tube containing 5 ml α-MEM and centrifuged at 600 g for 15 minutes. The cells were resuspended in α-MEM culture media.
Peripheral blood cell isolation and culture
MSCs were isolated from mononuclear cells (MNCs) of peripheral blood. Peripheral blood was obtained from 8- to 10-week-old mice (2~3 ml) and 6- to 9-month-old rabbits (3~5 ml) that were anesthetized with Zoletil 50 (50 mg/kg) and Rompun (10 mg/kg). The blood was treated with ACK lysing buffer for 5 min at room temperature and centrifuged at 3500 rpm for 5 min. After removal of the RBC lysate supernatant, the MNCs were re-seeded with complete α-MEM culture media in ECM-coated dishes.
Preparation of cell-free ECM from cultured bone marrow MSCs
Preparation of ECM-coated dishes was based on a previously described method (14). BM MSCs were cultured in dishes as previously described. After 7 days, non-adherent cells were removed by extensive rinsing with PBS and the adherent cells were removed from the ECM by incubation with 0.005% Triton X-100 for 3~5 minutes at room temperature. The ECM-coated dishes were washed with PBS three times and stored at 37°C for up to 1 month to dry completely. For this study, the dried ECM-coated dishes were immersed in PBS for 30 minutes prior to use.
Colony-forming unit-fibroblast (CFU-F) assay
We conducted CFU-F assays to evaluate the cloning efficiency of MSCs obtained from BM and PB. MNCs isolated from BM and PB (1×10⁶ cells) were seeded in 60 mm normal dishes containing complete α-MEM. After 14 days of culture, CFU-F colonies were fixed and stained with a solution containing 0.1% toluidine blue (Sigma) in PBS. Colonies containing over 50 cells were counted with a light microscope at ×40 magnification.
Bromodeoxyuridine (BrdU) cell proliferation assay
To assess cell proliferation, PB MSCs and BM MSCs (5×10⁴ per well) were seeded on 2-chamber slides (Nunc, GmbH & Co., KG) and cultured. After 1 to 3 days, BrdU labeling reagent (Life Technologies, Grand Island, NY, USA) was added and the cultures were incubated for a further 24 h. Incorporated BrdU was stained with a BrdU staining kit (Invitrogen, Carlsbad, CA, USA) according to the manufacturer’s instructions. To assess cell proliferation, nine representative images were used to determine the number of BrdU-stained nuclei and proliferation activity was calculated as the percentage of BrdU-staining nuclei relative to the total number of nucleated cells.
Fluorescence activated cell sorter (FACS) analysis
After three passages PB MSCs and BM MSCs were harvested and 5×10⁵ cells were washed with FACS buffer (2% FBS, 0.1% NaN3 in PBS), incubated with 3% rat serum on ice for 30 min, and immunolabeled with 1 μg of PE-conjugated monoclonal antibodies against mouse CD14, CD34, CD44, CD105, CD117, Ly-6A/E (Sca-1) (BD); Oct-4 (Millipore); or CD29 (eBioscience) on ice for 30 min.
Fluorescent antibodies used for rabbit cells included fluorescein isothiocyanate (FITC)-conjugated anti-rabbit CD14, and phycoerythrin (PE)-conjugated anti-rabbit CD29. Analyses were performed with a FACS Calibur flow cytometer using Calibur software (Becton-Dickinson) with 10,000 events recorded for each sample.
Differentiation potential
BM MSCs and PB MSCs were cultivated under osteogenic and adipogenic conditions in order to determine their capability to produce bone and adipose cell lineages.
Bone differentiation
For osteogenesis, cells in the second passage were cultured in a 35-mm dish containing 15% FBS (Becton Dickinson, Franklin Lakes, NJ, USA), 2 mM L-glutamine, 55 μM 2-mercaptoethanol, penicillin/streptomycin (Sigma Chemical Co.) and 100 μM L-ascorbic acid 2-phosphate (Sigma Chemical Co.) to 70~80% confluence. The culture medium was replaced with Stempro osteo medium (GIBCO by Life technologies). The medium was changed twice a week for 3 weeks. Three weeks after induction of differentiation, calcium deposits were stained with Alizarin red S solution (Sigma) and the cells were subjected to RT-PCR analysis.
Adipose differentiation
For adipogenesis, the cultures were incubated in α-MEM (Life Technologies) supplemented with 15% FBS (Becton-Dickinson), 2 mM L-glutamine, 55 μM 2-mercaptoethanol, 100 μM L-ascorbic acid phosphate, 0.5 mM isobutyl-methylxanthine, 60 μM indomethacin, 0.5 μM hydrocortisone, 10 μM insulin, and penicillin/streptomycin (all from Sigma). The medium was changed twice a week for 3 weeks. The formation of lipid droplets was visualized by Oil red O staining (Sigma). The cells were subjected to RNA extraction and RT-PCR analysis of adipogenic gene expression.
Rabbit chondrogenic differentiation
Expanded cells were harvested after three passages and aliquots of 5×10⁵ MSCs were centrifuged at 550 g in 15 ml polypropylene tubes (Falcon, Bedford, MA) for 5 min. The medium was replaced with Stempro chondro medium (GIBCO by Life technologies). The pelleted cells were incubated in a humidified atmosphere of 5% CO2 at 37°C. The medium was changed every 3 days and the pellets were harvested after 21 days of culture. In the chondrogenic assay, the pellet cultures were embedded in paraffin and stained with safranin O.
RT-PCR
To demonstrate differentiation of BM MSCs and PB MSCs, the expression of markers specific for osteoblasts, adipocytes, and chondrocytes was analyzed by RT-PCR using a mouse- or rabbit-specific primer pairs (Table 1). Total RNA was extracted from untreated BM MSCs and PB MSCs and cells that were differentiated from BM MSCs and PB MSCs using Trizol reagent (Invitrogen). For RT-PCR, cDNA was synthesized with SuperScript III First-Strand kit (Invitrogen) using random hexamers according to the manufacturer’s instructions.
Table 1
Sequences of PCR primers
![]()
In vivo transplantation
Approximately 5×10⁶ of adherent BM MSCs and low-adherent BM MSCs (all at the same passage) were seeded onto 80 mg of hydroxyapatite/tricalcium phosphate (HA/TCP) powder (Zimmer, Freiburg, Germany) and incubated in a humidified atmosphere at 37°C with 5% CO2 for 2 h to allow cell attachment before insertion into the transverse canals of implants. The mice were sacrificed at 8 to 10 weeks and their transplants were harvested. For histologic analysis, the transplant samples were fixed with 4% PFA in PBS and decalcified with 5% EDTA and 4% sucrose (pH 7.2~7.4). The paraffin-embedded sections were deparaffinized, hydrated, and stained with hematoxylin and eosin (H&E).
PI3 kinase assay
Primary mouse BM MSCs (1×10⁷ cells) were seeded into 6-cm normal culture dishes and incubated for 16 days. The cells were treated with the PI3K inhibitors LY294002 and Wortmannin at a concentration of 5~100 nm for 10 to 30 minutes. The treated cells detached from the cultured dish and floated in the medium. The cells in the supernatant were counted and re-seeded for the colony-forming unit-fibroblast (CFU-F) assay.
Statistical analyses
All statistical analyses were performed in the R programming language. The language R (Vienna, Austria) is a free software environment for statistical computing and the result of a collaborative effort with contributions from all over the world. A difference was considered significant when p<0.05.
Go to :
Results
Colony-forming unit-fibroblast (CFU-F) assay and proliferation of BM MSCs and PB MSCs
The number of mouse PB CFU-Fs on ECM-coated normal dishes was significantly lower than the number of mouse BM CFU-Fs (Fig. 1a). However, the number of CFU-Fs was greatly increased when mPB MSCs were plated on ECM-coated dishes compared with normal dishes (p<0.05). The resulting colonies were heterogeneous in size and cell density, potentially reflecting differences in the rate of cell proliferation (Fig. 1b). The majority of the colonies from mBM CFU-Fs were larger than those from mPB CFU-Fs. Moreover, the BM colonies adhered to each other, whereas the PB CFU-Fs on the ECM-coated dishes were dispersed without contact between the cells. The mean number of cells with BrdU incorporation (±standard deviation) of mouse BM MSCs and mouse PB MSCs was 63.9±5.71% and 52.0±2.63%, respectively (Fig. 1c). Thus, the BrdU incorporation was higher in mBM MSCs than in mPB MSCs but the difference was not statistically significant (p>0.05).
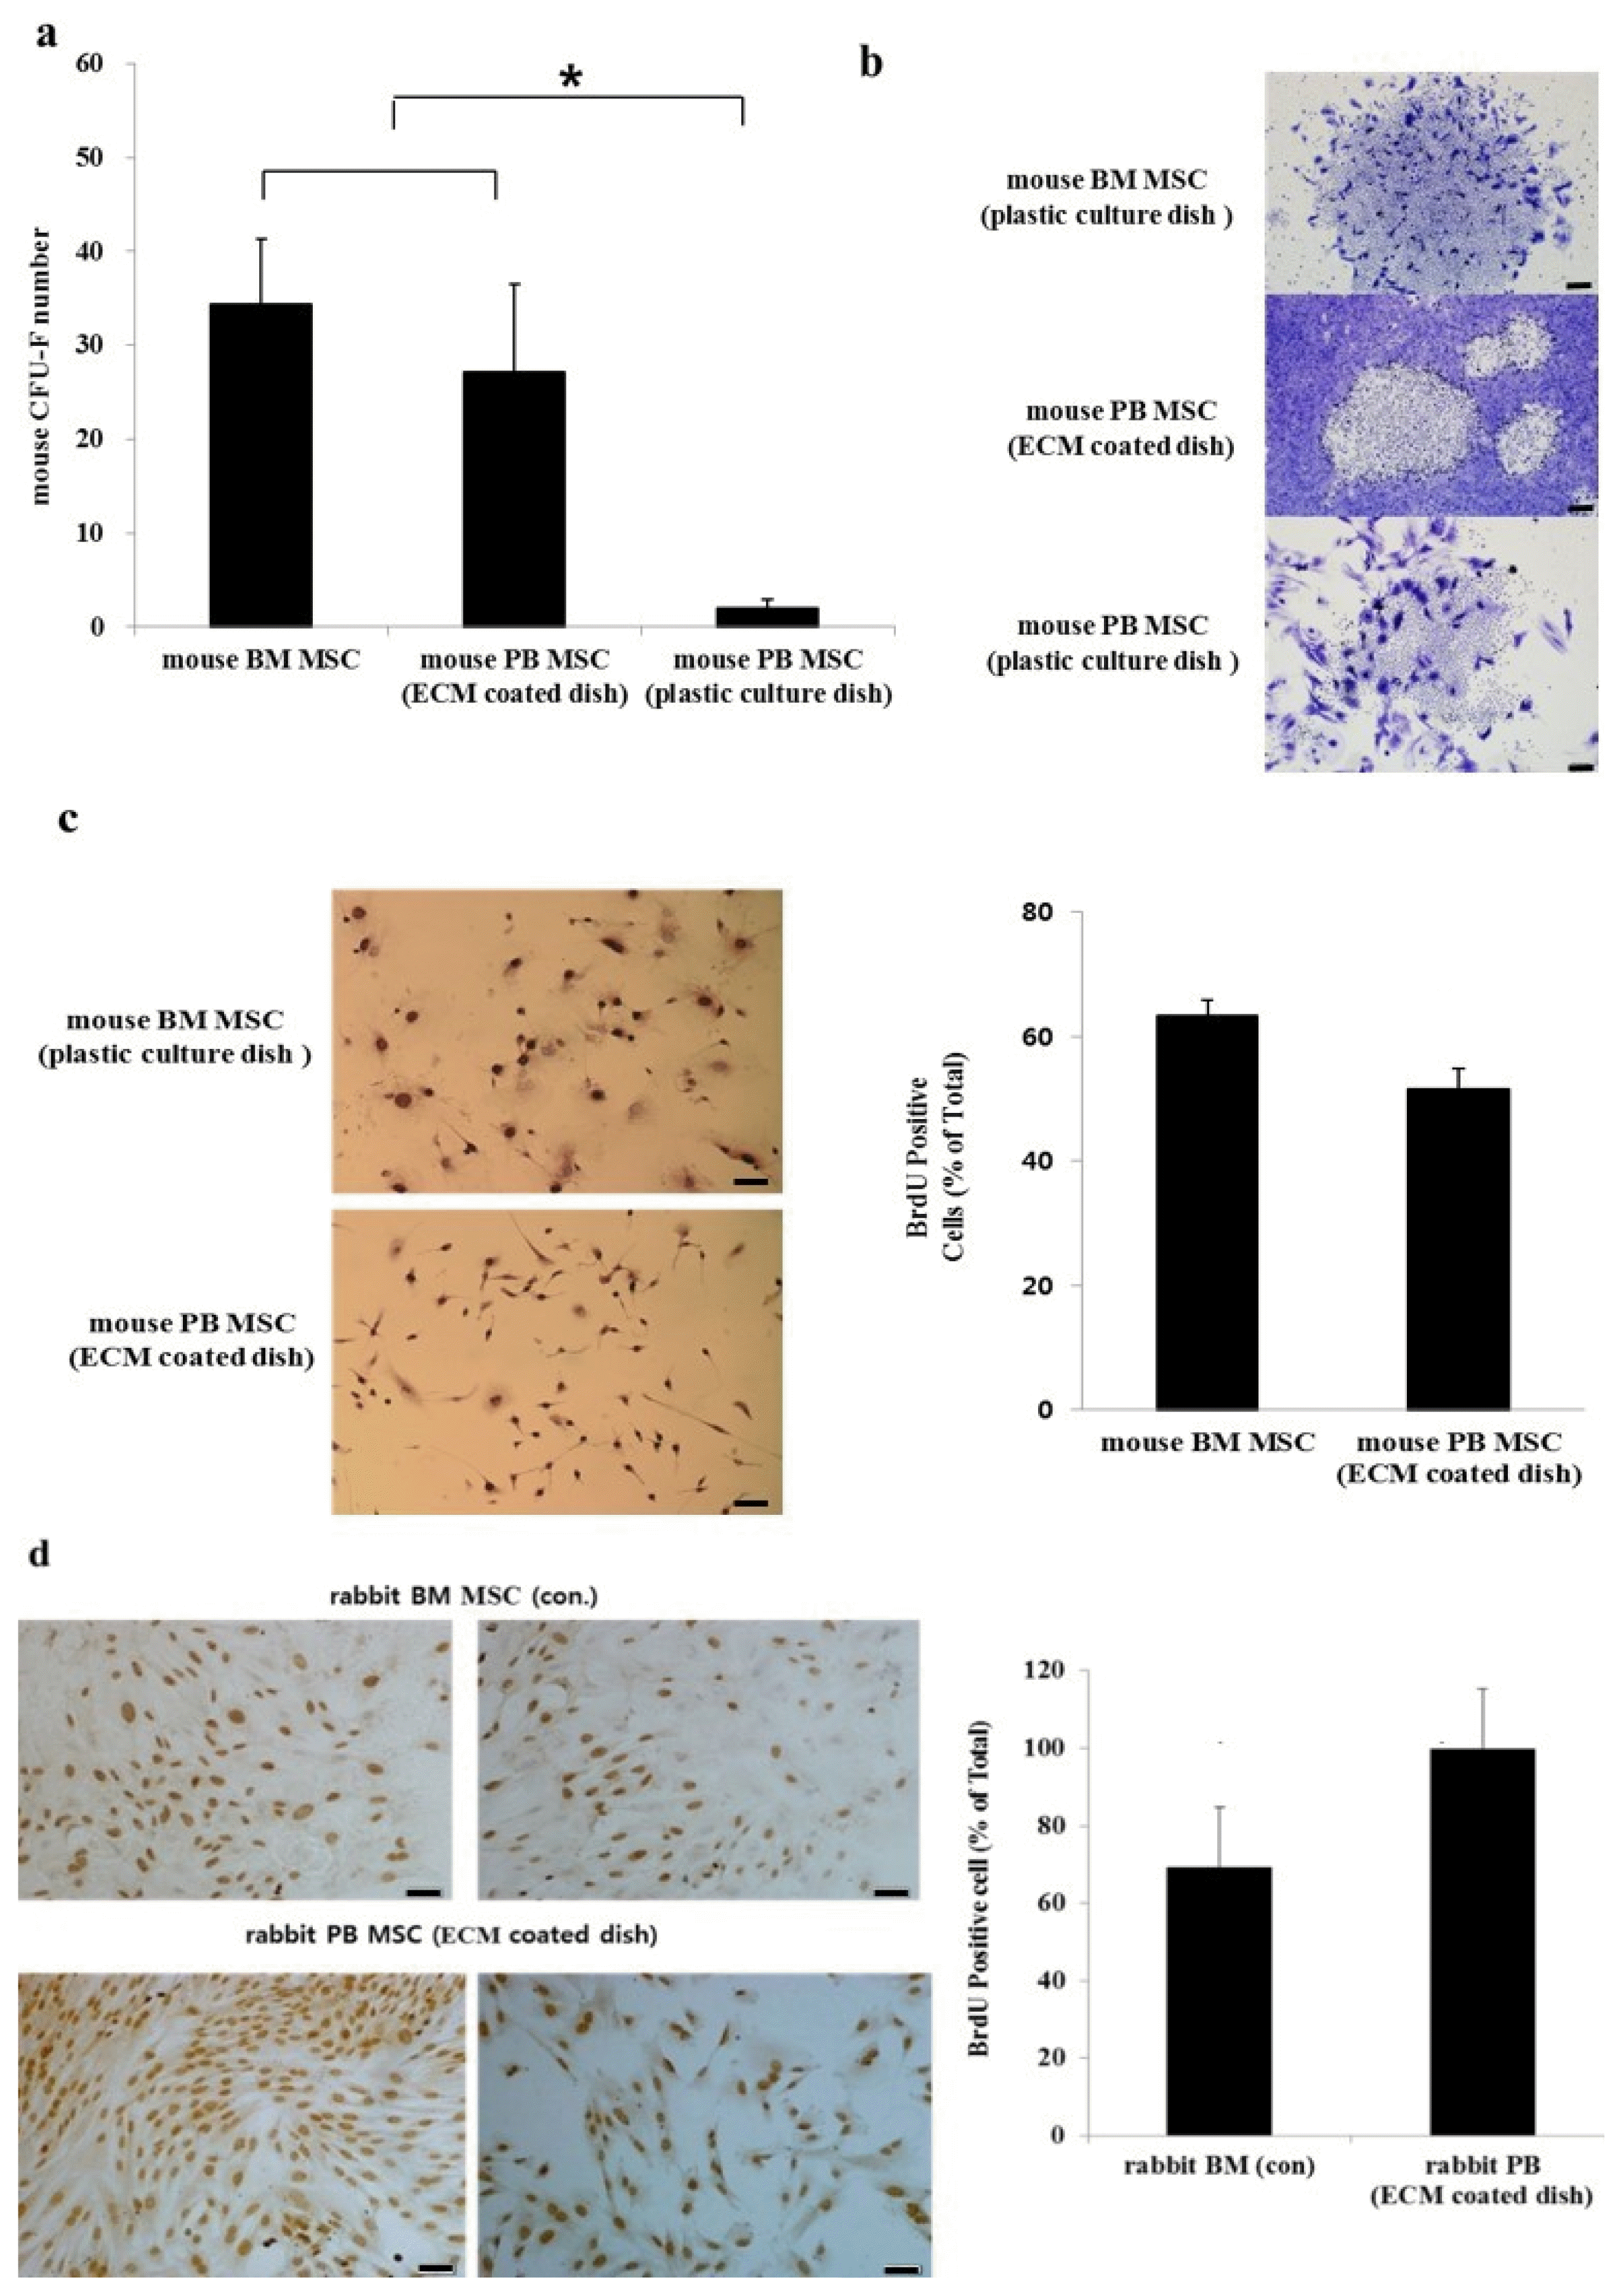 | Fig. 1CFU-F and proliferation of BM MSCs and PB MSCs. (a) Mouse BM MSCs seeded on the normal culture dish showed substantial proliferation whereas mouse PB MSCs seeded on the same kind of dish produced significantly fewer CFU-Fs (*p<0.05). There was a significant increase in the number of mouse PB MSCs plated on ECM-coated culture dish compared with mouse PB MSCs plated on a normal dish (*p<0.05). (b) Analysis of colony morphology of three dishes at ×40 magnification revealed that BM MSCs adhere to each other in contrast to the dispersed nature of mouse PB MSCs in culture. (c) Self-renewal capacity of mouse BM MSCs and mouse PB MSCs and morphology of these cells (×200 magnification). The proliferation of mouse BM MSCs and mouse PB MSCs measured by BrdU incorporation were similar (*p>0.05). Data were obtained from the mean±SE of nine fields. (d) Self-renewal of rabbit BM MSCs and rabbit PB MSCs. The proliferation of rBM MSCs and rPB MSCs measured by BrdU incorporation. Analysis of variance (**p<0.01). Scale bars=50 μM.
|
In contrast, rabbit PB MSCs had a significantly higher BrdU uptake rate than rabbit BM MSCs (Fig. 1d).
Flow cytometric analysis
The expression of mouse and rabbit cell markers related to stem cells such as MSCs and hematopoietic stem cells was measured using flow cytometry.
In the mouse, more than 90% of both populations expressed CD29 (β1 integrin) and CD44, over 50% of both populations expressed Sca-1 (stem cell antigen-1), and over 30% of both populations expressed CD105 (endoglin) and Oct-4 (octamer-binding transcription factor 4). Neither population expressed the hematopoietic stem cell markers CD14, CD34, or CD117 (Fig. 2a).
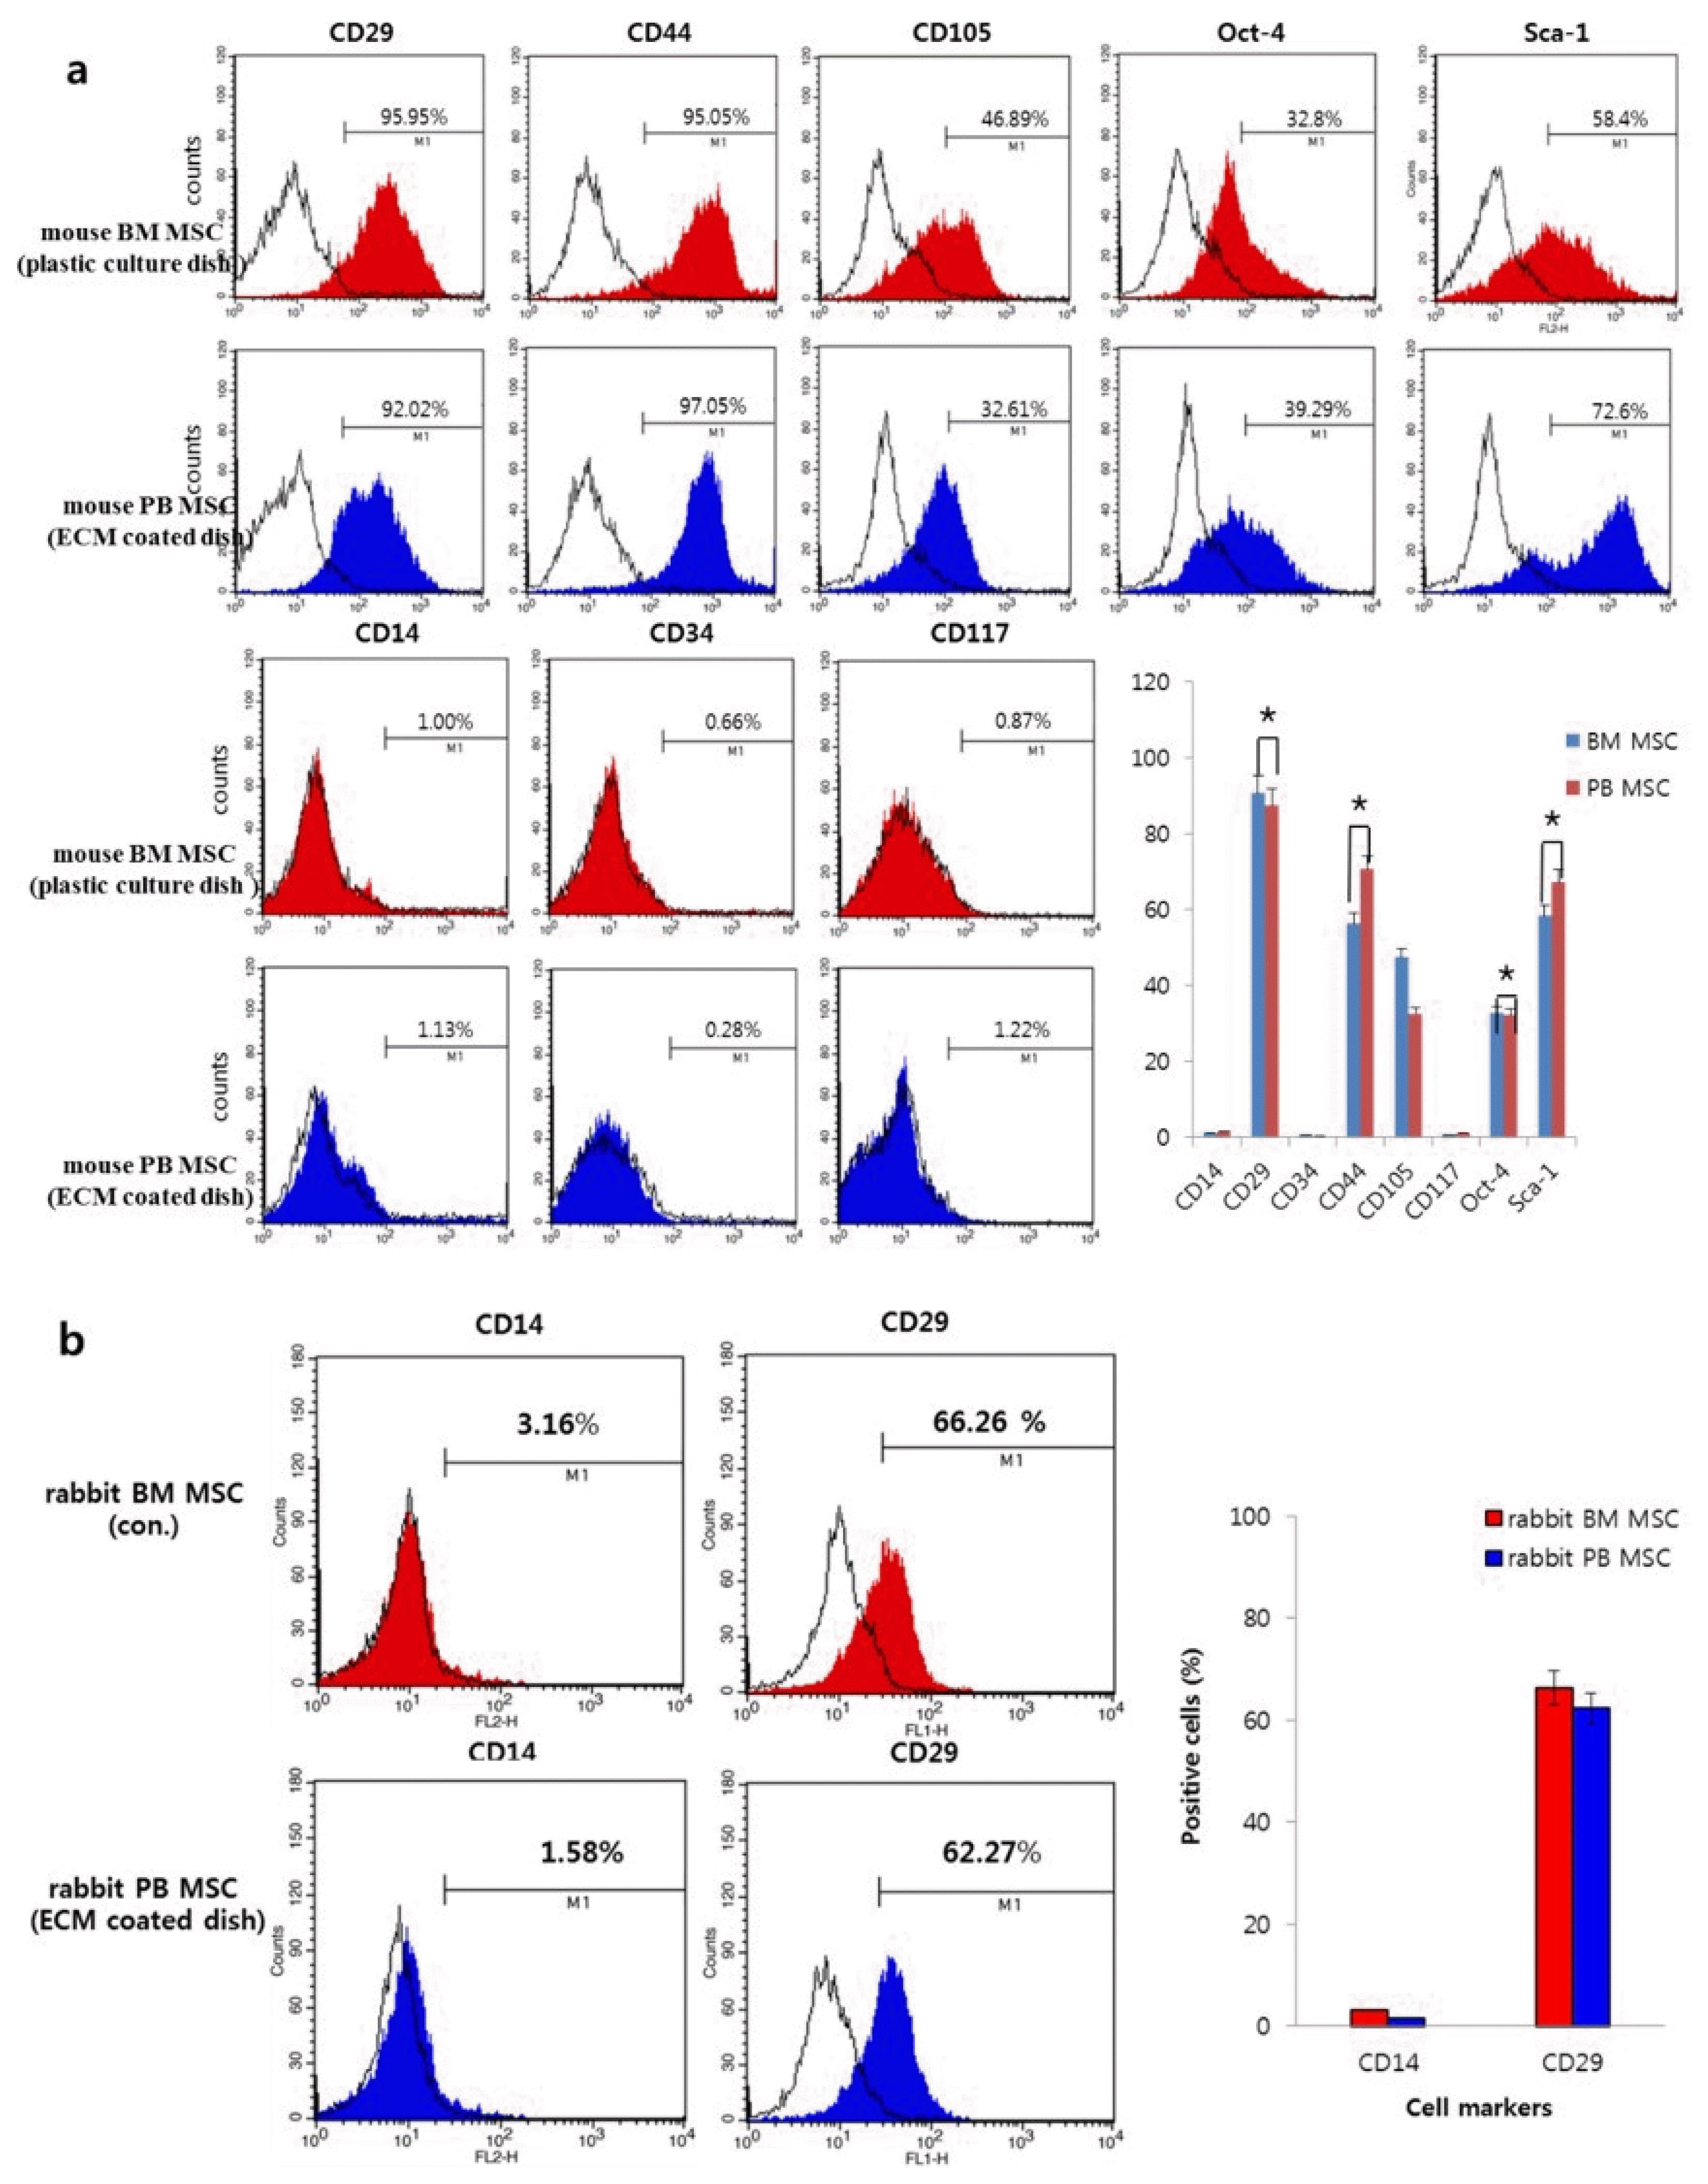 | Fig. 2FACS analysis. (a) Flow cytometric analysis of the expression of mouse markers related to stem cells such as MSCs and hematopoietic stem cells. (b) Flow cytometric analysis of the expression of rabbit cell markers related to stem cells such as MSCs and hematopoietic stem cells. Data show mean±SE of three independent experiments (*p>0.05).
|
In the rabbit, the expression of surface markers was similar between the two cell populations. Over 60% of both populations expressed CD29 and neither population expressed CD14 (hematopoietic stem cell markers) (Fig. 2b).
Multipotent differentiation
The multipotent differentiation potential of the mouse PB MSCs toward osteoblasts and adipocytes was determined and compared with that of mBM MSCs (Fig. 3a~c). Alizarin Red S staining showed that mPB MSCs were similar to regular mBM MSCs with respect to osteogenic differentiation in vitro. However, analysis of bone nodule formation showed that mBM MSCs accumulated significantly more bone nodules than mPB MSCs (p<0.05). The expression of alkaline phosphatase, RUNX-2, and osteocalcin mRNA in BM MSCs and PB MSCs was analyzed after 2 weeks of osteogenic induction (Fig. 3b).
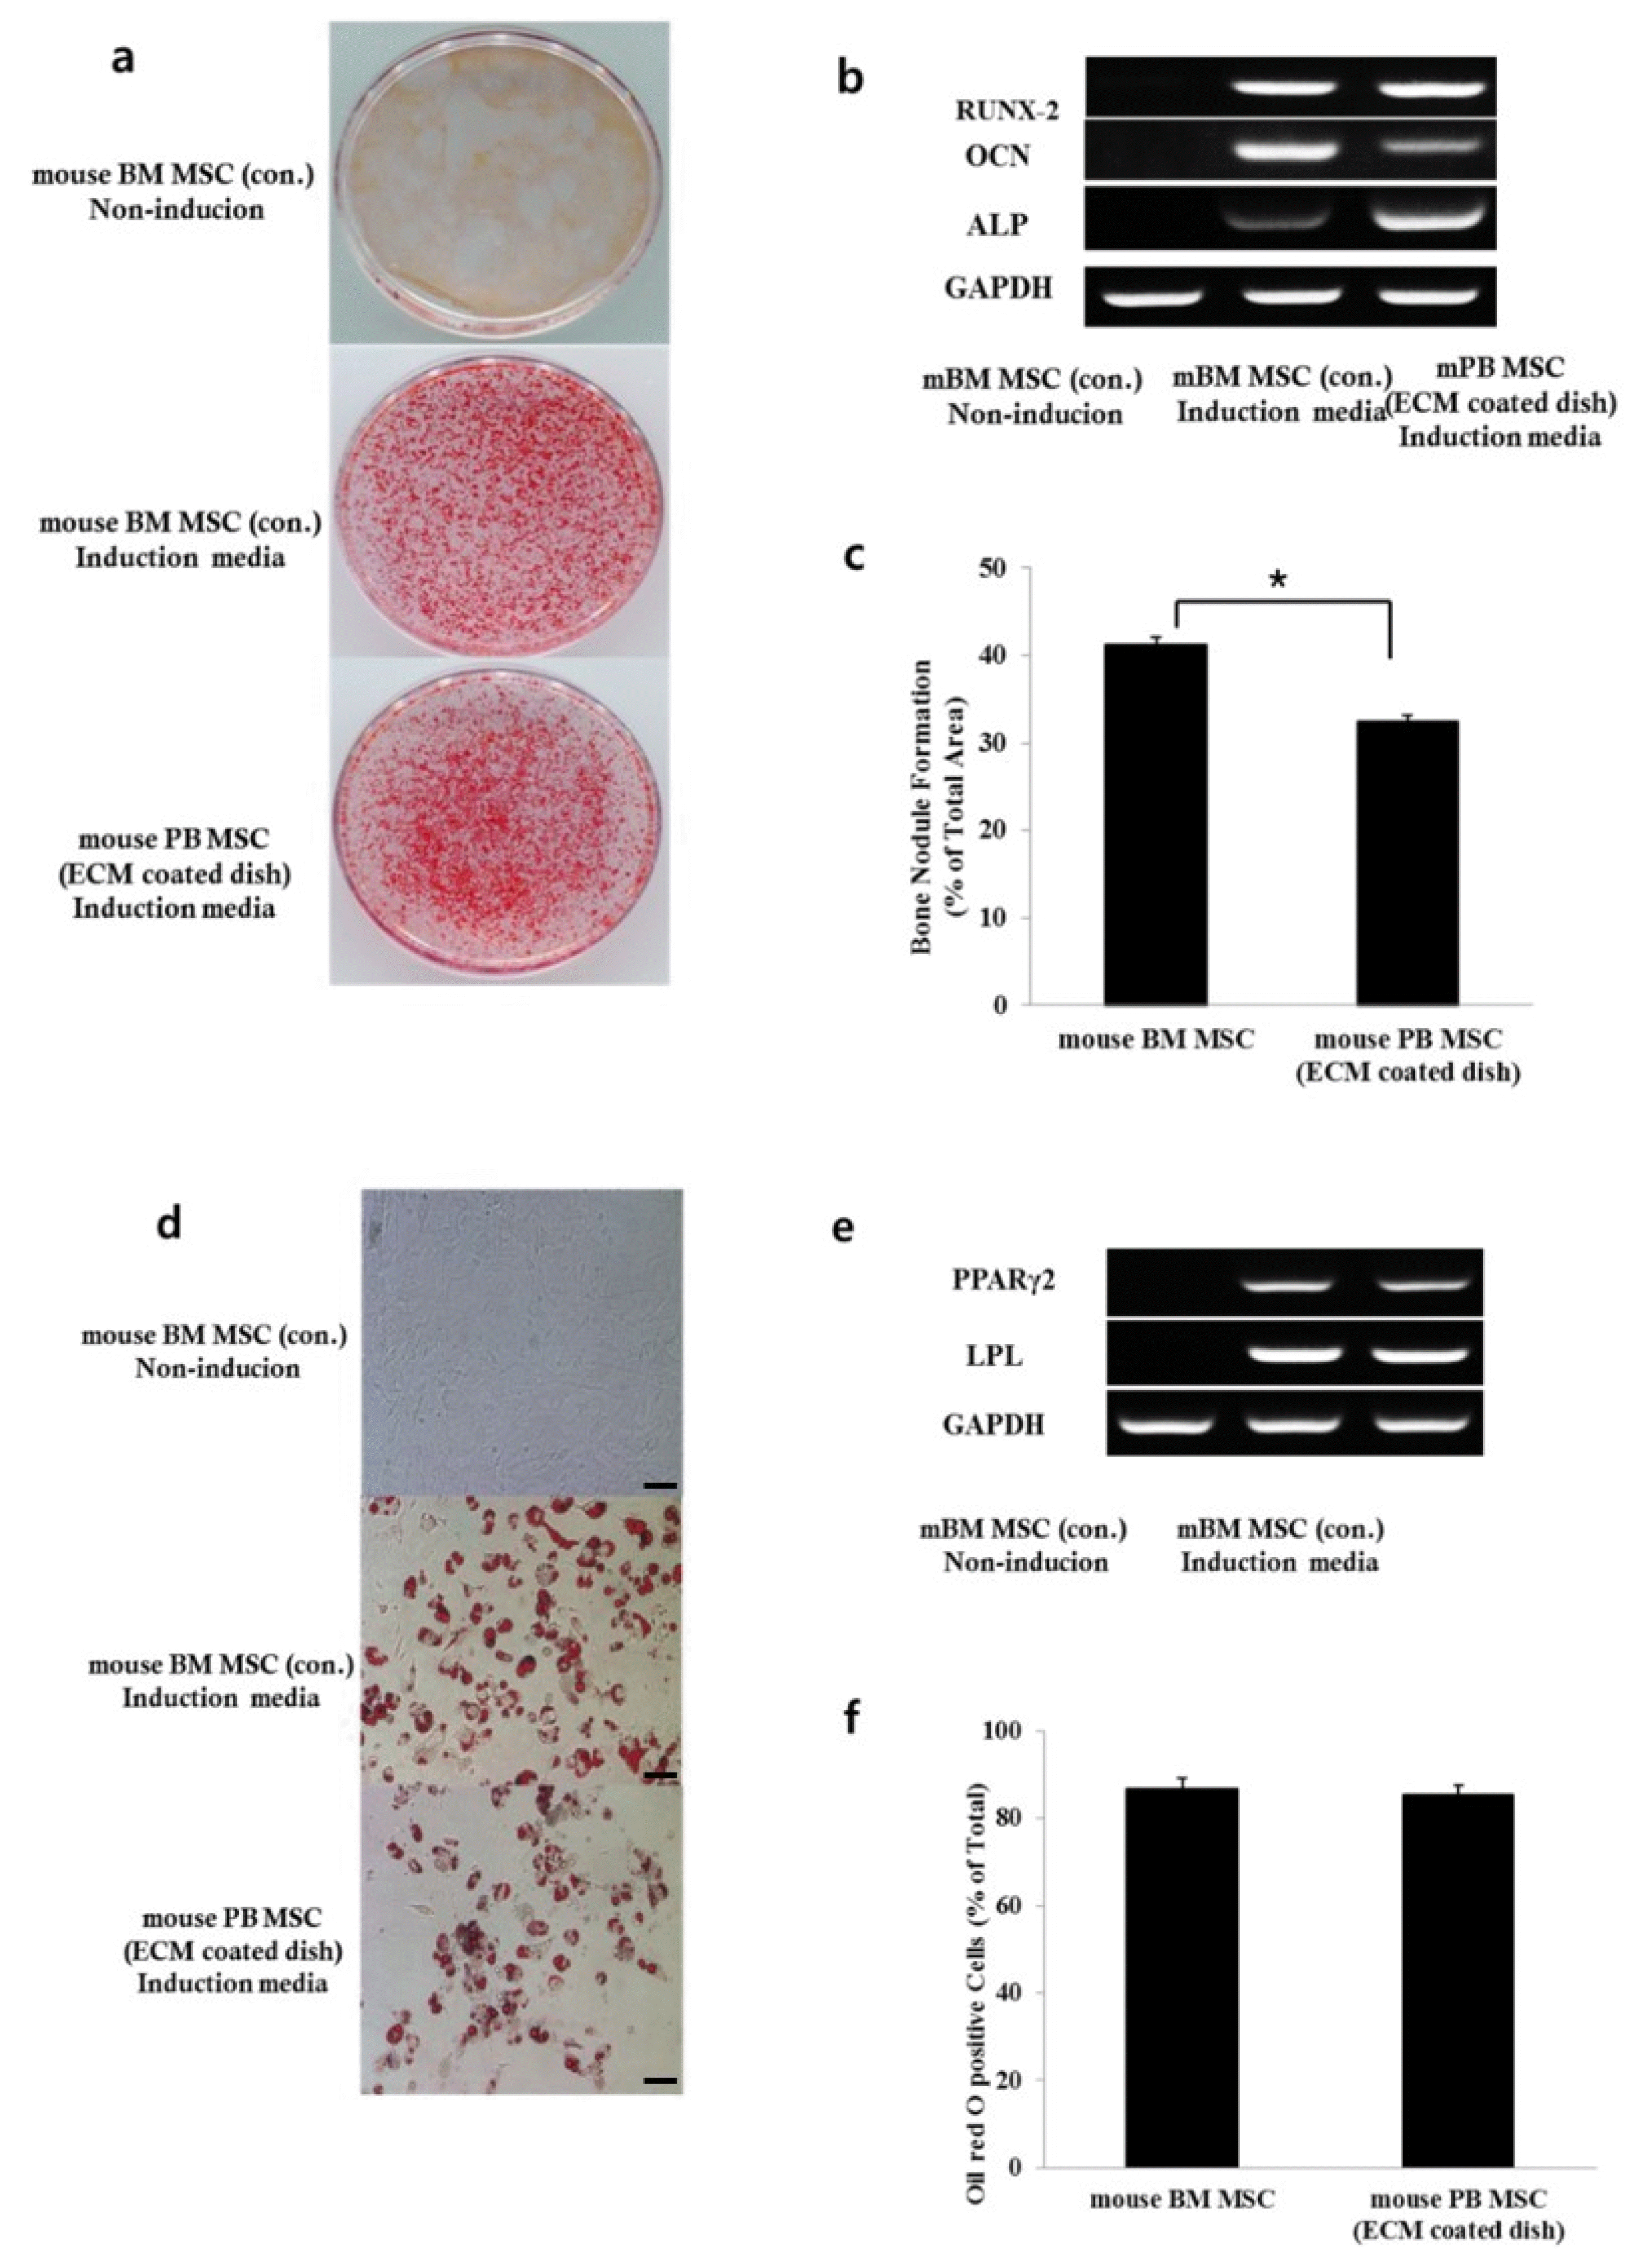 | Fig. 3Osteogenic and adipogenic differentiation of mouse BM MSCs and mouse PB MSCs in vitro. (a) Calcium accumulation revealed by alizarin red S staining at ×200 magnification. (b) Expression of RUNX-2, OCN, and ALP, which induce osteoblast differentiation, in both experimental groups. (c) Percentage of mineralized area/total area of the dish. Data show mean±SE of three dishes (*p<0.05). (d) Lipid droplets revealed by Oil red O staining at ×200 magnification indicating that the MSCs are capable of forming Oil red O-positive cells. (e) RT-PCR showing positive gene expression profiles related to adipogenic differentiation in induced cultures compared with uninduced (un) cultures. (f) A number of cells staining positive/total number of cells. Data show mean±SE of five fields (*p>0.05).
|
Oil Red O staining of lipid droplets, which is an indicator of adipogenesis, showed a similar result (p>0.05) (Fig. 3d~f). We found that mPB MSCs were similar to mBM MSCs in the formation of Oil red-O positive fat cells under adipogenic induction conditions. The expression of adipocyte-specific genes such as PPAR-γ 2 and Lipoprotein Lipase (LPL) was positive in adipogenic differentiated mBM MSCs and mPB MSCs (Fig. 3e).
After osteogenic induction of the rabbit cells, both rPB MSCs and rBM MSCs showed positive staining for alizarin red S, but rPB MSCs accumulated significantly more bone nodules than rBM MSCs (p<0.05) (Fig. 4a~c). Very few cells showed positive staining in the controls cultured in the base medium. RUNX-2, which induces osteoblast differentiation, was expressed in both experimental groups.
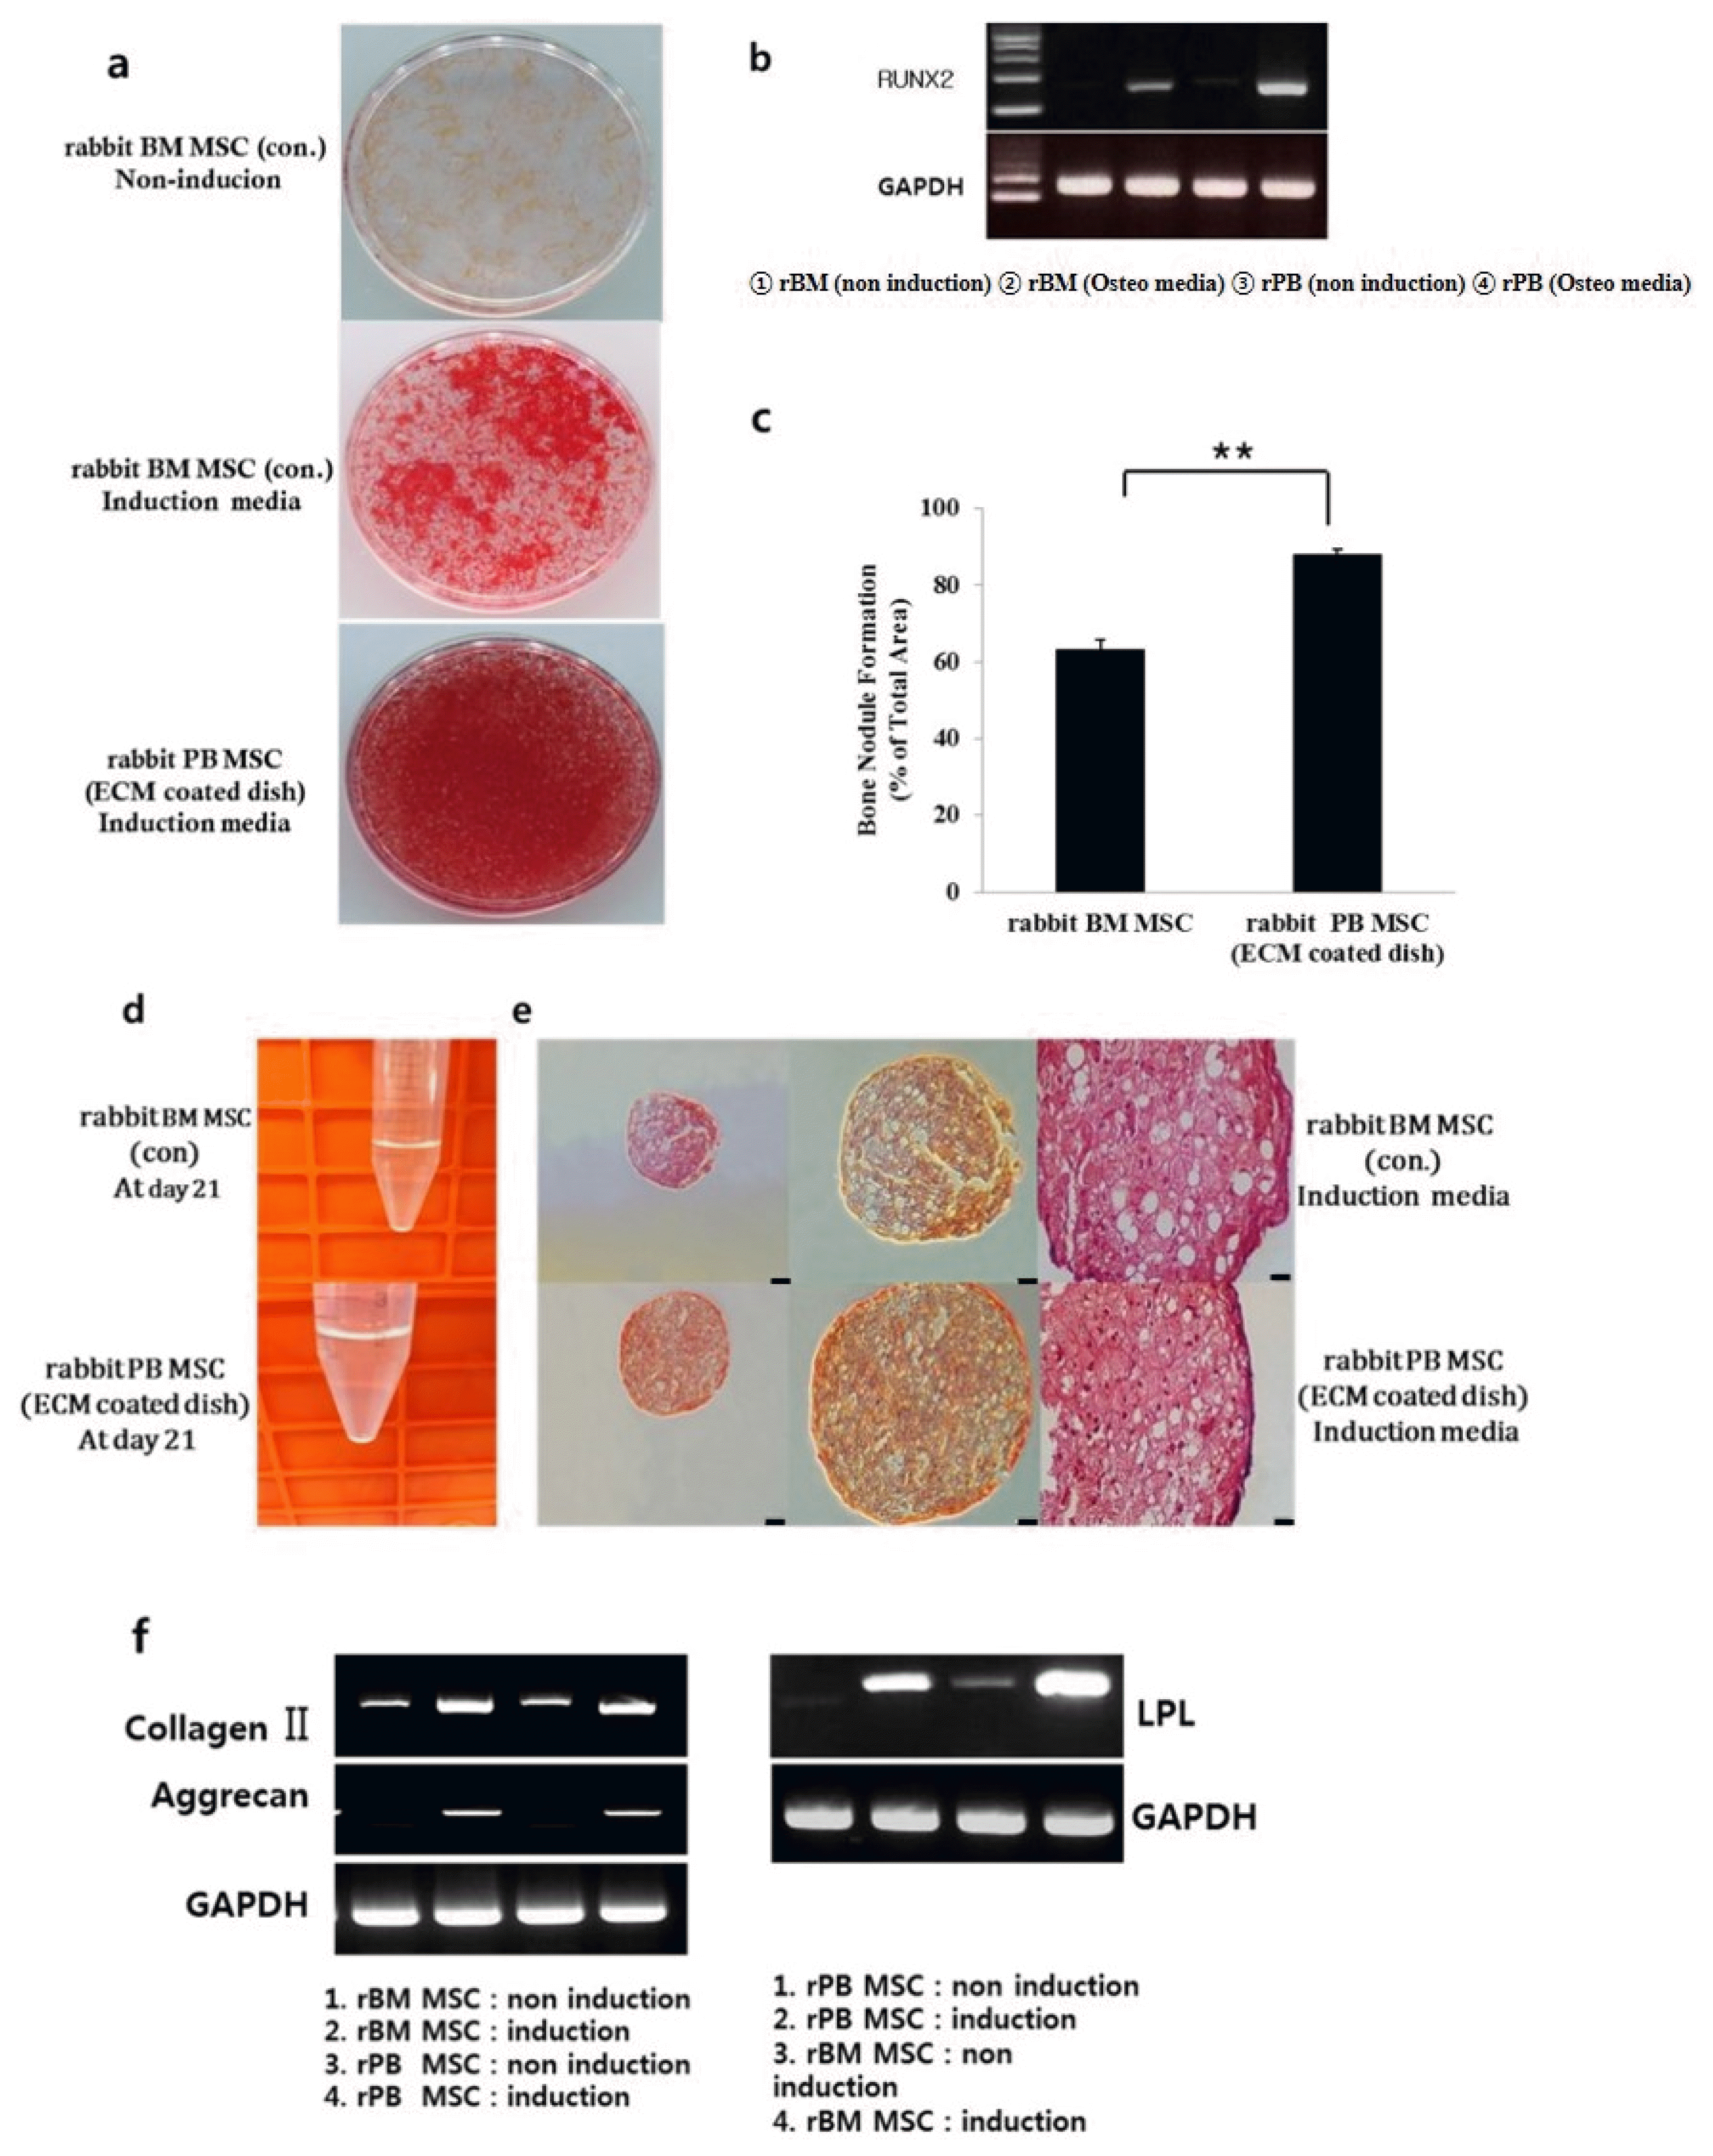 | Fig. 4Osteogenic and Chondrogenic differentiation of rabbit BM MSCs and rabbit PB MSCs in vitro. (a) Calcium accumulation revealed by alizarin red S staining at ×200 magnification. (b) Expression of RUNX-2, which induces osteoblast differentiation, in both experimental groups. (c) Percentage of mineralized area/total area of the dish. Data show mean±SE of three dishes (*p<0.05) (d) Aggregate pellet culture. Aliquots of rabbit BM MSCs and rabbit PB MSCs form a spherical pellet in 21 days. (e) Histologic sections were stained with Safranin-O. The stained images are presented as a whole sample (first columns, ×100) and at high magnification (second and last columns, ×200, ×400). (f) Total RNA was isolated from rabbit BM MSCs and rabbit PB MSCs and expression levels of type II collagen, aggrecan, and GAPDH were examined by RT-PCR analysis.
|
In the pellet culture system, the chondrogenic commitment was observed at 21 days (Fig. 4d). On histologic evaluation, rPB MSCs and rBM MSCs showed positive staining for Safranin O (Fig. 4e). RT-PCR analysis showed mRNA expression of type II collagen and Aggrecan. Successful chondrogenic differentiation was indicated by the expression of typical genes of the chondrogenic lineage.
Expression of adipocyte-specific genes such as LPL was observed in differentiated mBM MSCs and mPB MSCs (Fig. 4f).
In vivo transplantation
To determine the multi-differentiation potential of BM MSCs and PB MSCs in vivo, we transplanted BM MSCs and PB MSCs subcutaneously into immunocompromised mice using hydroxyapatite/tricalcium phosphate (HA/TCP) as a carrier. At 8 weeks after implantation, bone formation was observed in both BM MSC and PB MSC implants (Fig. 5). There was no bone in implants that were not loaded with cells (data not shown).
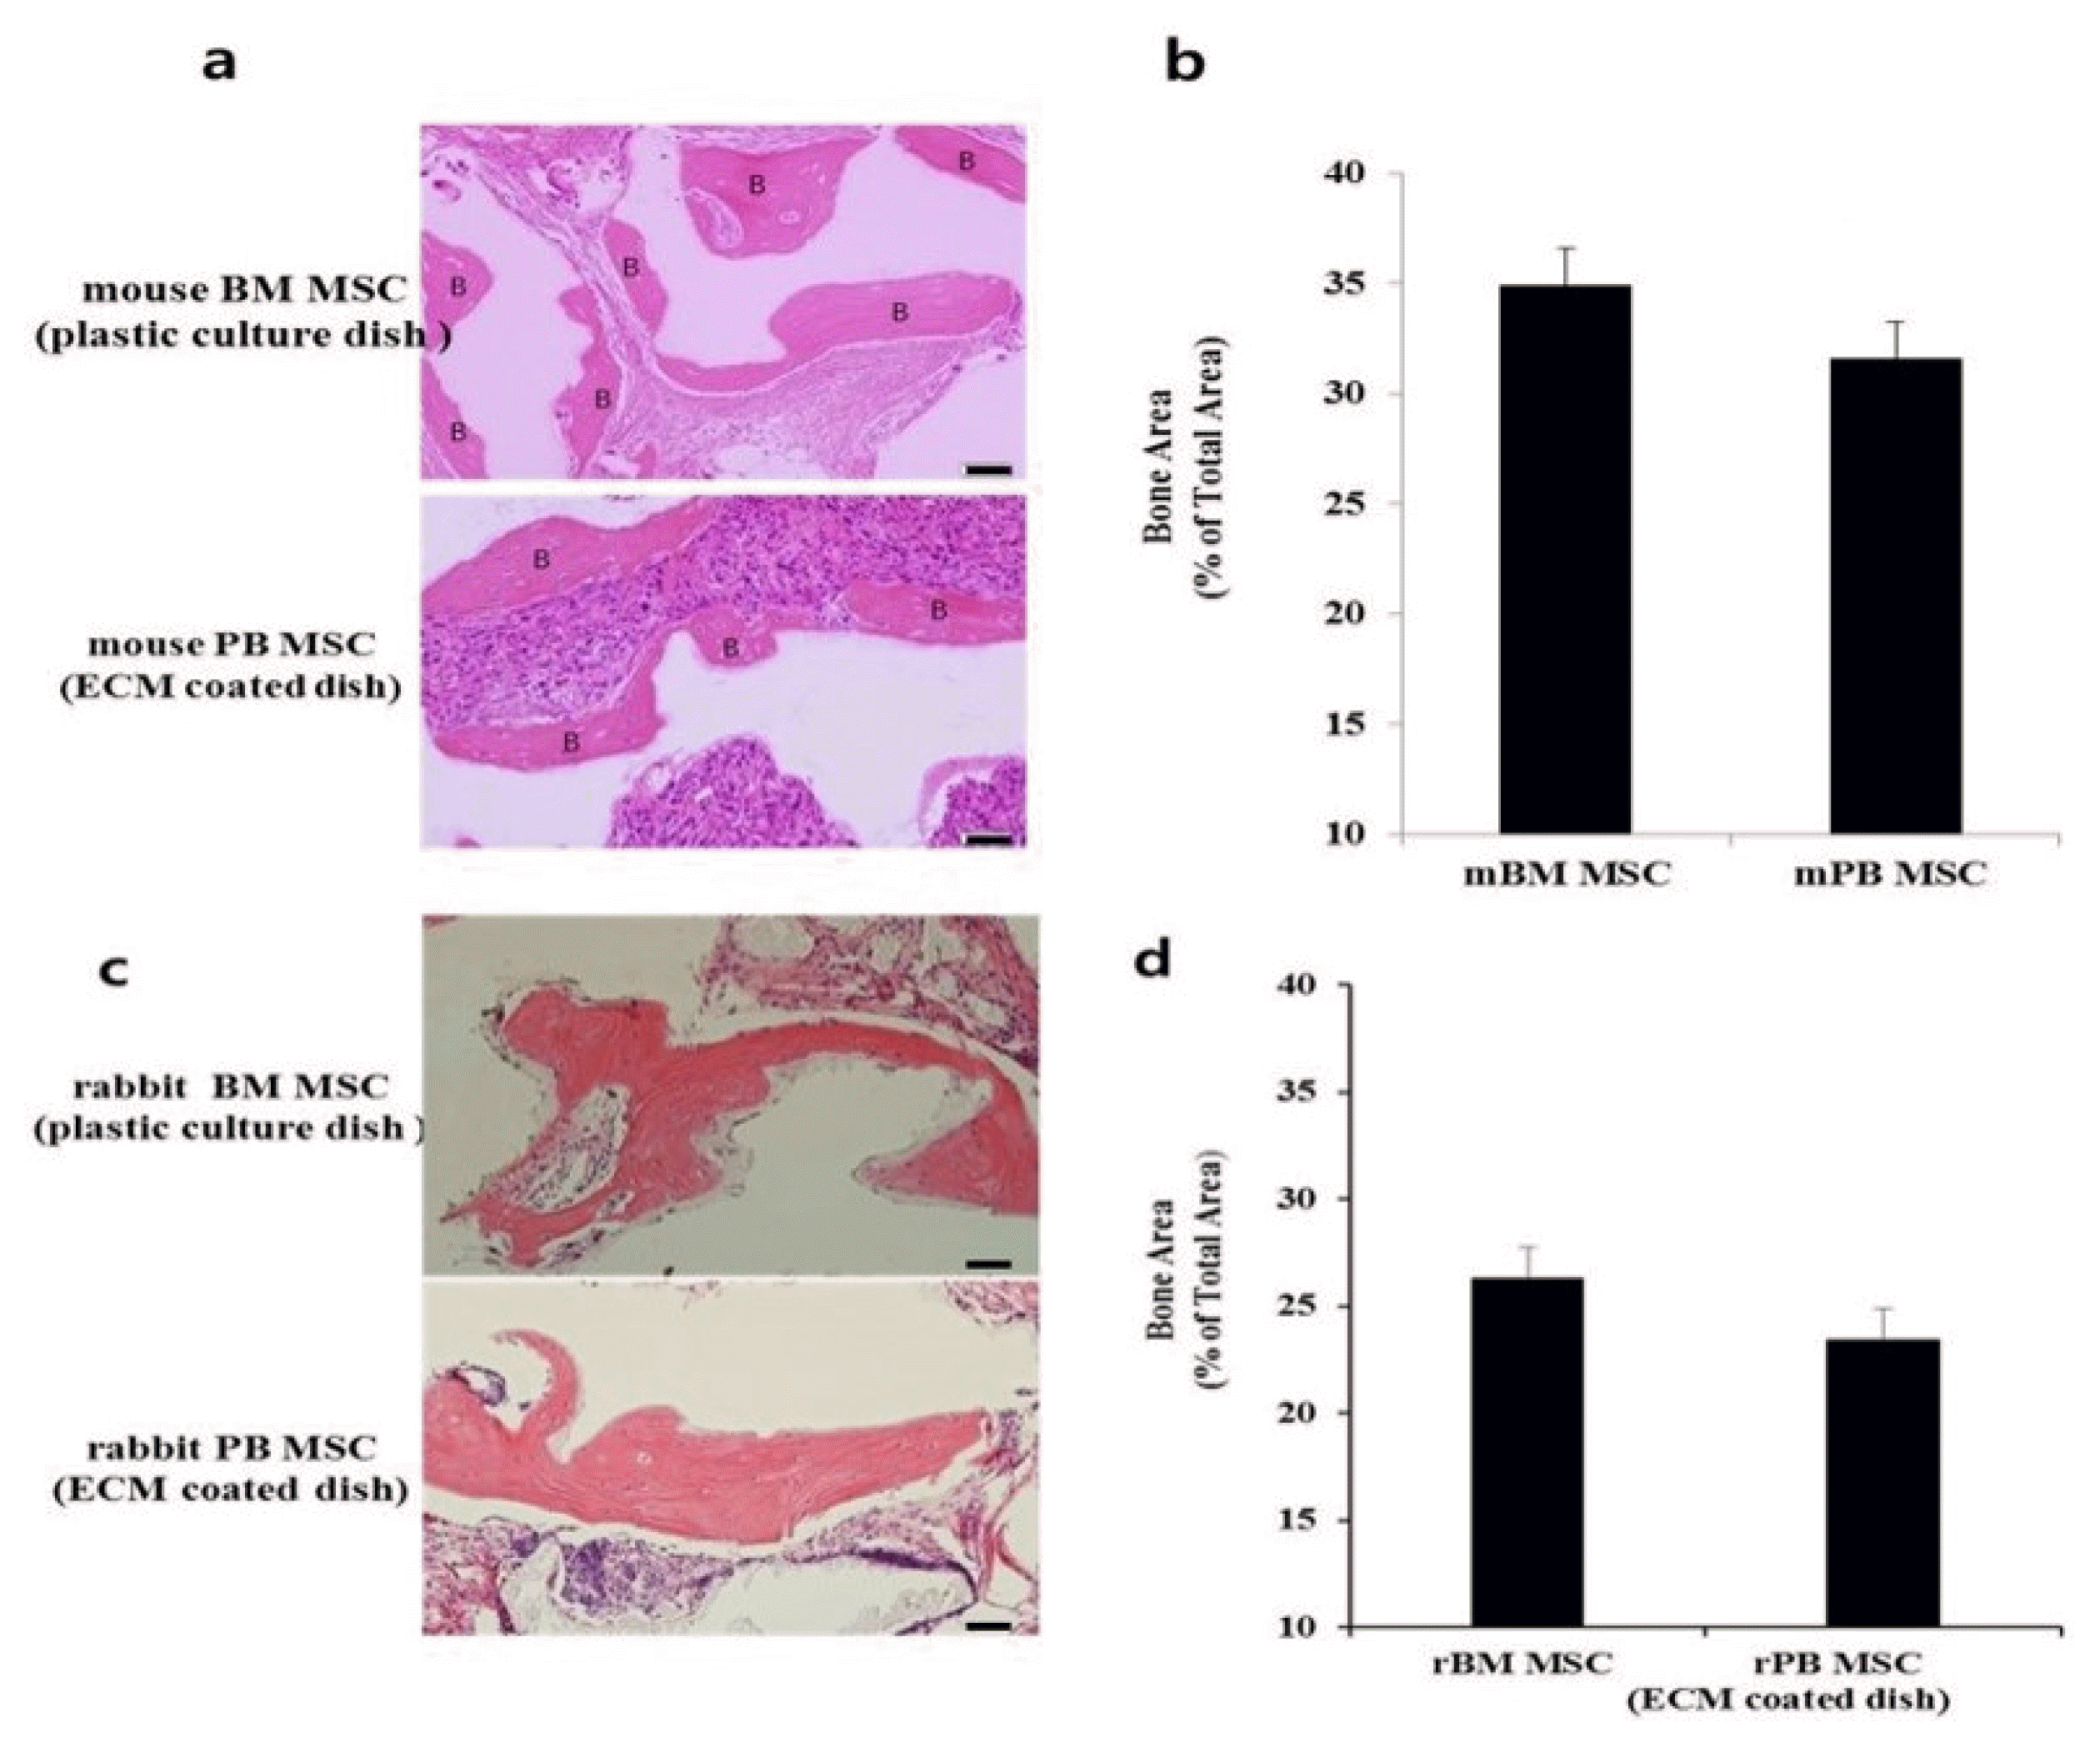 | Fig. 5Bone formation of BM MSCs and PB MSCs in vivo after transplantation into immunocompromised mice. (a, c) Bone formation by in vivo transplantation of mouse and rabbit MSCs. After 8 weeks, the transplants were harvested and sections were stained with H&E to evaluate bone formation. Scale bar=50 μm. (b, d) PB MSCs generate as much bone area as BM MSCs (*p>0.05). Data show mean±SE of bone area.
|
The amount of bone generated at 8 weeks after implantation of mBM MSCs and mPB MSCs was 34.9±0.36% and 31.6±2.96% and rBM MSCs and rPB MSCs was 26.3±0.23% and 23.4±1.01% of the total area respectively (Fig. 5). There was no significant difference between the two groups (p>0.05).
Effect of PI3 kinase on mesenchymal stem cell attachment
To investigate whether PI3K is involved in MSC attachment, we determined the effects of the specific PI3K inhibitors LY294002 and Wortmannin on primary mouse bone marrow stem cells using the colony-forming assay.
We developed a hypothetical model of how PI3 kinase inhibitors LY294002 and Wortmannin might affect adherent CFU formation. After mBM MSCs had attached to plastic dishes for 16 days, the PI3 kinase inhibitors LY294002 and Wortmannin were added to cell cultures at concentrations of 5~100 nm for 10 to 30 minutes and the colony forming efficiency of cells in the suspension was determined. The number of colony-forming cells in the supernatant significantly increased in a dose-dependent manner in LY294002- and Wortmannin-treated groups. Mouse BM MSCs, mouse BM matrix cells, and mouse PB cells were treated with inhibitors at various concentrations and the surviving cell number was determined by trypan blue count assay. LY294002 treatment significantly increased the viable cell numbers in the supernatant in a dose- and time-dependent manner (Fig. 6).
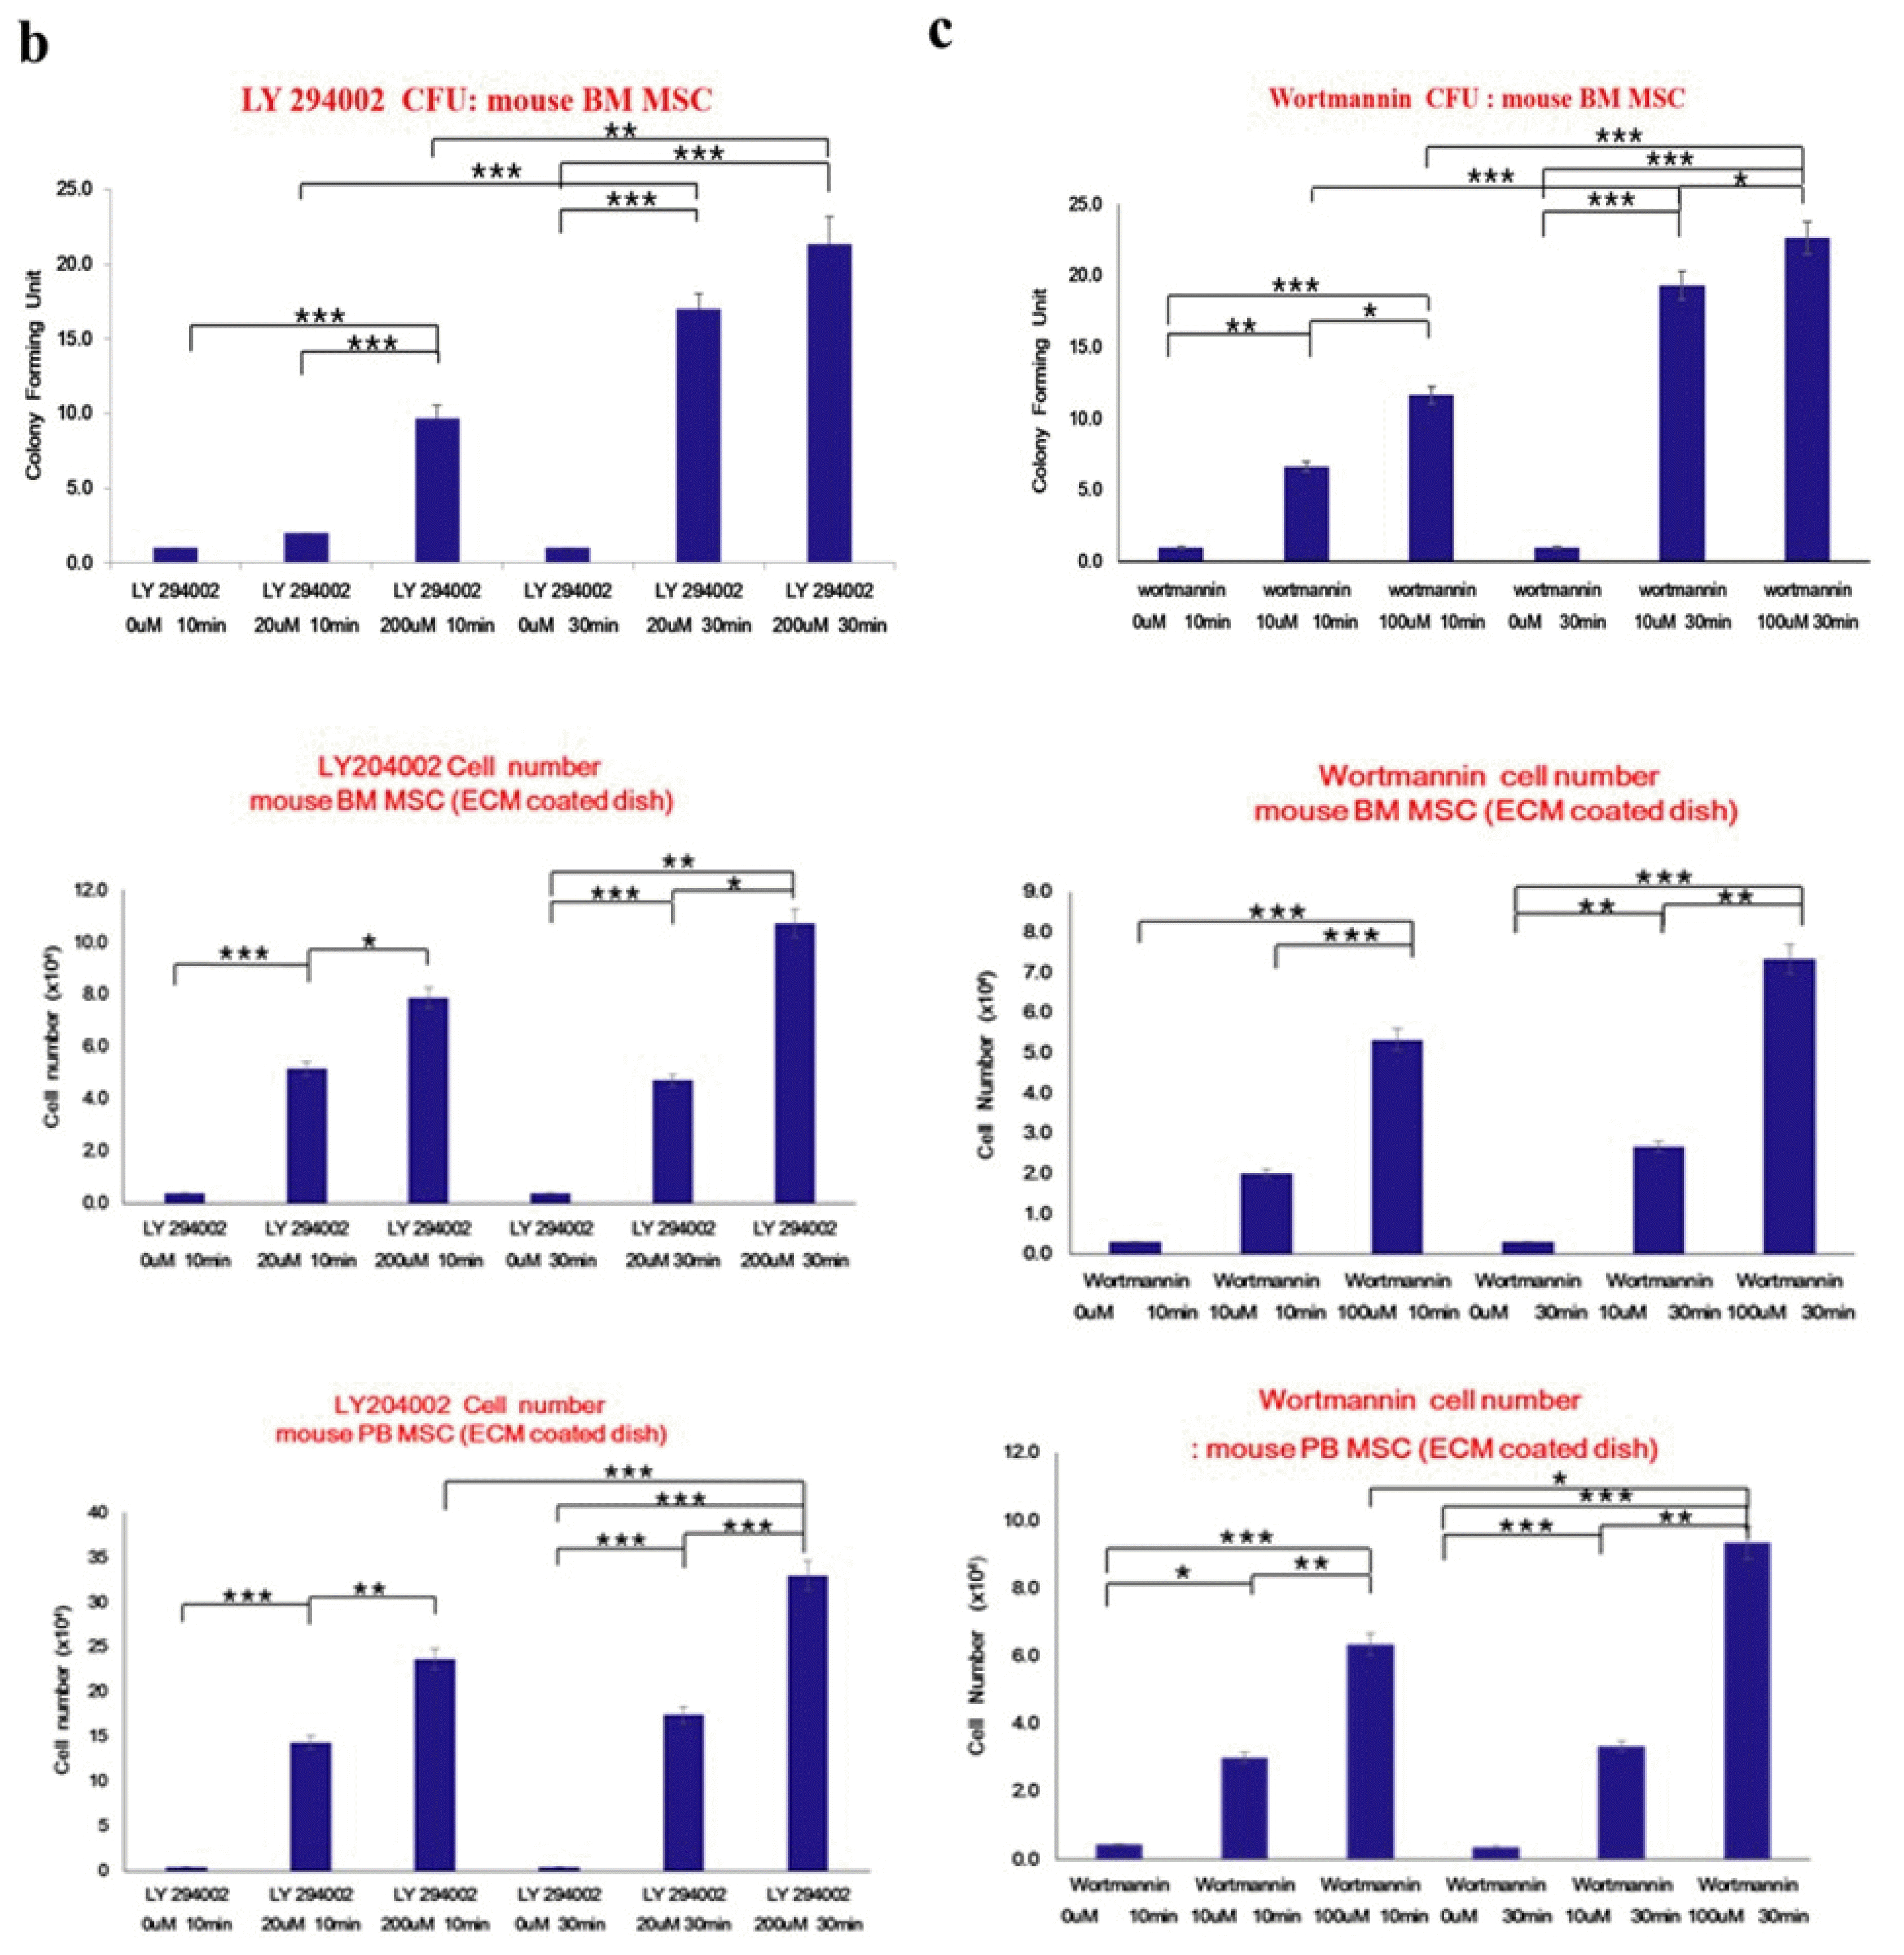 | Fig. 6PI3K modulates the number of adherent colony-forming unit-fibroblasts (CFU-Fs) in primary bone marrow cultures. (a) Hypothetical model showing the culture of mouse BM MSCs on culture dish for 16 days, before treatment with the PI3K inhibitors LY294002 (20 μM and 200 μM) and Wortmannin (10 μM and 100 μM) for 10 min and 30 min. The colony forming efficiency of cells from suspension was determined. (b, c) Mouse BM MSCs, mouse BM matrix cells, and mouse PB cells were treated with inhibitors at various concentrations and cell number was determined by trypan blue assay. Left panel: Colony forming assay of mouse BM MSCs in suspension after culture for 16 days and treatment with LY294002. Right panel: Colony forming assay of mouse BM MSCs in suspension after culture for 16 days and treatment with Wortmannin. Wortmannin treatment increased the number of cells in the supernatant in a dose- and time-dependent manner. Data are presented as means±SD. Statistical analysis was performed using Student’s t-tests. *Indicates significant difference versus control (*p<0.05; **p<0.01; ***p<0.001 by Student’s t-test).
|
These data imply that PI3 kinase modulates the number of adherent colony-forming unit-fibroblasts (CFU-F) in MSC cultures.
Go to :
Discussion
In this study, we developed a method to effectively obtain MSCs from PB using ECM, which provides not only structural support for the cells but also biochemical cues that modulate cell physiology and phenotype (21). We showed that the number of PB CFU-Fs on an ECM-coated dish was much higher than that on a normal plastic dish and demonstrated that culturing PB MSCs on ECM promoted replication of CFU-Fs. There are many explanations for the lack of PB CFU-Fs on plastic culture dishes; for example, the mononuclear cells obtained from PB yield an adherent layer of heterogeneous cells in the primary culture, therefore accessory cells such as lymphocytes, macrophages, or other hematopoietic cells might prevent the proliferation of CFU-Fs. We further characterized the PB MSCs in comparison with BM MSCs. Under previously described conditions the CFU-F frequency for MSCs in adult BM was one in 3.5×10⁴ cells (15); however, PB did not produce CFU-Fs under the same conditions suggesting that the frequency of MSCs in PB is so low that their survival or growth might be greatly affected by culture conditions (22). In our study, the frequency of PB MSCs in the normal medium was enhanced by ECM interaction. The colony forming experiment did form at four weeks but not at two weeks. The ECM may enhance the function of putative accessory cells that support CFU replication such that PB MSCs on ECM-coated matrix exhibited almost a 12- to 13-fold increase in the number of CFU-Fs. As measured by BrdU incorporation, the proliferation of PB MSCs on an ECM-coated dish was similar to that of BM MSCs on a normal dish. Therefore, we have demonstrated a method for obtaining MSCs from PB for clinical applications.
We conducted several experiments to determine whether MSCs isolated from PB have stem cell properties similar to those of BM MSCs (i.e., clonogenicity, self-renewal, and multipotentiality). PB MSCs and BM MSCs expressed a similar pattern of cell surface antigens and had a similar cellular morphology (flattened and spindle-shaped adherent cells) in culture, suggesting a similarity between the two cell populations. When cultured in induction media both PB MSCs and BM MSCs showed lipid droplets and calcium deposits as previously described (23). As shown by FACS analysis, PB MSCs do not display hematopoietic markers (e.g., CD14, CD34, and CD117), similar to BM MSCs. RT-PCR showed positive expression profiles for genes related to adipogenic and osteogenic differentiation. Following the demonstration of PB MSCs in vitro, we conducted experiments in immunodeficient mice to evaluate our hypothesis in vivo. Although the bone regeneration capacity of BM MSCs was slightly higher than that of PB MSCs, we demonstrated that PB MSCs are able to form new bone in vivo.
The multipotential differentiation capacity of the PB MSCs makes them candidates for tissue engineering and suggests clinical applications in the treatment of tendon, ligament, and bony defects. BM MSCs are believed to proliferate and differentiate into osteoblasts to fill bony defects in response to a cascade of events induced by injury infliction signals (24). PB represents a safe and easy source of MSCs, compared with the potential complications associated with BM aspirates (25).
There is convincing evidence that MSCs circulate in PB and can be mobilized into the bloodstream by various cytokines. This is of therapeutic interest since it would allow the collection of MSCs from PB and suggests the therapeutic potential of their continual homing to injured tissues. Lakkakorpi et al. (26) have shown that attachment-induced activation of osteoclasts involves recruitment of signaling molecules to the osteoclast fraction. Treatment of osteoclasts with the PI3-K inhibitor Wortmannin disrupts assembly of this complex. In osteoclasts, the PI3K signaling pathway plays an essential function in the mediation of resorptive activity, attachment, and motility. In addition, PI3K was shown to stimulate actin formation and regulate cytoskeletal functions such as spreading and attachment (27).
In summary, our findings provide convincing support for the hypothesis that the ECM component of the niche that fosters CFU-Fs in the PB and the ECM modulates the balance between proliferation and differentiation in response to appropriate signals (28). This interesting finding demonstrates the presence of circulating MSCs in PB and the feasibility of isolating them using ECM (22). Based on this study, PB MSCs from a patient who undergoes implant surgery could be used to facilitate the healing of bony defects through the collection of simple blood aspirates.
Further studies aimed at isolating MSCs from the PB of humans are necessary to develop cell-based therapies. Moreover, we suggest that PB MSCs obtained through a simple blood draw can be used to facilitate the healing of bony defects in cases of implant surgery for patients who need commercially utilized biocompatible implants to replace their teeth or bone. To properly address this issue, further investigations on the role of PI3K in mesenchymal stem cell attachment will be necessary. Nonetheless, our current studies extend our understanding of PI3-kinase in cell attachment.
Go to :
 XML Download