Introduction
Materials and Methods
Experimental animals and ulcer induction
Control group: ulcers were left without any treatment.
PRP group: ulcers were treated with local injection of 0.1 ml of freshly prepared PRP solution at five points, four points circumferentially around the margins and the fifth point in the ulcer centre, using a 27-gauge syringe, immediately after ulcer induction. The injection was 2~3 mm deep and was done slowly to allow proper diffusion of solution in the loose connective tissue in the submucosa of cheeks.
BMSCs group: ulcers were treated with local injection of the isolated BMSCs solution (1×10⁶ cells suspended in 0.1 ml of complete media) (15) at five points, four points circumferentially around the margins and the fifth point in the ulcer centre, using a 27-gauge syringe, immediately after ulcer induction. The injection was 2~3 mm deep and was done slowly to allow proper diffusion of solution in the loose connective tissue in the submucosa of cheeks.
PRP preparation
Culture, harvesting, and characterization of BMSCs
Evaluation of ulcer healing clinically, histologically and Immunohistochemically
Statistical evaluation
Results
Flow-cytometry characterization
 | Fig. 1Morphological characteristics of BMSCs using Phase-contrast inverted microscope. (A) Passage 2, 80% confluent showing homogenously fibroblastic like cell monolayer (×100). (Black arrows) showing cells undergoing mitosis. (B) Higher magnification of cells (×400) passage 2 showing spindle shaped fibroblast like cells with processes forming a monolayer. (C & D) FACS analysis for BMSCs at passage 3 demonstrated that 98.76% and 99.35% of the cultured cells expressed the mesenchymal CD44 and CD90 markers respectively, while they were negative for CD34 hematopoietic marker. These results indicated that relatively purified MSCs were isolated. |
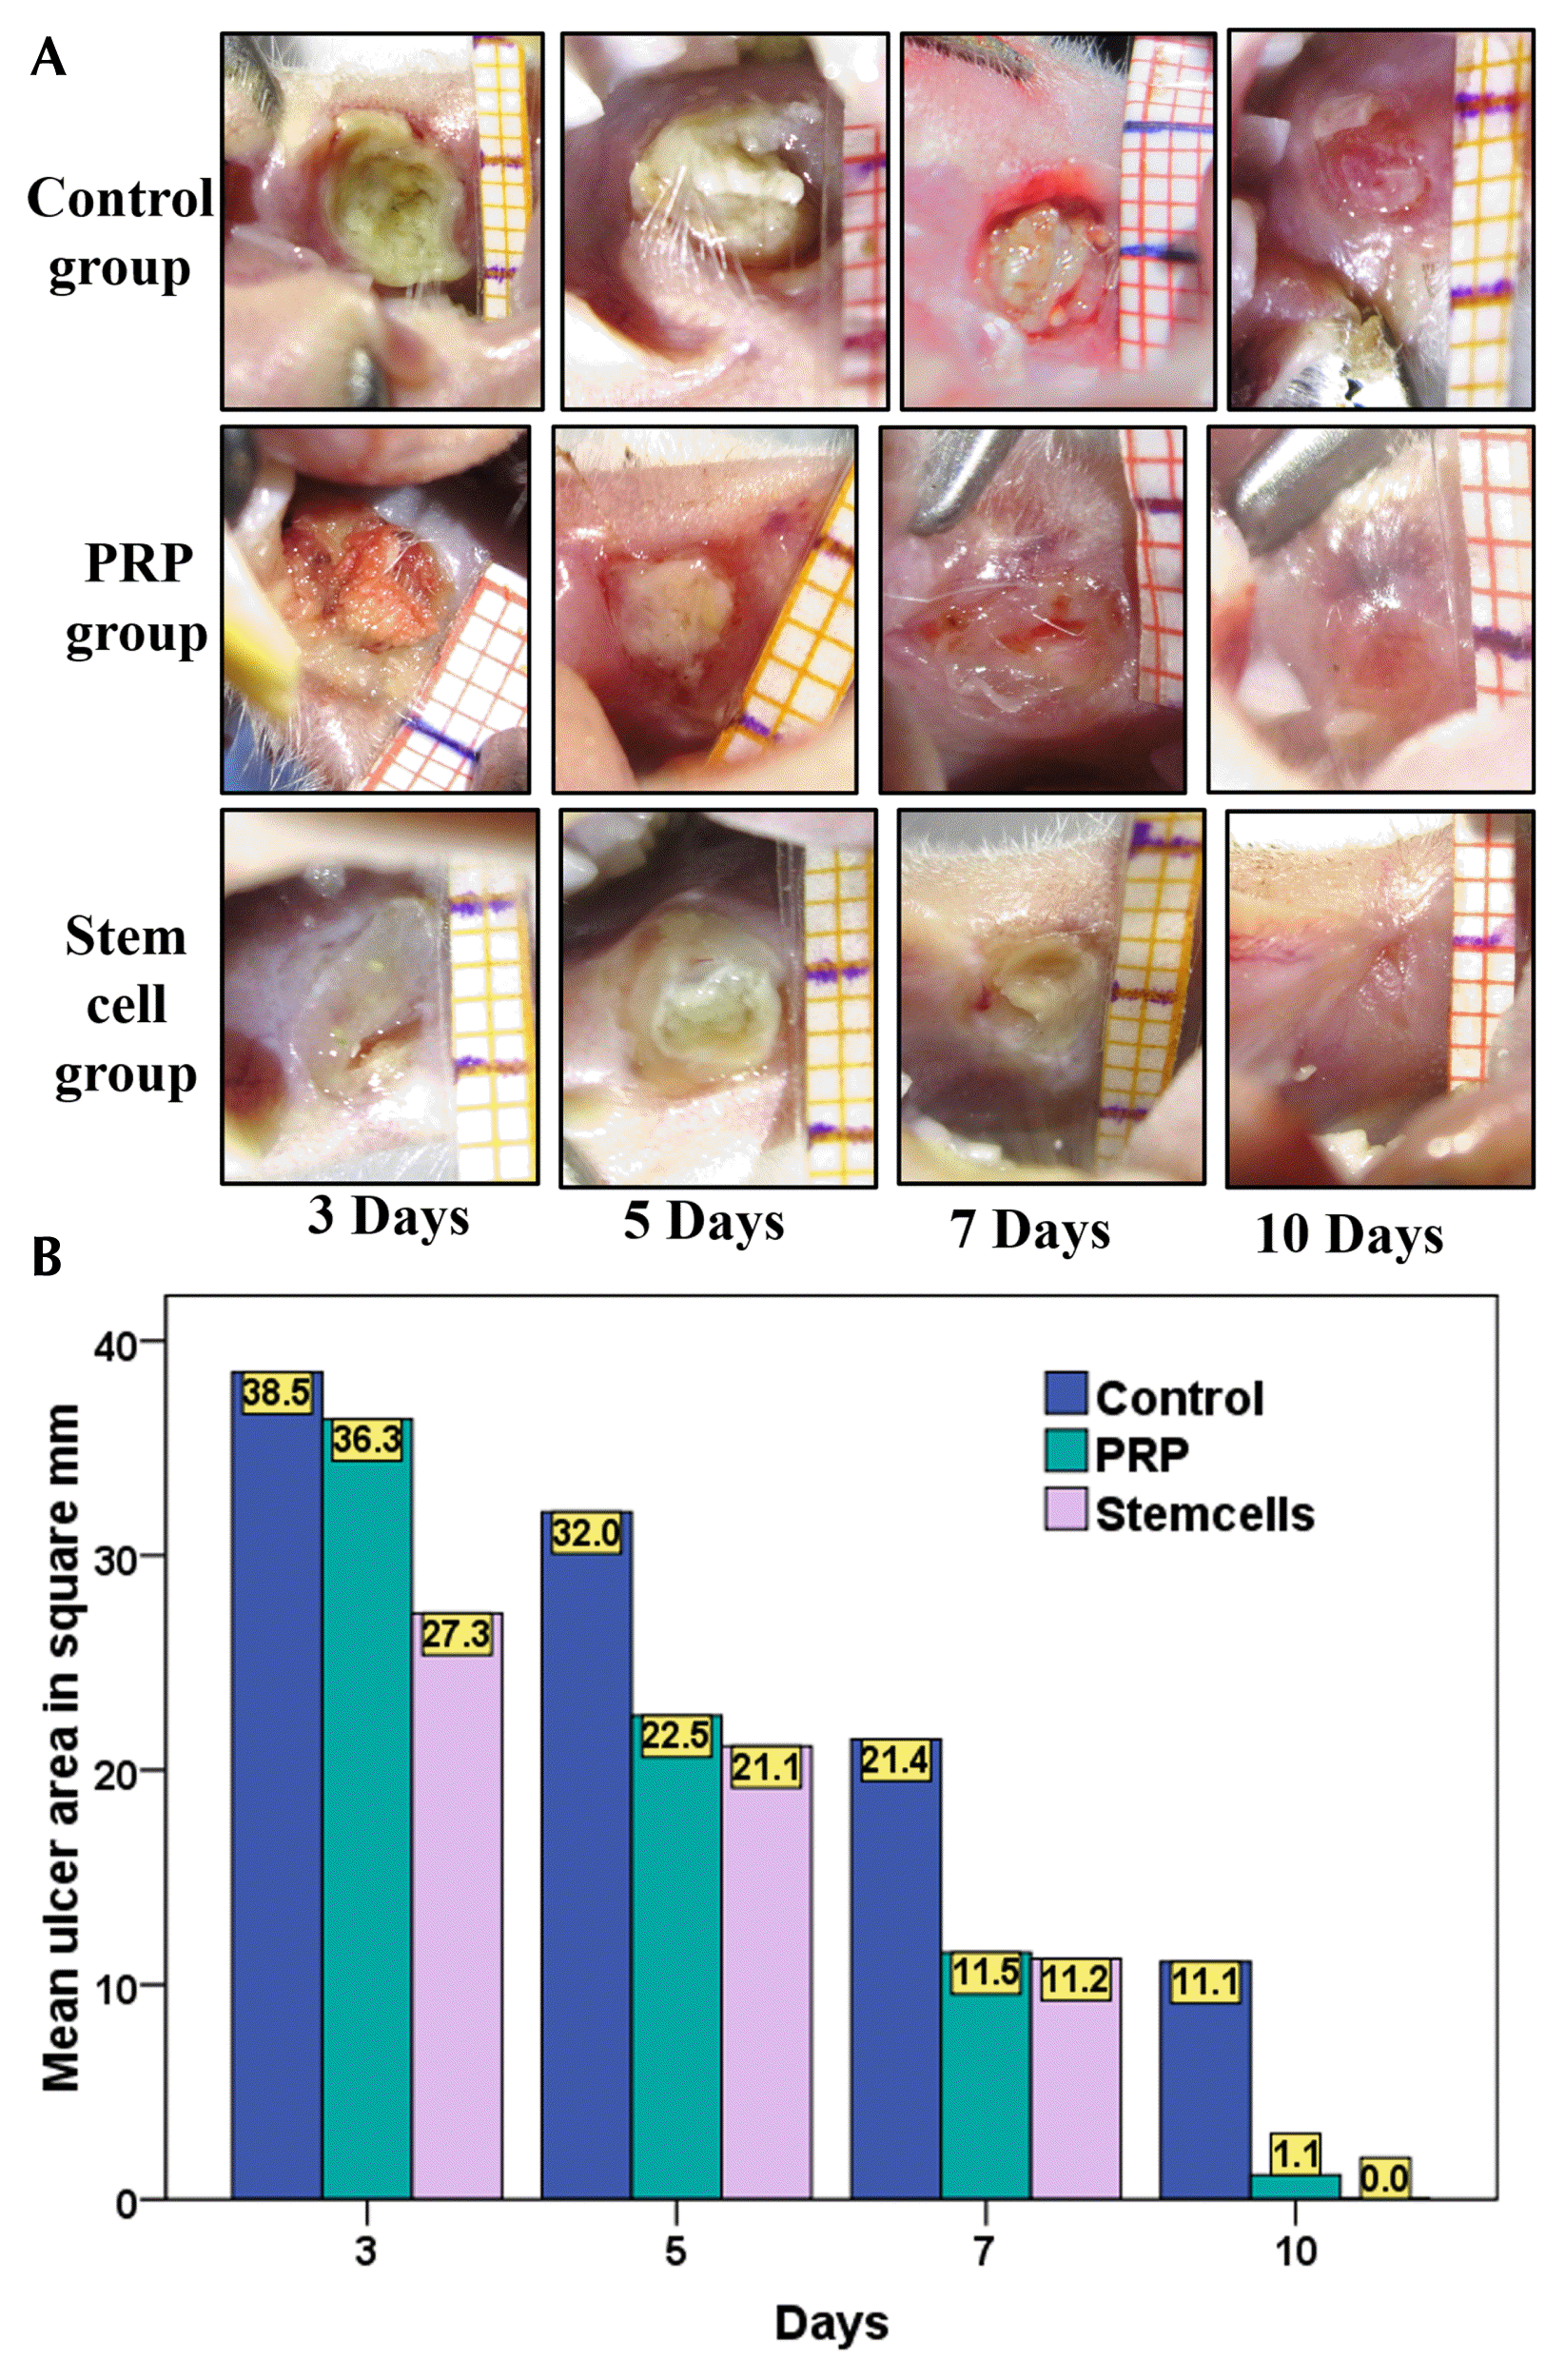
Clinical/macroscopic analysis
Table 1
| Mean ulcer area/mm2 | ||||||
|---|---|---|---|---|---|---|
|
|
||||||
| 0 days | 3 days | 5 days | 7 days | 10 days | ||
| Control | 25.01±0.0 | 38.52±4.22 (154%) | 32.01±2.80 (128%) | 21.43±3.25 (85%) | 11.06±5.79 (44.24) | |
| PRP | 25.01±0.0 | 36.33±2.96 (145%) | 22.54±6.41 (90%) | 11.50±5.69 (46%) | 1.14±0.71 (4%) | |
| BMSCs | 25.01±0.0 | 27.29±4.78 (109%) | 21.11±3.09 (84%) | 11.21±2.21 (44%) | 0.00±0.00 (0%) | |
| ANOVA | F | 0.16 | 10.72 | 8.98 | 10.59 | 15.58 |
| p-value | 0.85 | 0.002 | 0.004 | 0.002 | 0.00 | |
| Tukey HSD | (Control, PRP) | (Control, PRP)a | (Control, PRP)a | (Control, PRP)a | ||
| (Control, BMSCs)a | (Control, BMSCs)a | (Control, BMSCs)a | (Control, BMSCs)a | |||
| (PRP, Stem cells)a | (PRP, BMSCs) | (PRP, BMSCs) | (PRP, BMSCs) | |||
H&E histological results
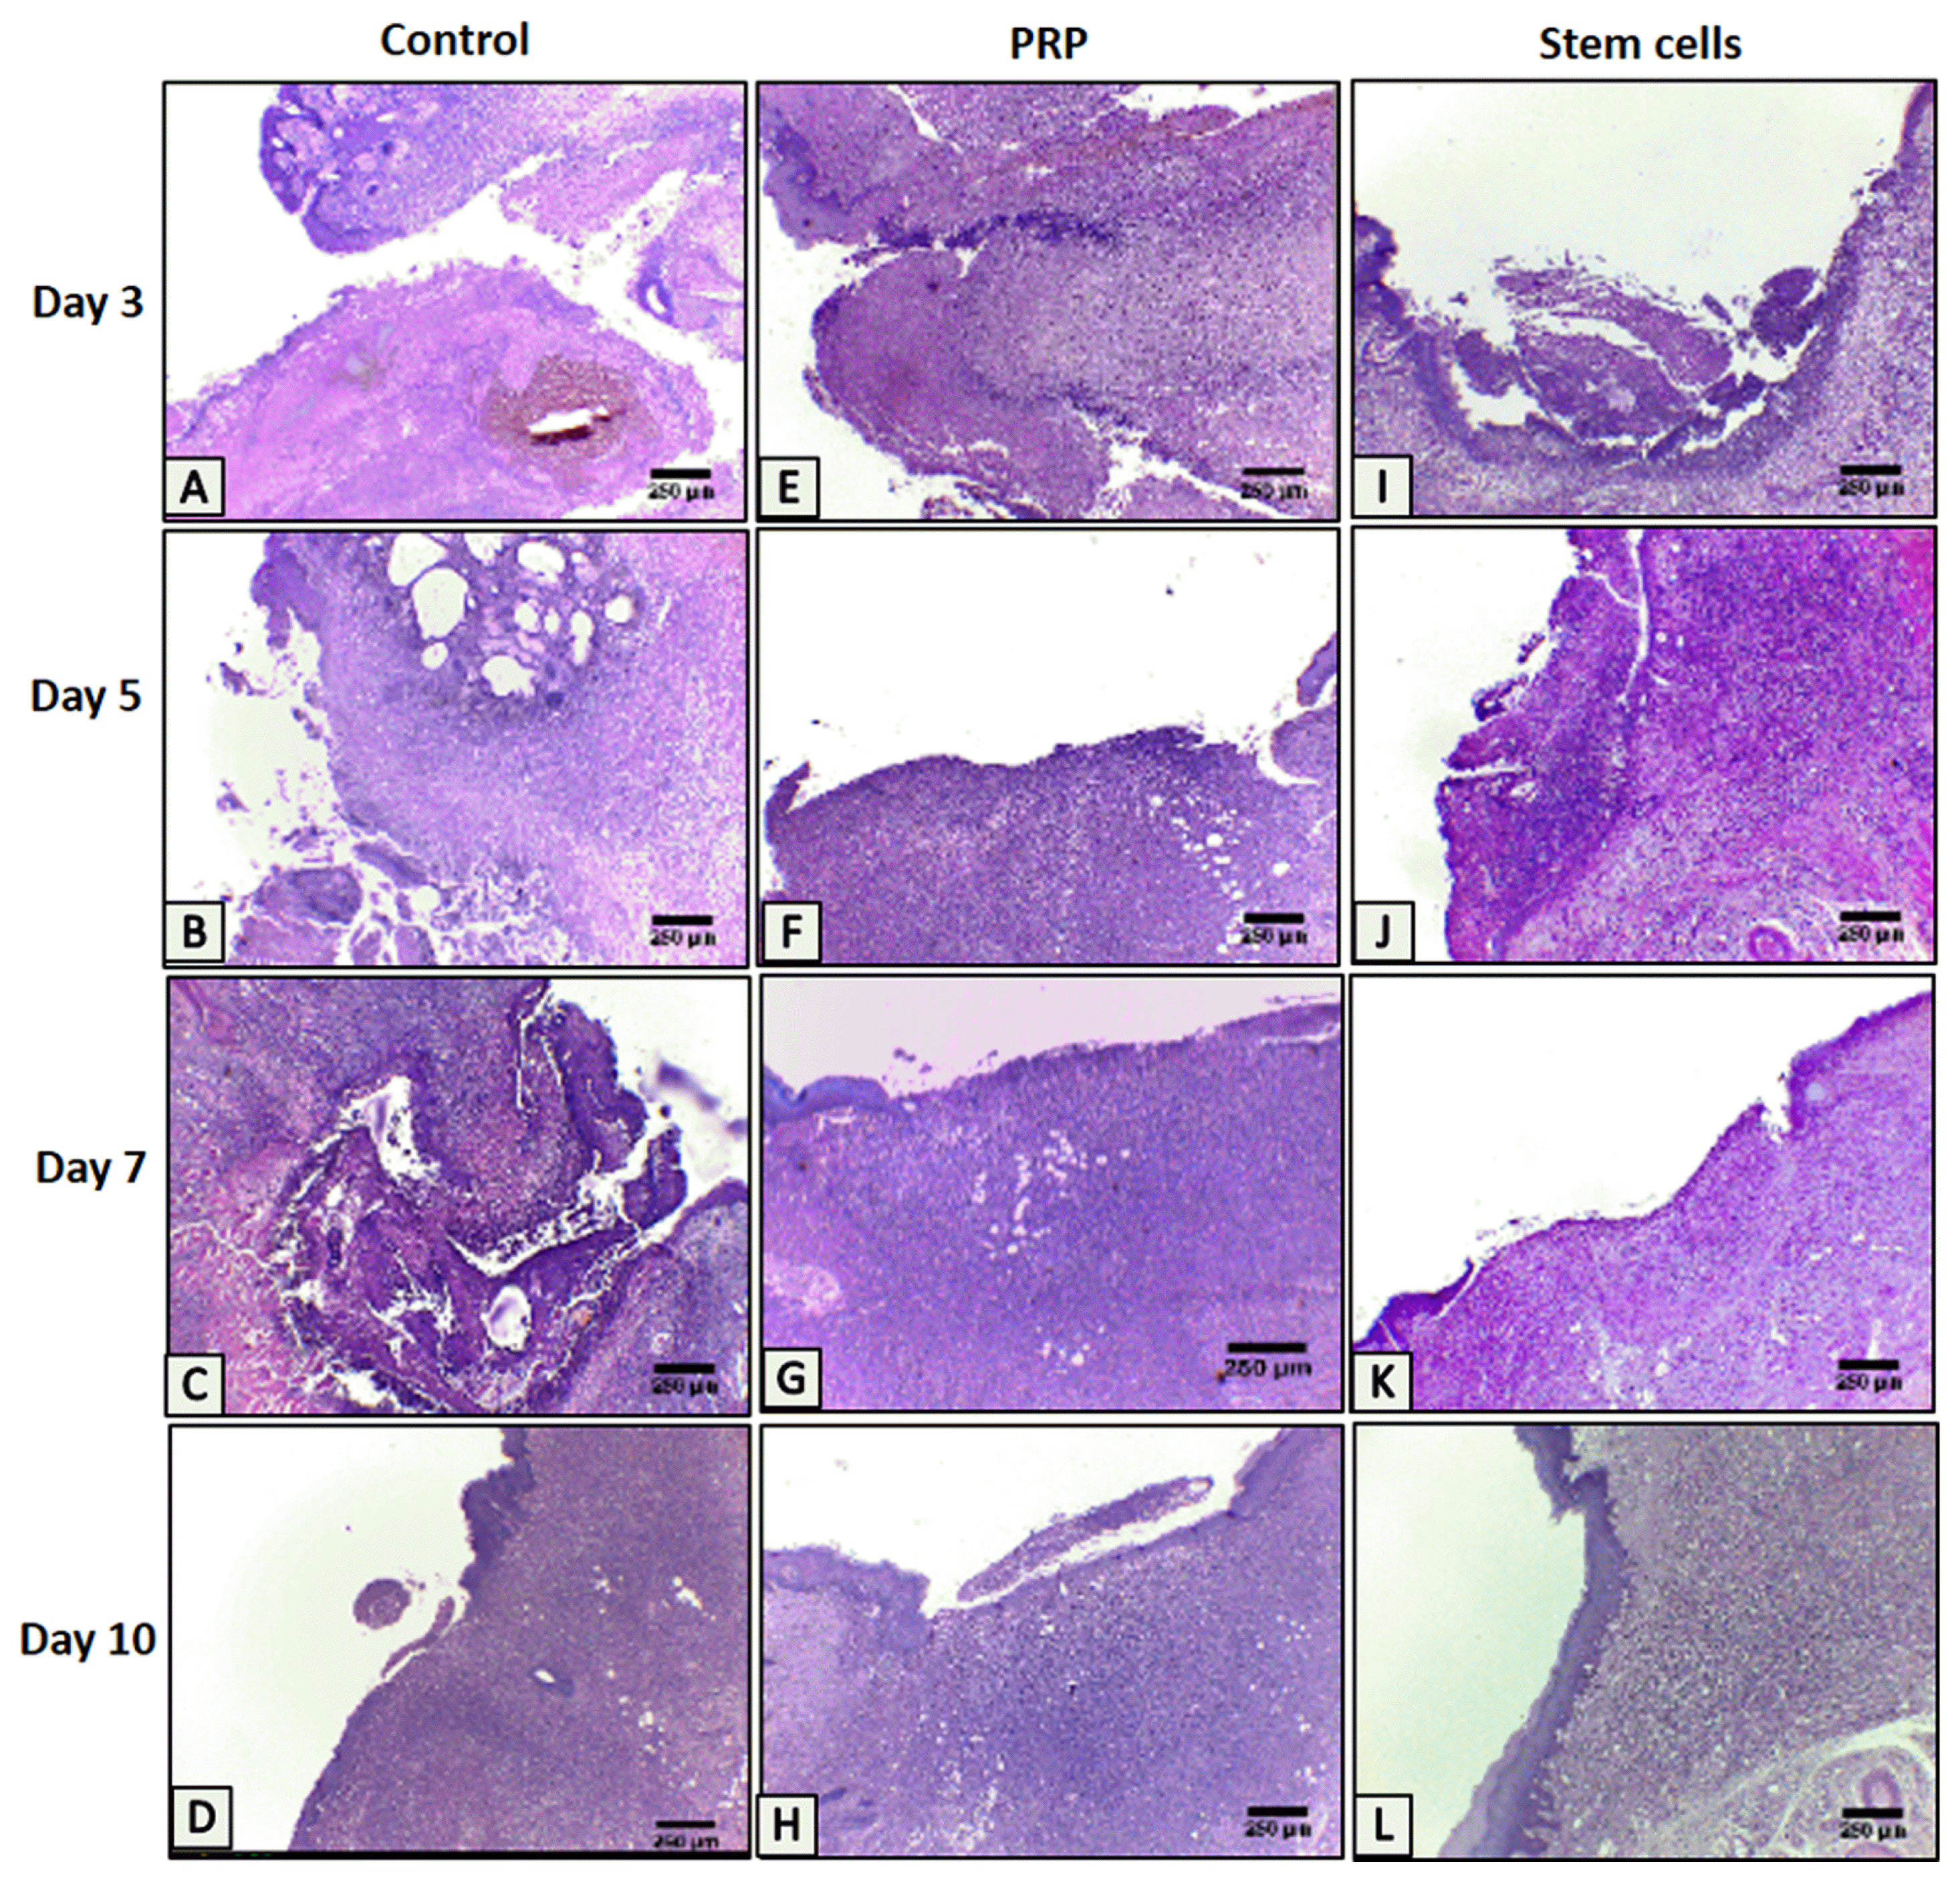
 | Fig. 3Representative histological images of ulcer healing in the control group (A~D), the PRP group (E~H) and the BMSCs group (I~L). Control group: Minimal epithelial migration above the dense granulation tissue on days 3 (A), 5 (B) and 7 (C). Persistence of a small ulcer area in epithelium with moderately inflamed underlying connective tissue on day 10 (D). PRP group: Deep epithelial cells migration at the wound margin above the dense granulation tissue on days 3 (E), 5 (F) and 7 (G). Complete wound closure on day 10 (H), the wound area is covered by thin layer of stratified squamous epithelium with thin keratin layer and flat rete ridges and the underlying connective still showing signs of moderate inflammation. BMSCs group: Epithelial proliferation and migration at the wound margin with moderate density of granulation tissue filling the wound core and has inflammatory cells infiltration on days 3 (I), 5 (J) and 7 (K). Full wound closure with complete re-epithelization on day 10 (L), the epithelium at the wound area showing maturation with moderate thickness of keratin layer and the underlying connective still showing signs of moderate inflammation. Haematoxylin-eosin staining; magnification, 40×. Scale bar=250 μm (PRP, Platelet rich plasma). |
Trichrome histological results
 | Fig. 4Representative histological images of ulcer healing in the control group (A~D), the PRP group (E~H) and the BMSCs group (I~L). Control group: Collagen fibres at the wound area are thin and distributed in haphazard manner surrounded by numerous inflammatory cells, small new blood vessels and extravasated red blood cells on days 3 (A) and 5 (B). Combination of fine and moderately coarse collagen fibres that are randomly distributed with moderate inflammatory cells infiltration in addition to numerous small blood vessels on days 7 (C) and day 10 (D). PRP group: The central granulation tissue consists of fine interlacing collagen fibres, numerous dilated blood vessels and extravasated red blood cells on days 3 (E) and 5 (F). The connective tissue exhibiting thick collagen fibres with variable number of fibroblasts and numerous blood vessels on days 7 (G) and 10 (H). BMSCs group: moderately arranged interlacing collagen fibres running somewhat parallel to the surface epithelium, neovascularization and discrete inflammatory infiltration on days 3 (I) and 5 (J). The connective tissue starting to regain its normal architecture with more organized collagen fibres, many fibroblasts, high vascularity and mild inflammatory cell infiltration on days 7 (K) and 10 (L). Trichrome staining; magnification, 100×. Scale bar=100 μm (PRP, Platelet rich plasma). |
Immunohistochemical results
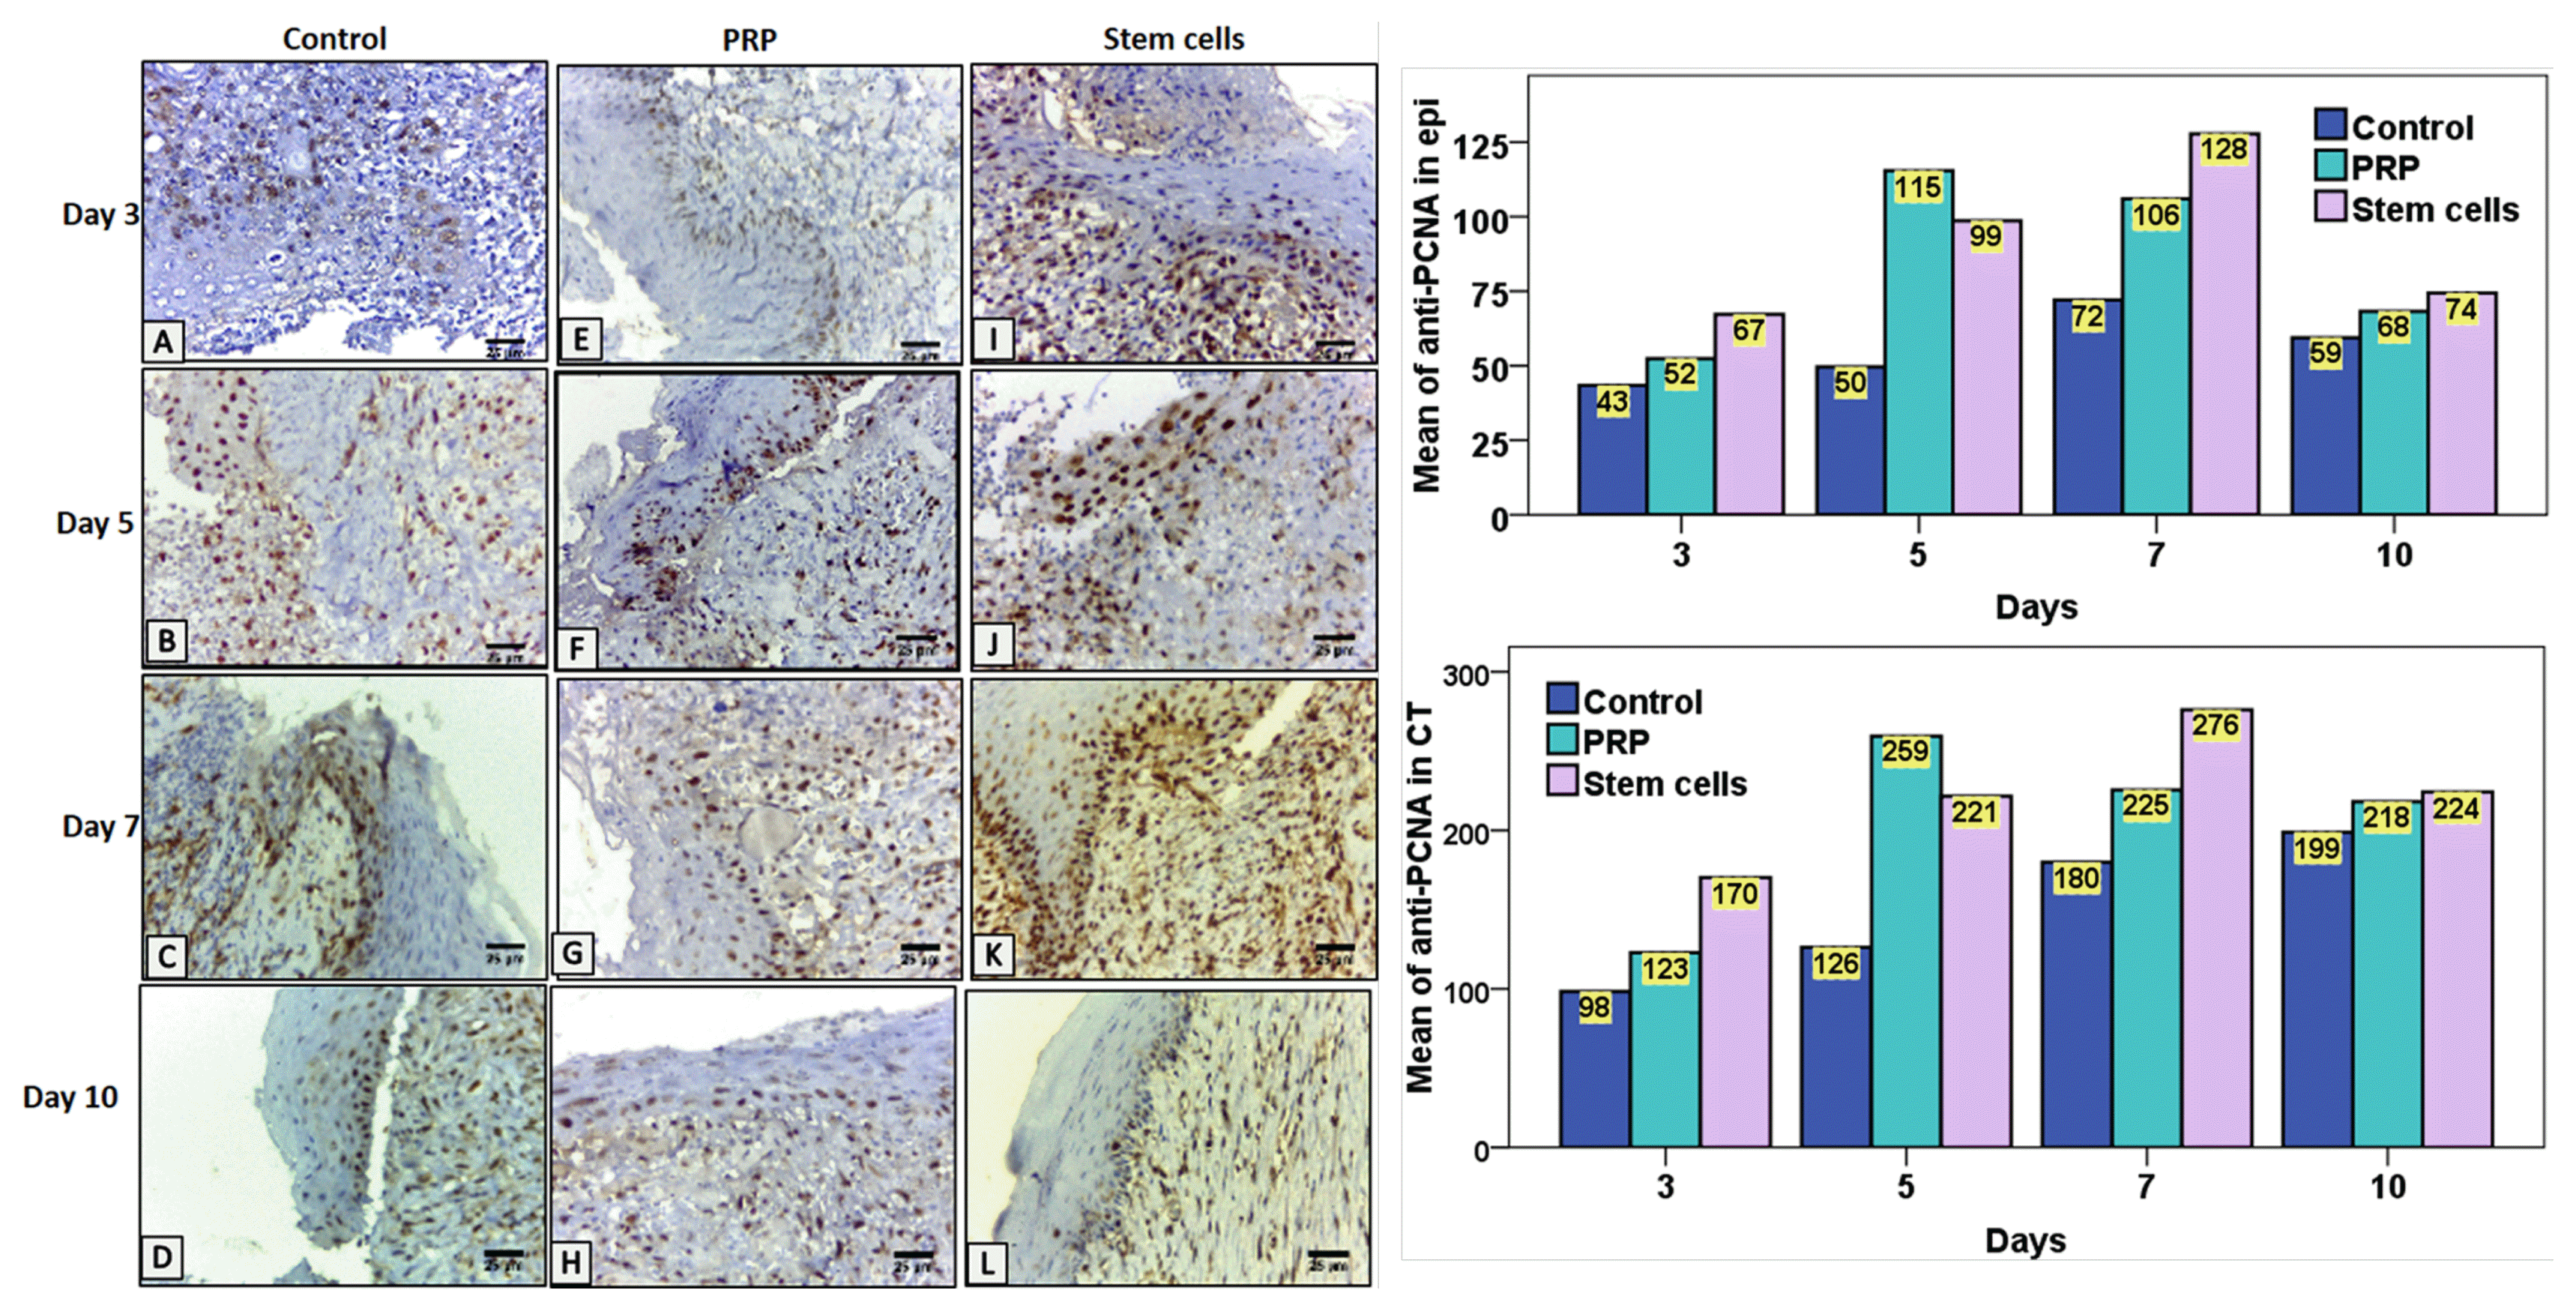
 | Fig. 5Left image, representative images of immunolocalization at wound area in the control group (A~D), the PRP group (E~H) and the BMSCs group (I~L). In the control group, relatively smaller number of nuclei showed immunoreactivity, in all the days compared to the PRP and BMSCs group. The BMSCs group showed a slightly higher number of positive nuclei than PRP group at the basal and suprabasal cells of epithelium and in some keratinocytes in migrating epithelium at ulcer surface. Similarly, the connective tissue cells, as well as endothelial cells lining the blood vessels of the BMSCs group, expressed a greater number of nuclear positive cells compared to the PRP and the control group. Anti-PCNA antibodies; magnification, 400×. Scale bar=25 μm (PRP, Platelet rich plasma). Right image, Column chart representing the mean of anti-PCNA antibodies positive nuclei in epithelial tissue (epi) in the control, PRP and stem cell groups in the different time intervals. Column chart representing the mean of anti-PCNA antibodies positive nuclei in connective tissue (CT) in the control, PRP and stem cell group in the different time intervals. |
Table 2
| Mean of anti-PCNA positive nuclei in epithelial tissue | |||||
|---|---|---|---|---|---|
|
|
|||||
| 3 days | 5 days | 7 days | 10 days | ||
| Control | 43.40±7.82 | 49.60±8.26 | 67.80±3.96 | 73.00±4.52 | |
| PRP | 52.40±8.79 | 115.40±15.12 | 106.00±11.06 | 75.40±5.17 | |
| BMSCs | 67.20±7.72 | 98.60±7.82 | 127.80±13.08 | 86.40±5.50 | |
| ANOVA | F | 10.92 | 48.91 | 44.71 | 9.86 |
| p-value | 0.002 | ≤0.001 | ≤0.001 | 0.003 | |
| Tukey HSD | (Control, PRP) | (Control, PRP)a | (Control, PRP)a | (Control, PRP) | |
| (Control, BMSCs)a | (Control, BMSCs)a | (Control, BMSCs)a | (Control, BMSCs)a | ||
| (PRP, BMSCs)a | (PRP, BMSCs)a | (PRP, BMSCs)a | (PRP, BMSCs)a | ||
Table 3
| Mean of anti-PCNA positive nuclei in connective tissue | |||||
|---|---|---|---|---|---|
|
|
|||||
| 3 days | 5 days | 7 days | 10 days | ||
| Control | 102.20±8.167 | 126.20±32.561 | 179.80±14.601 | 198.80±4.76 | |
| PRP | 122.80±14.37 | 259.40±26.26 | 225.40±13.44 | 218.00±5.00 | |
| BMSCs | 170.20±24.66 | 221.40±35.82 | 276.00±19.42 | 224.20±10.18 | |
| ANOVA | F | 20.68 | 23.28 | 45.02 | 17.37 |
| p-value | ≤0.001 | ≤0.001 | ≤0.001 | ≤0.001 | |
| Tukey HSD | (Control, PRP) | (Control, PRP)a | (Control, PRP)a | (Control, PRP)a | |
| (Control, BMSCs)a | (Control, BMSCs)a | (Control, BMSCs)a | (Control, BMSCs)a | ||
| (PRP, Stem cells)a | (PRP, Stem cells) | (PRP, BMSCs)a | (PRP, BMSCs) | ||


 PDF
PDF Citation
 Print
Print


 XML Download