

 PDF
PDF Citation
 Print
Print


Introduction
Type 2 diabetes mellitus (T2DM) is one of the commonest forms of chronic disease globally and few societies or ethnic groups are spared. The number of people with diabetes is expected to reach 642 million by 2040 (1). T2DM considered as a chronic disease causing macro- and microvascular complications, leading to severe illness and premature death, with elevated personal and economic costs (2). There are two mechanisms leading to T2DM; increase insulin resistance and/or decrease insulin secretion. Recently there are epidemiological, experimental and clinical evidences that the inflammatory and apoptotic mediators are involved in these two mechanisms of T2DM (3).
Pancreatic duodenal homeobox 1 considered as a transcription factor which plays a crucial role in pancreatic β cell function and survival, also it initiates endocrine neogenesis. The complete Pdx1 deficiency leads to pancreatic agenesis while its partial deficiency leads to sever dysfunction of β cell, increases β cell death and diabetes in both human and rodents. The two major features of T2DM are chronic hyperglycemia and dyslipidemia which caused by β cell dysfunction via reduced Pdx1 expression. Also, Pdx1 expression is absolutely necessary for integrating GLP-1 receptor-dependent signals for the differentiated function, growth and survival of islet β cells (4).
The hyperglycemia amelioration or improvement of insulin response in target tissue still the only ways in T2DM treatment. Moreover, the therapy compliance is usually low and most of patients maintain hyperglycemia which considered a major factor responsible for the onset of the chronic and severe diabetes complication (5). This raises the need for development a new strategies in prevention and treatment of T2DM.
Obestatin is an interesting but controversial gut hormone. It is a 23-amino acid peptide which encoded by the same gene that encodes ghrelin. This peptide has been named Obestatin due to its inhibitory effect on food intake. It has been originally extracted from rat stomach (6). Also obestatin-producing cells are found in the pancreas. Its expression in fetal, neonatal and adult pancreas plays a crucial role in pancreas development and homeostasis (7). In the obese mice, the blood concentration of obestatin is low indicating that obestatin may act in the pancreas through autocrine/paracrine mechanisms (8). Obestatin enhance the generation of functioning β cells/islet-like cell clusters in vitro, suggesting implications for cell-based replacement therapy in diabetes (9).
One of the most important type of multipotent adult stem cells are mesenchymal stem cells (MSCs), which are undifferentiated cells have self-renewal capacity, extensive culture expansion, low immunogenicity also their clinical utilization involves few ethical concerns (10). MSCs are capable of microenvironment modification of injured tissues contributing to tissue regeneration and repair through anti-inflammatory and anti-apoptotic mediators (11). Many researchers have demonstrated that MSCs transplantation decreased blood glucose levels and enhance the regeneration of pancreatic islet of diabetic animals (12). However, these results were still not enough to explain the therapeutic potentiality of MSCs in T2DM (11).
We assumed that obestatin may enhance stem cell therapy in T2DM. Nevertheless, no such study has been reported so far to our knowledge.
The aim of this study was to evaluate the therapeutic potential of MSCs and/or obestatin on endocrine pancreatic damage in type II diabetic rats. Additionally, we evaluated the possible involvement of Pdx1, GLP-1 pancreatic expression in the regeneration process, moreover to elucidate whether apoptosis may participate in their molecular mechanism or not.
Materials and Methods
Experimental animals
Sixty adult male Sprague Dawley rats each weighing between 180 and 200 gm were bred and maintained in an air-conditioned animal house with specific pathogen-free conditions. Rats were subjected to a normal light/dark cycle and allowed free access to chow and water. This study was carried out in strict accordance with the recommendations in the Guide for the Care and Use of Laboratory Animals of the National Institutes of Health (NIH publication No. 85–23, revised 1996). The protocol was approved by the Committee of the Ethics of Animal Experiments of the Faculty of Medicine, Benha University.
Group I (Control group)
n=20 rats were fed a regular chow diet for eight weeks consisted of a total kcal value of 20 kilo Joule (kJ)/kg (5% fat, 52% carbohydrate, 20% protein). The rats were divided equally into 4 subgroups each subgroup contained 5 rats as follow:
Subgroup IB
On the day 14th from the beginning of the experiment, the rats were injected i.p. with a single dose of 0.25 ml/kg body weight sodium citrate buffer (vehicle of STZ).
Subgroup IC
The rats were injected i.v. 0.2 ml normal saline through tail vein, first dose injection after a week and second dose after three weeks of STZ injection (vehicle of obestatin).
Subgroup ID
The rats were injected 0.25 ml/kg distilled water (vehicle of obestatin) subcutaneously twice daily in the last week before sacrifice.
Group III (T2DM+MSCs)
(n=10) diabetic rats treated with MSCs in two successive doses of (2×10⁶) MSCs suspended in 0.2 ml normal saline. MSCs were injected through tail vein; first dose after a week and second dose after three weeks of STZ injection (13).
Group IV (T2DM+obestatin)
(n=10) diabetic rats treated with obestatin at a dose of 100 μg/kg dissolved in 0.25 ml distilled water subcutaneously twice daily in the last week before sacrifice (14).
Induction of T2DM
T2DM was induced by administration of HFD for eight weeks with a total kcal value of 40 kJ/kg (20% fat, 45% carbohydrate, 22% protein) (15). On day 14, rats on the HFD were injected with intraperitoneal (i.p.) single low dose of STZ (30 mg/kg, dissolved in 0.25 ml/kg sodium citrate buffer at pH 4.4) (16). To avoid incidental puncture of the intestines, which would have decreased the success rate for induction of diabetes, all animals were fasted overnight (17). Because of streptozotocin’s ability to induce fatal hypoglycemia as a result of massive pancreatic insulin release, the rats were provided with 10% glucose solution after 6 hours of STZ administration for the next 48 hours to prevent hypoglycemia. After 5 days of STZ injection, blood glucose was tested using a blood glucose meter (Accu-Chek Performa; Roche Diagnostics, USA). Rats with glucose level above 160 mg/dl considered diabetics but below this value were excluded from the experiment. The total experimental period was eight weeks.
Experimental substances
Streptozotocin was purchased from Sigma-Aldrich Chemical Co. (St. Louis, Missouri, USA). The powder was stored at −20°C and the amount needed was dissolved in 0.1 mol/l citrate buffer, pH 4.5, immediately before use.
Obestatin was purchased from Sigma-Aldrich Chemical Co. (St. Louis, Missouri, USA). The powder was dissolved in distilled water before use.
Preparation of BM-MSCs
Bone marrow mesenchymal stem cells (BM-MSCs) were prepared in the Central lab, Faculty of Medicine, Benha University. Bone marrow cells were flushed from tibia and fibula of rat bones with phosphate-buffered saline (PBS) containing 2 ml EDTA. Over 15 ml Ficoll-Paque (Gibco-Invitrogen, Grand Island, NY), 35 ml of the diluted sample was carefully layered, centrifuged for 35 minutes at 400 ×g rpm and the upper layer was aspirated leaving undisturbed mononuclear cell (MNC) layer at the interphase. This MNC layer was aspirated, washed twice in PBS containing 2 ml EDTA and centrifuged for 10 minutes at 200 ×g rpm at 10°C. The cell pellet was re-suspended in a final volume of 300 μl of buffer. Isolated MSCs were cultured on 25 ml culture flasks in minimal essential medium (MEM) supplemented with 15% fetal bovine serum (FBS) and incubated for 2 hours at 37°C and 5% CO2. Adherent MSCs were cultured in MEM supplemented with 30% FBS, 0.5% penicillin, streptomycin and at 37°C in 5% CO2 in air (18, 19). All cultures were examined using an inverted microscope; Leica DM IL LED with camera Leica DFC295 (Leica Microsystems CMS GmbH, Ernst-Leitz-Straβe 17~37, Wetzlar, D-35578, Germany).
Identification of BM-MSCs
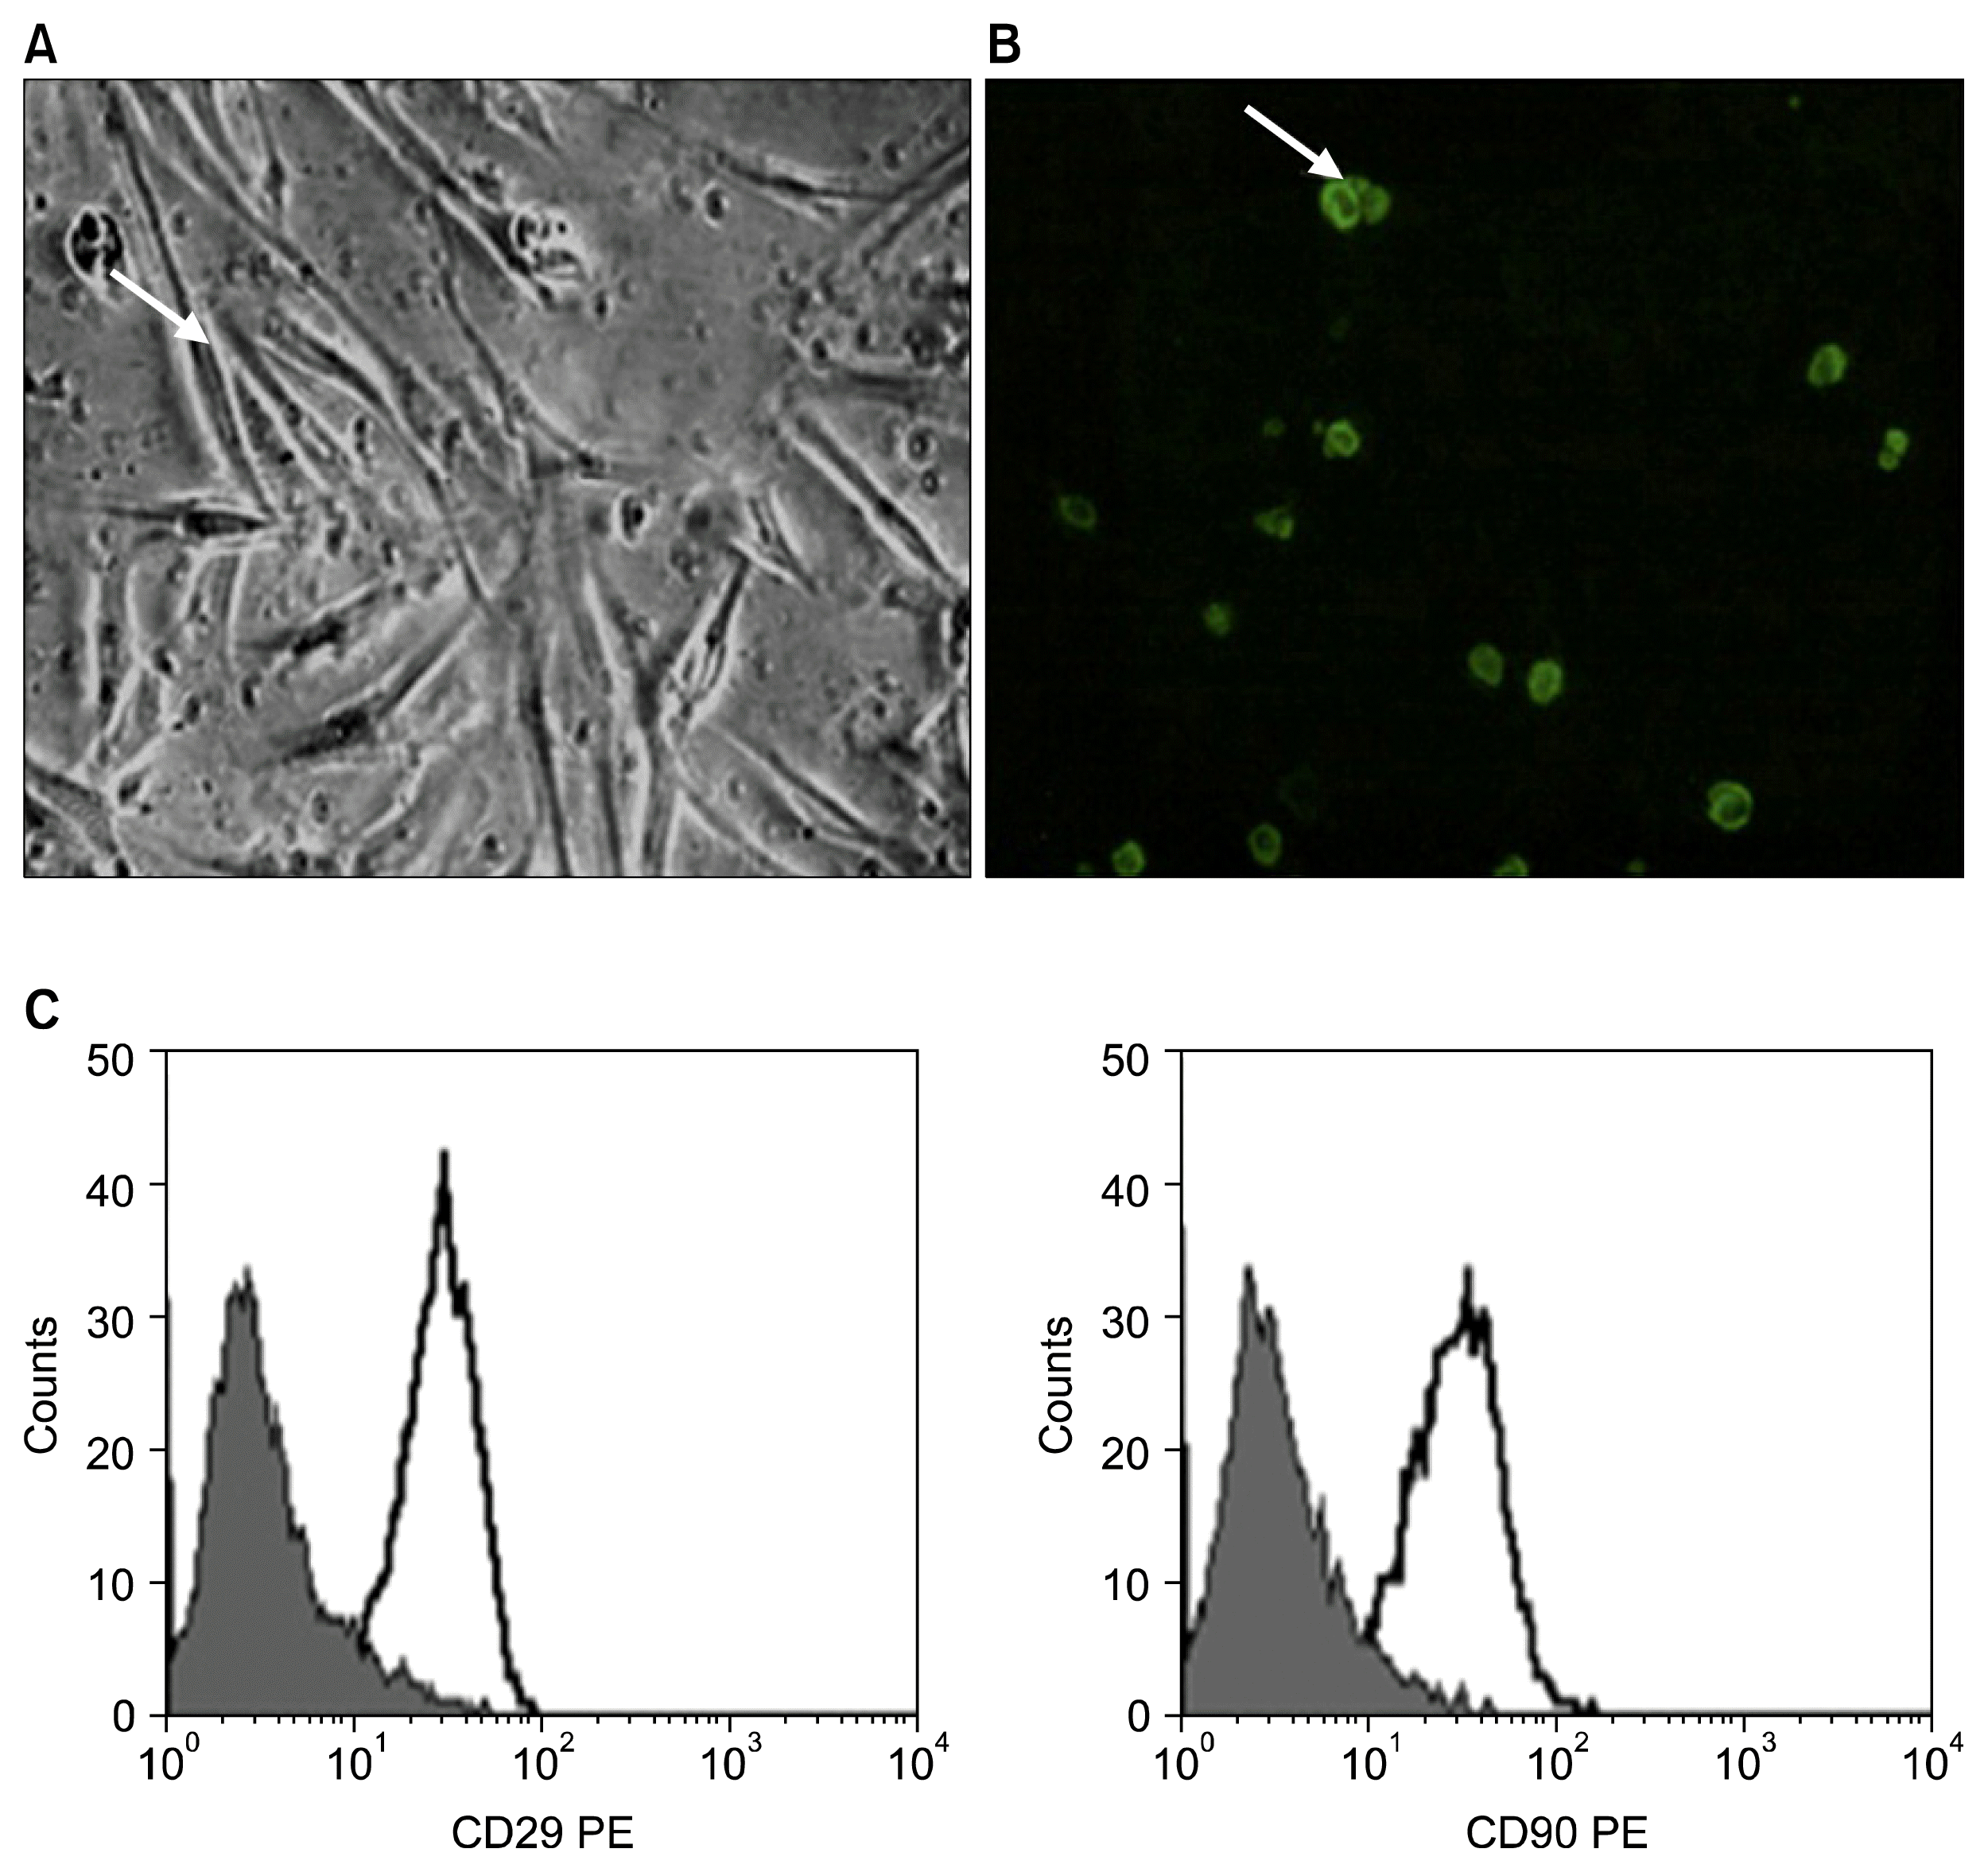
MSCs in culture were characterized by their adhesiveness and fusiform shape and by detection of CD29 and CD90 (surface markers of rat mesenchymal stem cell) by flow cytometry (18).
Green fluorescent protein (GFP) labeling of MSCs
MSCs were labeled in vitro with GFP (pAcGFP1-N1 Vector, Clontech Laboratories, Inc. (USA) catalog #632469) for in vivo tracing and observed in unstained pancreatic tissues cryosections using Fluorescence Microscope (Leica Microsystems CMS GmbH, Ernst-Leitz-Straße, Wetzlar, D-35578, Germany) (20).
Assessment of obesity
Body weights were recorded weekly during the experimental period, and before sacrifice of all groups. Body lengths were measured (nose-anal length). The body weight and body length were used to confirm the obesity through the obesity parameters body mass index (BMI) (body weight g/length cm) (21).
Procedure of the experiments
At the end of the eighth week, the animals were anesthetized by sodium thiopental anesthesia (40 mg/kg. i.p.) after 12 hours fasting. The animals were fixed on an operating table and the blood samples were taken.
Blood samples and tissue collection
A craniocaudally incision of about 2 cm is made, parallel and slightly to the left of the sternum through the skin and pectoral muscles to expose the ribs. A blunt curved forceps is then binged between the 5th and 6th ribs through the intercostal muscles. The gap is widened so that the beating heart becomes visible, then the blood samples were taken from the right ventricle. The previous incision was continued through the animal’s anterior abdominal wall, the abdominal cavity was entered by cutting the muscles and peritoneum. The pancreas was exposed then freed from the surrounding tissue. It was quickly excised and portions of pancreatic tissues were stored in −80°C for detection of insulin, GLP-1 and Pdx1 mRNA expression by quantitative reverse transcriptase - polymerase chain reaction (qRT-PCR). Other portions of pancreatic tissues were fixed in formalin 10% for histological and immunohistochemical examination.
Assessment of biochemical parameters
Fasting serum glucose was estimated by the glucose oxidase–peroxidase method (GOD–POD kit from Biodiagnostic, Egypt). Whereas fasting serum insulin level was carried out using an enzyme linked immunosorbent assay kit (ELISA, Boehriger Mannheim Immunodiagnostics, and Mannheim, Germany). Serum C-peptide was measured with rat insulin enzyme-linked immune absorbent assay kit (C-Peptide EIA Kit, Sigma-Aldrich, St. Louis, MO).Serum total cholesterol (TC), triglyceride (TG) and high density lipoprotein cholesterol (HDL-C) were evaluated using kits from Biodiagnostic, Egypt. Low density lipoprotein cholesterol (LDL-C) was calculated from the equation LDL-C=TC–HDL-C–TG/5 (22).
Calculating the homeostasis model assessment as a measure of insulin resistance (HOMA-IR)
by using the following equation; [HOMA-IR=insulin (μU/ml)×glucose (mmol/L)/22.5] (23).
Calculating the homeostasis model assessment as a measure of β cell function (HOMA-β)
according to the following equation; [HOMA-β=20×insulin (μU/ml)/(glucose - 3.5)] (24).
Histological study
After sacrifice, pancreatic tail of the whole pancreas was rapidly removed and cleared of fat. Pancreas were fixed in 10% buffered formalin solution, dehydrated in ascending grades of ethanol and embedded in paraffin. Serial sections (4 μm) of two different levels were mounted for haematoxylin and eosin (H&E) (25) and immunohistochemistry.
Immunohistochemically study
The immunohistochemically staining was applied for CD105 expression in pancreatic tissue treated with MSCs. The CD105 marker was rabbit polyclonal antibody (bs-0579R) (Bioss Inc.).
Immunohistochemical staining was applied for detection of Bax. The primary monoclonal antibody used was rabbit monoclonal (E63) antibody to Bax (Lab Vision Corp, Neo-markers, Inc /Lab Vision, Fremont, California, USA). The positive reaction was brown color in the cytoplasm.
Immunohistochemical localization of insulin was assessed by polyclonal antibodies; cat. no. AR. 295-R; Bio Genex mouse monoclonal anti-insulin antibody supplied by Lab Vision Co., (Fremont, California USA) was used to identify the (β cells).
Immunohistochemical reactions were carried out using the peroxidase-labeled streptavidin biotin method (26). Paraffin sections were mounted on positive charged slides. They were deparaffinized in xylene, rehydrated in descending grades of ethyl alcohol, and then immersed in 0.3% hydrogen peroxide in methyl alcohol to block endogenous peroxidase activity. The sections were washed in PBS and 10% normal rabbit serum was applied for 30 minutes to reduce nonspecific binding. The sections were incubated for 1 hour with antisera-containing primary antibodies. After that, the sections were counterstained with Mayer’s haematoxylin (H), dehydrated in ascending grades of ethyl alcohol, cleared in xylene, and mounted in Canada balsam.
Real time PCR
The relative abundances of the mRNA species were assessed by the SYBR® Green method and an ABI Prism 7500 Sequence Detector System (Applied Biosystems, Foster City, CA, USA). The PCR primers used were designed with Gene Runner Software (Hastings Software Inc., Hastings, NY, USA) from RNA sequences in GenBank (Table 1). All of the primer sets had a calculated annealing temperature of 60°C. Quantitative RT-PCR analyses were performed in duplicate in a 25-μL reaction volume consisting of 2× SYBR Green PCR Master Mix (Applied Biosystems, USA), 900 nM of each primer, and 2~3 μL of cDNA. The amplification conditions were 2 min at 50°C, 10 min at 95°C, and 40 cycles of denaturation at 95°C for 15 s and annealing/extension at 60°C for 10 min. Data from the qRT-PCR assays were calculated by Sequence Detection Software version 1.7 (PE Biosystems, Foster City, CA, USA). The relative expression levels of insulin, Pdx1, and GLP-1 were calculated by the comparative Ct method as stated by the manufacturer recommendations (Applied Biosystems, USA). All values were normalized to the expression of the GAPDH gene and reported as the fold changes.
Statistical analysis
All the data collected from the experiment was recorded and analyzed using SPSS Statistics software for Windows, Version 20 (IBM Corp., Armonk, NY, USA). Evaluation of differences between groups was performed using one-way ANOVA with post hoc test (LSD). In each test, all the data are presented as mean±standard deviation (SD) and differences were considered to be significant at p<0.05.
Results
MSCs identification in culture and tracking
The MSCs were identified after 2 weeks in culture with an inverted microscope as spindle-shaped cells between rounded cells (Fig. 1A) and intravenously injected MSCs labeled with GFP were observed in pancreatic tail tissue using a fluorescent microscope (Fig. 1B). By immunohistochemistry, we found that CD105+ cells locate at the surrounding periphery of normal islets but penetrate into the β-cell (Fig. 1C). Analysis of cell surface molecules was performed on mesenchymal stem cells preparations to assess purity, positivity for CD29 and positivity for CD90 mesenchymal markers (Fig. 2).
Effects of MSCs and obestatin on body weight, BMI, serum glucose, insulin, C peptide, HOMA-IR and HOMA-β in T2DM rats
There were non-significant differences between all subgroups of the control group. Body weight, BMI, serum glucose and HOMA-IR increased significantly (p<0.05), while insulin, C peptide and HOMA-β decreased significantly (p<0.05) in group II (T2DM) as compared to the control group. Treatment with MSCs (group III) caused significant decrease (p<0.05) in serum glucose and HOMA-IR with a significant increase (p<0.05) in se rum insulin, C peptide and HOMA- β when compared to the group II. In the contrary it caused non-significant effect on body weight and BMI. On the other hand treatment with obestatin (group IV) caused significant decrease (p<0.05) in body weights, BMI, serum glucose and HOMA-IR with significant increase (p<0.05) in insulin, C peptide and HOMA- β when compared to the group II. Furthermore combination of MSCs and obestatin (group V) reached the control level in all parameters. Additionally there was a significant decrease (p<0.05) in body weight, BMI, serum glucose, and HOMA-IR with a significant increase (p<0.05) in HOMA- β in group IV (T2DM+obestatin) when compared to group III (T2DM +MSCs) (Table 2).
Effects of MSCs and obestatin on lipid profile inT2DM rats
Regarding the lipid profile, administration of HFD and STZ (group II) caused a significant increase (p<0.05) in TC, TG and LDL with a significant decrease (p<0.05) in HDL when compared to the control group. While treatment with either MSCs or obestatin caused a significant decrease (p<0.05) in serum TC, TG and LDL with a significant increase (p<0.05) in HDL when compared to the T2DM group. On the other hand their combination (group V) led to lipid profile reached to a level near to that of the control level. Additionally there was a significant decrease (p<0.05) in TC, TG and LDL in group IV (T2DM+obestatin) when compared to group III (T2DM+MSCs) group indicating that obestatin has more protective effect than MSCs (Table 3).
Effects of MSCs and obestatin on insulin, Pdx1 and GLP-1 Gene expression in pancreas of T2DM rats
Table 4 showed that Insulin mRNA, Pdx1 mRNA and GLP-1 mRNA expression were significantly (p<0.05) decreased in T2DM group as compared to control group, while treatment with MSCs or obestatin showed significant increase (p<0.05) in Insulin, Pdx1 and GLP-1 mRNA expression when compared to T2DM group. Combination therapy of MSCs and obestatin showed non-significant difference when compared to the control group. As well as there was non-significant difference in all parameters by comparing T2DM+MSCs group to T2DM+obestatin group.
Histological results
Haematoxylin and eosin stain
Group I (control group): There was no histological difference in subgroup IA, IB, IC and ID. The control group showed normal histological structure of the tail of pancreas which divided into many small lobules of variable sizes and shapes. Each lobule was formed of closely packed pancreatic acini and a compound duct system in which pancreatic acini were lined with pyramidal cells with basal basophilia, apical acidophilia with basal rounded nuclei and narrow lumen. The islets of Langerhans appeared as noncapsulated pale pink oval or rounded areas formed of groups of cells arranged in irregular branching and anastomosing cords. Also, the Islet of Langerhans had large pale cells with pale nuclei in the center. Also small dark cells with small nuclei in the periphery were seen Fig. 3A, B. Group II (T2DM) showed disorganized pancreatic acini and the acinar cells had vacuolation of their cytoplasm with darkly stained nuclei. The islets of Langerhans appeared distorted with wide intercellular spaces compared to control group. The cells have vacuolated pale acidophilic cytoplasm and darkly stained nuclei Fig. 3C. Group III (T2DM+MSCs) showed that, the pancreatic acini were organized rounded with apparently normal shaped central cells and narrow intercellular spaces compared to control group. Many dilated blood vessels in the islet were observed in Fig. 3D. Group IV (T2DM+obestatin): disorganized pancreatic acini and darkly stained nuclei. The islet of Langerhans contained wide intercellular spaces, some cells had vacuolated pale cytoplasm, and few centrally located cells had small darkly stained nuclei as shown in Fig. 3E. Group V (T2DM+MSCs+obestatin) showed the histological picture of this group was more or less similar to that of the control group without any pathological changes as shown in Fig. 3F.
Immunohistochemical results
GFP expression
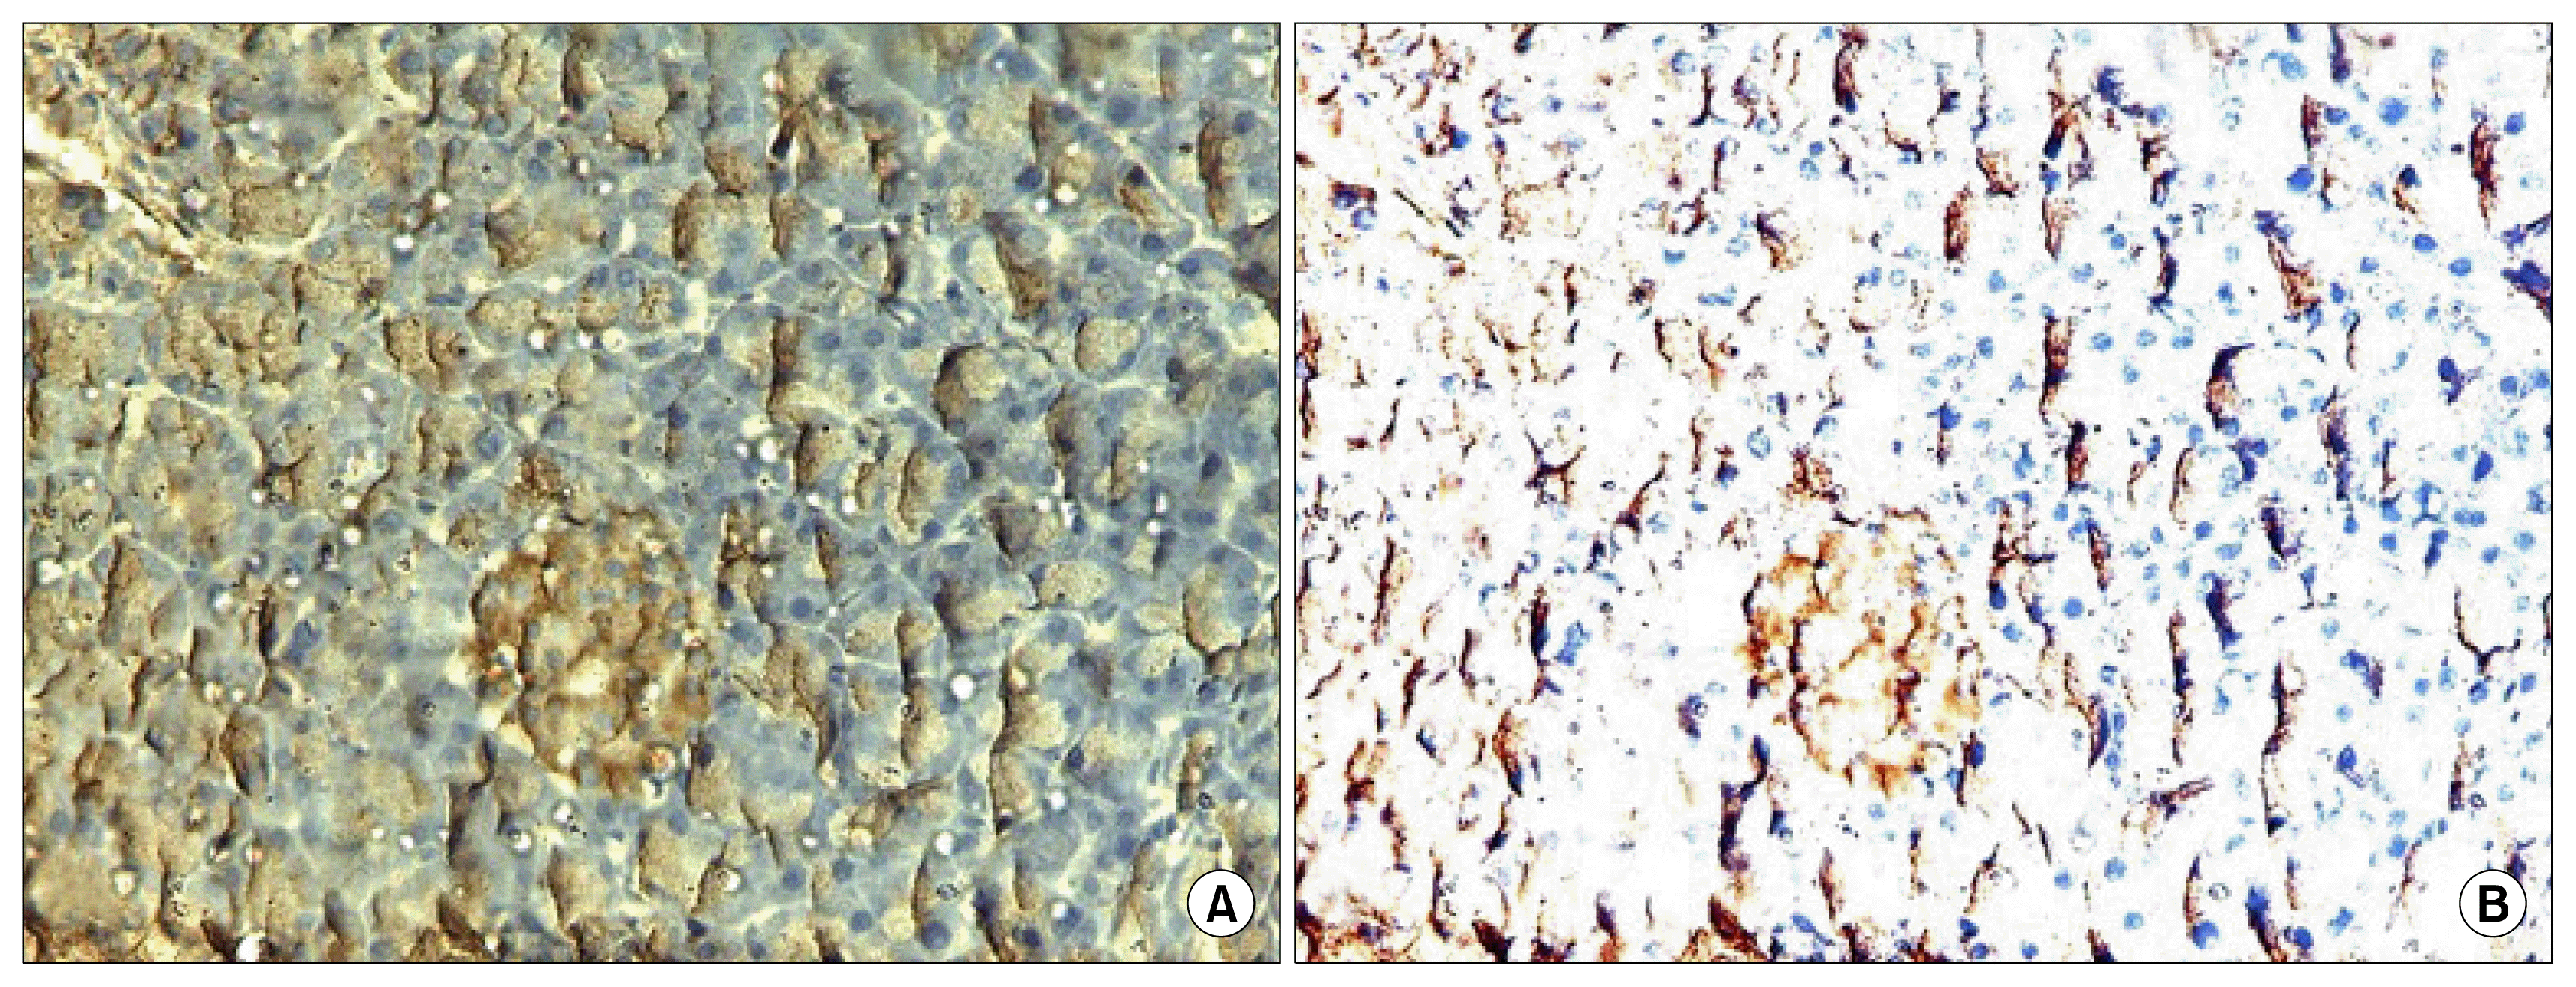
Immunohistochemical GFP expression was analyzed in pancreatic tissue to demonstrate cell viability because proper cell engraftment is very important for any transplantation study (Fig. 4A). Staining of transplanted MSCs was confirmed by estimation of CD105 antigen in pancreatic tissue of groups treated with MSCs (Fig. 4B). The brown color was present in cytoplasm.
Insulin immunostaining
Pancreatic sections of rats in group I showed strong positively stained secretory granules of the β cells constituting the major population of the islets Fig. 4A, while pancreatic sections of rats in group II showed a decrease in the positively stained secretory granules of the β cells Fig. 4B. However, pancreatic sections of rats in group III showed relative increase in positively stained secretory granules of β cells compared with the group II Fig. 4C. Also, relative increase in positively stained secretory granules of β cells was seen in pancreatic sections of rats in group IV compared with the group II Fig. 4D. Furthermore a highly positive stained secretory granule of β cells was seen in pancreatic sections of rats in group V compared with the group II Fig. 4E.
Bax immunostaining
Pancreatic sections of rats in group I showed negative Bax immunostaining in the islets of Langerhans Fig. 5A, while group II showed highly expressed positive Bax immunostaining in the islets of langerhans indicating increasing rate of cellular apoptosis Fig. 5B. Pancreatic sections of rats ingroup III showed weak positive Bax immunostaining in the islets of Langerhans Fig. 5C. Also, pancreatic sections of rats in group IV showed weak positive Bax immunostaining in the islets of Langerhans Fig. 5D. Finally pancreatic sections of rats ingroup V showed minimally expressed Bax immunostaining in the islets of Langerhans Fig. 5E.
Morphometric results
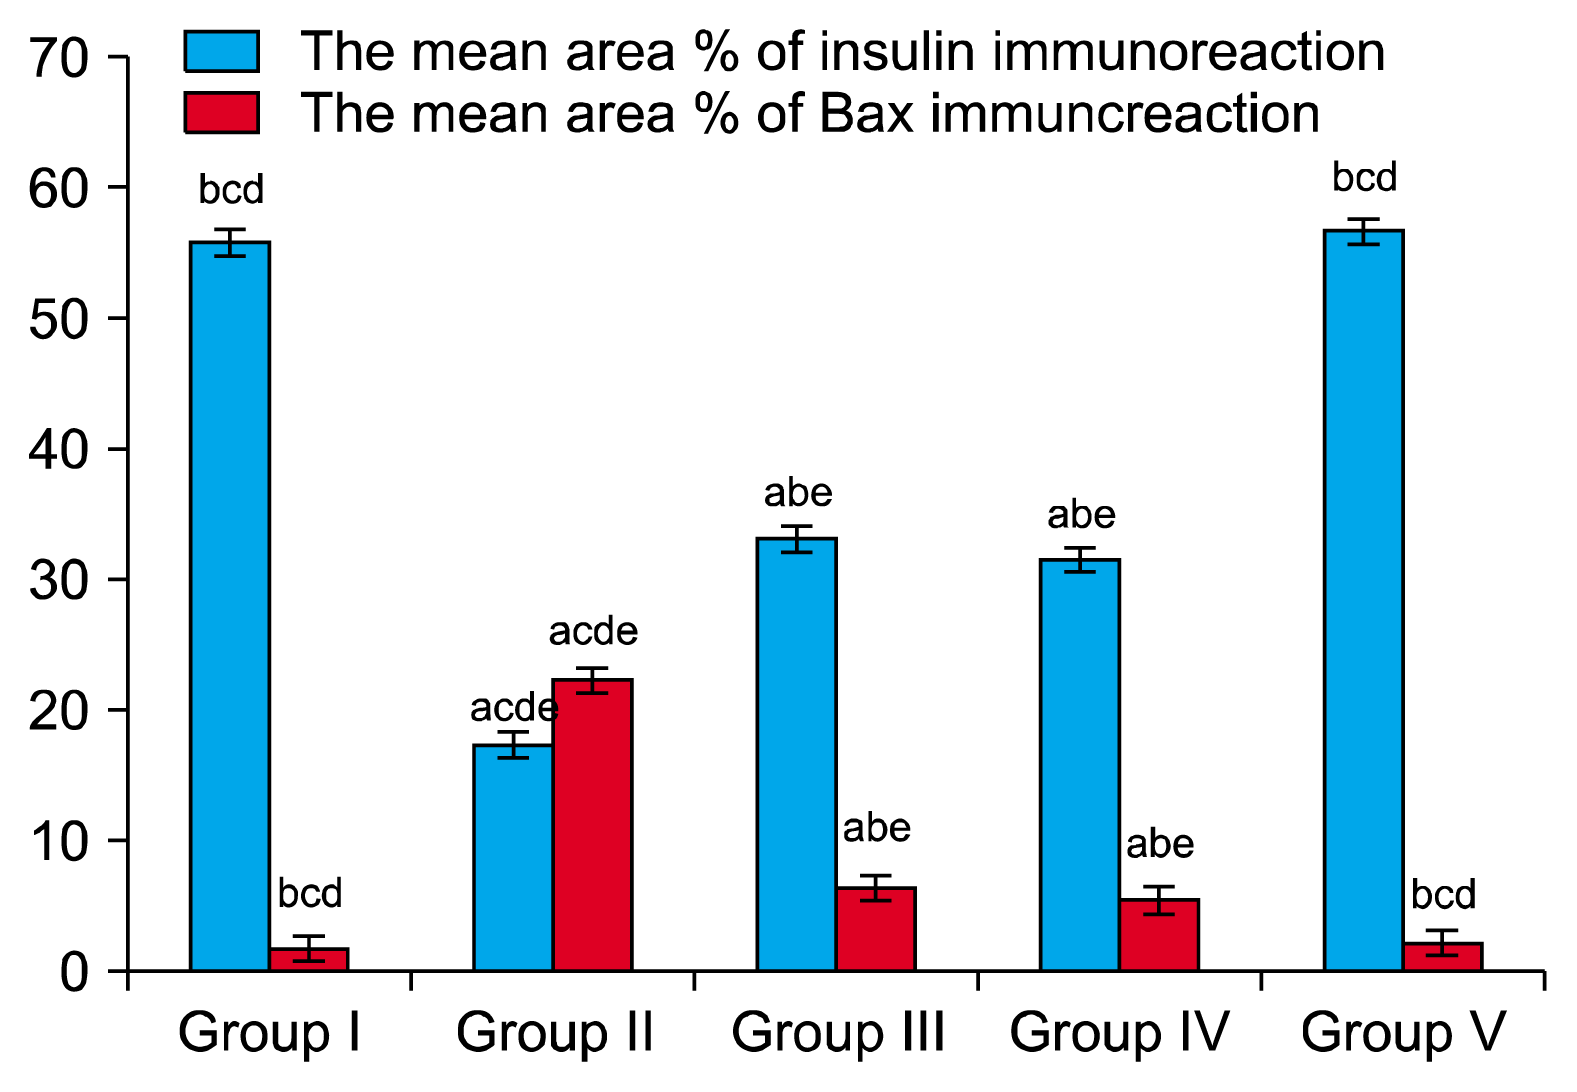
The mean area percentages of insulin immunostaining for all groups were represented in (Table 5) and (Fig. 6). There was significant decrease in mean area percentage of insulin immunostaining in group II compared to the group I (p<0.05), while treatment with either MSCs (group III) or obestatin (group V) caused significant increase in the mean area percentage of insulin immunostaining when compared to group II (p<0.05). Furthermore group V showed non-significant difference when compared to the control group.
The mean area percentages of Bax immunostaining for all groups were represented in (Table 5) and (Fig. 6). There was significant increase in group II compared to the control group (p<0.05), while group III and group IV showed significant decrease in the mean area percentages of Bax immunostaining when compared to group II (p<0.05). Furthermore group V showed non-significant difference when compared to the control group.
Discussion
The usage of medications for treatment of diabetes is associated with many risks such as hypoglycaemia, weight gain or gastrointestinal intolerance. Moreover, these therapeutic agents lose their efficacy over time, resulting in a loss of glycaemic control. This can be explained by the fact that usual medications fail to address the progressive loss of β cell mass and function (27). For these reasons, there is a need for new therapeutic approaches for the treatment of diabetes.
In the current study administration of HFD for 8 weeks and STZ injection led to significant increase in BMI, serum glucose and insulin resistance indicated by increase in HOMA- IR with significant decrease in insulin and β cell function indicated by decrease in HOMA- β. Also the Present study showed decrease in serum level of C peptide in diabetic rats. Serum C-peptide level is a true indicator of any change in the insulin level because it is co-secreted with insulin by the pancreatic cells as a by-product of the enzymatic cleavage of proinsulin to insulin (14). Furthermore, immunohistochemistry showed decrease in insulin staining intensity and reverse transcriptase PCR showed significant decrease in insulin mRNA level in pancreatic tissues. Also, there were vacuolated cytoplasm and some pycnotic nuclei revealed in H&E stained sections and increase of Bax reaction (an indicator for apoptosis) in islets of Langerhans.
These findings are consistent with other studies (16, 28, 29) showing that HFD combined with STZ administration induced progressive β cell dysfunction in T2DM rats. Many studies have shown multiple pathways and mechanisms to be involved in β cell damage in T2DM. These include; increased glucosamine pathway activity, increased oxidative stress (30), accelerated glucolipotoxicity, increased endoplasmic reticulum stress (31), glycation stress (29), activation of inflammatory pathways and toxic accumulation of islet amyloid polypeptide and the end result is β cell de-differentiation and death by apoptosis (32).
Also in agreement with this study, Song et al. (33) stated that pancreatic tissues after STZ administration showed degenerative histological changes and islet shrinkage, as well as weak insulin-reactivity in B cells. They reported that STZ destroys islet cells through several mechanisms, including the production of reactive oxygen species, activation of pancreatic nuclear factor-κB, and induction of immune responses and inflammatory.
The present study revealed that glucose, insulin resistance, serum insulin, C-peptide, β cell function and expression of insulin mRNA were improved by repeated infusion of MSCs as they significantly suppressed pancreatic islet damage. These results were in agreement with Mansor et al. (16) who showed that MSCs possess tissue repair and/or cytoprotective properties possibly due to their preferential homing property to injured pancreatic tissues with significant islet reconstruction. Additionally MSCs treatment significantly improved insulin sensitivity. These findings demonstrate that MSCs can decrease hyperglycemia by modulating the insulin sensitivity of peripheral target tissues. Also MSCs infusion could restore the concentration of total glucose transporter 4 (GLUT4) and promote GLUT4 translocation to the cell membrane, thus facilitating glucose utilization and decreasing insulin resistance (34).
The ameliorative effect of MSCs was also confirmed by the amelioration in histological structure by H&E stain, the increase of immunoreactivity for insulin and decrease of Bax reaction in islets of Langerhans of animals in group III.
On the other hand administration of obestatin showed significant decrease in BMI, serum glucose, and insulin resistance with significant increase in serum insulin, C-peptide, β cell function and expression of insulin mRNA in pancreatic tissues. The ameliorative effect of obestatin was also confirmed by the amelioration in histological structure by H&E stain, the increase of immunoreactivity for insulin and decrease of Bax reaction in islets of Langerhans of animals in group IV.
These results are in accordance with Granata et al. (8) who showed that obestatin reduces insulin resistance and β cell damage in mice fed a high fat diet and reported that the signaling pathways involved in these effects included cyclic adenosine monophosphate (cAMP) increase, phosphorylation of survival and proliferative pathways such as phosphatidylinositol 3-kinase, and extracellular signal-related kinase.
Another mechanisms explained by Baragli et al. (35) who showed that obestatin may promote in vitro βcell generation from mouse pancreatic islet-derived precursor cells. Treatment of cultured islets of Langerhans with obestatin enriched cells expressing the mesenchymal/neuronal marker nestin, which is associated with pancreatic precursors, increased cell survival and reduced apoptosis during precursor selection and promoted the generation of islet-like cell clusters.
Regarding the abnormally high concentration of serum lipids in diabetic rats, al-Shamaony et al. (36) reported that insulin resistance will enhance the generation of cholesterol. The increase in serum LDL-C level may result from non-enzymatic glycosylation of LDL-C and may result in decreased LDL clearance. In the present study, treatment of diabetic rats with MSCs normalized lipid profile pattern. This result was in agreement with that of Ahmed et al. (37) who explained the improvement of lipid profile by MSCs caused by improving β cell function and decreasing insulin resistance.
On the other hand administration of obestatin in the current study led to significant improvement in lipid profile and this result explained by Agnew et al. (38) who showed that obestatin induces the phosphorylation of AMP-activated protein kinase in adipocytes, whose activation is associated with inhibition of lipolysis. Also they reported that obestatin infusion was found to decrease the expression levels of ATP-binding cassette A1, a key cholesterol transporter. Granata et al. (8) addressed another explanation for reduction of TG and TC which may be attributed to influences of obestatin on intestinal TG absorption. Furthermore, obestatin could be included in the neuroendocrine regulation of food intake and energy homeostasis by stimulation of fatty acid uptake and prevent its release and lipolysis.
Moreover the current study showed significant decrease in BMI in diabetic rats treated with obestatin when compared to the diabetic non treated group. This result runs parallel to that of Smitka et al. (39) who showed that BMI reduced in obestatin-treated obese rats and explained that by its anorexigenic effect and by reduction of food intake. Moreover, obestatin may lead to sustained suppression of gastric emptying activity and may cause inhibition of jejunal contraction, which may trigger an afferent vagal signal to stimulate central satiety center. By comparing the effect of obestatin and MSC treatment there was superior protective effect concerning body weights, BMI, serum glucose, TC, TG, LDL, HOMA-IR and HOMA-β to obestatin. This protective effect may be due to the anorexigenic effect of obestatin and reduction of food intake.
The data obtained from this study showed significant reduction in GLP1 receptor expression in pancreatic tissue of diabetic group when compared to the control group. This result is in accordance with Xu et al. (40) who demonstrated that insulin is a GLP-1 secretagogue, while insulin resistance in the intestinal L cell reduces basal and stimulated GLP-1 release. Stimulation of insulin secretion by the GLP-1 has been found to be diminished in T2DM. We hypothesized that this impairment is due to a defect at the receptor level induced by the diabetic state, particularly hyperglycemia. In hyperglycemic rats gene expression of GLP-1 receptor was significantly decreased in islets of langerhans and could recover when glucose levels were normalized. Holz (41) explained that hyperglycemia acts through the protein kinase C (PKC) pathway to desensitize the GLP-1 receptor. As PKC phosphorylates the GLP-1 receptor with a resultant rapidly diminished signaling.
Injection of MSCs in rats having T2DM showed significant increase in expression of GLP-1 mRNA when compared to the diabetic rats. To the best of our knowledge it is the first study examine the effect of MSCs injection on expression of GLP-1 receptor in pancreatic tissue of T2DM model. We suggest that the protective effect of stem cell may be mediated by increasing the expression of GLP-1 mRNA, as GLP-1 acts as a growth factor for the β cell both in experimental animal models and cultured β cells by stimulating proliferation, survival and differentiation. GLP-1 promotes DNA synthesis, activates phosphatidylinositol 3-kinase and increases transcription factor pancreatic and Pdx1 DNA binding activity in β cells. Therefore, GLP-1 addresses the deterioration of β cell function in the etiology of type 2 diabetes (42).
Moreover administration of obestatin showed significant increase in the pancreatic expression of GLP-1 receptor when compared to the diabetic non treated group. These results go parallel to that of Agnew et al. (38) who showed that in human islets, obestatin promoted the expression and phosphorylation of insulin receptor substrate 2 mRNA, which is implicated in GLP-1 receptor signaling and activated cAMP response element-binding protein, a main regulator of glucose homeostasis and β cell survival.
By studying the effect of T2DM on pancreatic expression of Pdx1 gene, there was significant decrease in Pdx1gene expression when compared to the control group. In line with our data, Butler et al. (43) showed that chronic hyperglycemia and dyslipidemia, which are major features of type 2 diabetes, cause β cell dysfunction via reduced Pdx1 expression that causes apoptotic β cells. Also Yang et al. (44) suggested that hyperglycemia may be a factor behind increased DNA methylation of Pdx1 that decreases gene expression of Pdx1.
To the best of our knowledge it is the first study examine the effect of MSCs injection on expression of Pdx1 gene in pancreatic tissue of T2DM model. Injection of MSCs to diabetic rats showed significant increase in Pdx1 gene expression when compared to non-treated diabetic rats. While Vishwakarma et al. (45) demonstrated significant elevation of Pdx1 gene with the use of MSCs in type 1 diabetes mellitus in rats and showed that Pdx1 is a master switch gene that controls gene expression cascade of all other transcription factors responsible for endocrine neogenesis.
On the other hand, administration of obestatin significantly increased Pdx1 gene expression in pancreatic tissue when compared to diabetic non treated group. These results explained by Granata and Ghigo (46) who showed that obestatin upregulated Pdx1 genes that play a key role in β cell survival, differentiation, and glucose-induced insulin secretion.
The author’s attention was also focused on the role of apoptosis in the development of T2DM. Immunohistochemical results of group II (T2DM) showed highly expressed positive Bax immunostaining in the islet of Langerhans indicating increase in the rate of cellular apoptosis, while treatment with either obestatin (group III) or MSCs (group IV) revealed significant decrease in Bax immunostaining. Finally combination of MSCs and obestatin (group V) showed minimally expressed Bax immunostaining in the islet of Langerhans. In diabetes, Granata et al. (8) showed that the pancreatic cells not only undergo apoptosis but also become necrotic and are unable to secrete insulin.
Another study conducted by Bansal et al. (47) revealed that increased apoptosis rather than decreased neogenesis/proliferation might be the main mechanism leading to reduced β cell mass in T2DM. In case of treatment with MSCs Wassef et al. (48) showed balance in the expression of anti- and pro-apoptotic proteins by MSCs treatment, leading to increased cell survival. Regarding the effect of obestatin Granata et al. (8) reported that obestatin inhibits apoptosis of pancreatic β cells and human islets, and up-regulates genes essential for β cell survival and endocrine differentiation.
We have also considered the consequences of combined administration of MSC and obestatin on all parameters and the results showed significant improvement of all parameters reaching to nearly the control level as there was non-significant difference when compared to the control group. Suggesting that administration of obestatin may help improving the in vivo β cell regeneration induced by MSCs, as Bonner-Weir et al. (49) investigated that obestatin enhances in vitro generation of functional islet-like cell clusters from islet- derived mesenchymal- like cells. They explained that by (i) increasing the expression of the mesenchymal/neuronal marker nestin, which is associated with pancreatic precursors; (ii) increaseing cell survival and reduceing apoptosis during precursor selection; (iii) promoting the generation of islet-like cell clusters with increased insulin gene expression and C-peptide secretion. Furthermore, obestatin modulated the expression of fibroblast growth factor receptors, Notch receptors and neurogenin 3 during endocrine differentiation. And so they suggested implications of obestatin in cell replacement therapy and highlighted its importance as therapeutic candidate in diabetes treatment.
Conclusion
The results of this study proved that MSCs injection could partially reconstructs islet function and effectively ameliorates hyperglycemia and hyperlipidemia in experimental model of T2DM and more protective effect was reached when combined with obestatin. This protective effect is mediated through increasing the pancreatic expression of GLP-1 and Pdx1 genes and by decreasing apoptosis.


 XML Download