Journal List > Int J Stem Cells > v.9(1) > 1158961

Legzdina, Romanauska, Nikulshin, Kozlovska, and Berzins: Characterization of Senescence of Culture-expanded Human Adipose-derived Mesenchymal Stem Cells

Abstract

Background and Objectives

Adipose-derived mesenchymal stem cells (ADSCs) are promising candidates in regenerative medicine. The need for in vitro propagation to obtain therapeutic quantities of the cells imposes a risk of impaired functionality due to cellular senescence. The aim of the study was to analyze in vitro senescence of previously cryopreserved human ADSCs subjected to serial passages in cell culture.

Methods and Results

ADSC cultures from 8 donors were cultivated until proliferation arrest was reached. A gradual decline of ADSC fitness was observed by altered cell morphology, loss of proliferative, clonogenic and differentiation abilities and increased β-galactosidase expression all of which occurred in a donor-specific manner. Relative telomere length (RTL) analysis revealed that only three tested cultures encountered replicative senescence. The presence of two ADSC subsets with significantly different RTL and cell size was discovered. The heterogeneity of ADSC cultures was supported by the intermittent nature of aging seen in tested samples.

Conclusions

We conclude that the onset of in vitro senescence of ADSCs is a strongly donor-specific process which is complicated by the intricate dynamics of cell subsets present in ADSC population. This complexity needs to be carefully considered when elaborating protocols for personalized cellular therapy.

Introduction

Multipotent stem cells (MSCs) were isolated from adipose tissue for the first time by Zuk and colleagues in 2001 (1). Although MSCs can be found in a variety of tissues fat holds several advantages over others. The frequency of stem cells in fat is 500-fold higher compared to bone marrow (BM), a “golden standard” of adult stem cells (2). Evidence suggests superior proliferative activity of ADSCs over BM stem cells (3). In addition, the procedure of fat collection is relatively easy to perform and less burdensome for donor.
Senescence is metabolically active and stable state of cells both in vitro and in vivo characterized by irreversible cell proliferation arrest and dramatic changes in cell morphology, metabolism, gene expression and secretory phenotype (4).
In 1961, it was discovered that human fibroblasts possessed a limited proliferative capacity in culture, a phenomenon known as replicative senescence (5). DNA of telomeres, terminal structures of chromosomes, shortens during each S phase of cell cycle due to inability of DNA polymerase to complete the replication of lagging DNA strand. Hence, telomere shortening acts as a mitotic clock which determines replicative senescence (6).
Premature senescence, on the other hand, is caused by factors other than critically short telomeres. Among them are the lack of nutrients and cell-to-cell contacts (7), UV radiation (8), reactive oxygen species (9), chemotherapy (10), altered chromatin structure (11), and oncogenes (12).
A variety of biomarkers is studied to characterize MSC senescence. Among them, the most popular ones are associated with morphological and proliferative changes (13), increased expression of senescence-associated β-galactosidase (SA-β-gal) (14), the loss of MSC trilineage differentiation potential (15), cell cycle arrest (16), epigenetic modifications (17), oxidative stress (18), telomere shortening and DNA damage (19), activation of tumor suppressors p53, RB1 and p16INK4 (17, 20, 21). In addition, formation of senescence-associated heterochromatic foci (22) and promyelocytic leukemia protein bodies (23), as well as altered microRNA expression profile (24) have been observed.
A plenitude of clinical data gathered both from animal and human studies suggest broad clinical applicability of MSCs (25, 26). However, a single treatment protocol may require as many as 10~400 million cells to attain clinical significance. Therefore, pre-transplantation cultivation of MSCs is a prerequisite. For this reason, it is essential to study MSC in vitro senescence especially given the lack of standardised MSC expansion protocols among laboratories.
The aim of this work was to analyze in vitro senescence of human culture-expanded ADSCs. Previously frozen and long-term cryopreserved ADSC cultures from 8 donors were cultivated until proliferation arrest was reached. Cell senescence was characterized with respect to cell morphology, proliferative abilities, potential of adipo- and osteogenesis, SA-β-gal expression, metabolic activity, accumulation of intracellular peroxide, transcriptional activity (monitoring of 25 gene expression by reverse transcription polymerase chain reaction (RT-PCR)), as well as relative telomere length.

Materials and Methods

Cell source

ADSC cultures from eight donors were used in the study (Table 1). All cell cultures were retrieved from a cell bank where they were stored at passage 2 (P2) (except for cells from donor CS-5 which were stored at P3). ADSCs were isolated from human subcutaneous adipose tissue in accordance with The Latvian Central Medical Ethics Committee (permit No.12) after informed consent. Primary ADSCs cultures were cultivated in 5% autologous serum in hypoxic conditions (5% O2) and prepared for storage (5×10⁶ cells per ml) as described elsewhere (27).

Cell culture

After thawing, cells were counted in Bürker chamber and seeded on 75 cm2 tissue culture flasks (~2×10⁵ cells per flask) in DMEM/F12 medium containing 10% fetal bovine serum (FBS), 20 ng/ml basic fibroblast growth factor (bFGF), 2 mM L-glutamine and 100 μ/ml:100 μg/ml penicillin-streptomycin (all reagents were obtained from Life Technologies, Paisley, UK, except for bFGF – BD, Franklin Lakes, New Jersey, USA) and cultured in a humidified atmosphere at +37°C, 5% CO2. Medium was replaced every third day. When ~80~90% confluency was reached cells were detached using cell dissociation reagent (TrypLE Express Enzyme, Life Technologies). A portion of cells were split at a ratio 1:5 for further subculturing. Remaining cells were frozen in DMEM/F12 medium containing 10% DMSO (Gaylord Chemical, Slidell, Louisiana, USA) and 20% FBS and stored in liquid nitrogen for later analysis. Passaging was continued maintaining the 1:5 split ratio until confluency could not be reached within four weeks.

Proliferation kinetics

Cells were counted using Bürker chamber at the end of each passage. Population doubling time (PDT) and the number of population doublings (PD) were calculated according to formulas PDT=ln2*T/ln(NT/N0), and PD=T/PDT, respectively, where T – culture time, NT–cell number at the end of a passage, N0–cell number at the beginning of a passage.

Colony forming unit (CFU) assay

Two replicates of 103 cells were seeded in a six-well culture dish using the same medium as that for cell culture and cultivated for 2 weeks in a humidified atmosphere at +37°C and 5% CO2. Medium was changed every fourth day. Dishes were placed on ice and washed twice with cold phosphate-buffered saline (PBS) (Life Technologies). Cells were fixed with ice-cold methanol for 10 min, removed to room temperature and stained with 0.5% crystal violet dye (Sigma-Aldrich, Steinheim, Germany) solution in methanol. The stain was dissolved with 0.5% sodium dodecyl sulphate and absorbance was measured at 539 nm wave length.

Adipo- and osteogenic differentiation

For adipogenesis, ADSCs were cultivated in 12-well culture dishes until 90% confluent. Regular culture medium was replaced with adipogenesis induction medium containing DMEM with high glucose content (Life Technologies), 10% FBS (Life Technologies), 2 mM L-glutamine (Life Technologies), 10 μg/ml human insulin (Life Technologies), 1 μM dexamethasone (Sigma-Aldrich), 100 μM indomethacin (Sigma-Aldrich), 0.5 mM 3-isobutyl-1-methylxanthine (Sigma-Aldrich), 5 μg/ml gentamicin (Life Technologies). Cells in control wells were cultivated in DMEM (high glucose) supplemented with 10% FBS. Cells were cultured in a humidified atmosphere at +37°C and 5% CO2 and medium was replaced every third day. Lipid droplets were detected after 16 days by Oil Red O (Sigma-Aldrich) staining.
For osteogenesis, ADSCs seeded on 12-well plates were allowed to reach 70% confluency. Osteogenic differentiation was induced by adding medium containing DMEM with low glucose content (Life Technologies), 10% FBS (Life Technologies), 2 mM L-glutamine (Life Technologies), 10 mM glycerol-2-phosphate (Sigma-Aldrich), 50 μM L-ascorbic acid (Sigma-Aldrich), 0.1 μM dexamethasone (Sigma-Aldrich), 5 μg/ml gentamicin (Life Technologies). Control cells were cultivated in DMEM (low glucose) with 10% FBS. Cells were cultured in a humidified atmosphere at +37°C and 5% CO2 and medium was replaced every third day. After 30 days, extracellular calcium accumulation was detected by Alizarin Red S (Sigma-Aldrich) staining and alkaline phosphatase activity was determined using BCIP/NBT (Sigma-Aldrich) as a substrate.

SA-β-galactosidase assay

2.5×10⁴ cells were seeded in a 96-well plate in triplicates. After 48 hours, β-gal expression was detected using Senescence Cells Histochemical Staining Kit (Sigma-Aldrich) according to manufacturer’s instructions. To obtain a quantifiable result, images of stained cells were acquired with PowerShot S80 digital camera (Canon, Melville, New York, USA) and evaluated by two independent observers according to two parameters – color intensity and percentage of stained cells per field of view. For color measurement, a 5-point intensity scale was developed where 0 equaled ‘no staining’ and 5 – ‘very dark color’.

MTT assay

2.5×10⁴ cells were seeded in a 96-well plate in triplicates. After 48 hours, MTT assay was performed using Vybrant® MTT Cell Proliferation Assay Kit (Life Technologies) according to manufacturer’s instructions. Absorbance was measured at 539 nm after overnight dissolution of formazan.

Quantitative peroxide assay

100 μl of ADSCs (1×10⁶ cells per ml) were lysed by repeated freezing in liquid nitrogen and thawing at 42°C. Peroxide level in cell lysates was determined using Pierce Quantitative Peroxide Assay Kit (Thermo Scientific, Rockford, Illinois, USA) according to manufacturer’s instructions on lipid-compatible procedure. Absorbance was measured at 620 nm.

Reverse transcriptase polymerase chain reaction

RNA was isolated from ADSCs with TRI reagent (Sigma-Aldrich) according to manufacturer’s instructions except that RNA was precipitated in isopropanol overnight at −20°C in the presence of 120 ng of glycogen (Thermo Scientific). RNA quality and quantity was determined by NanoDrop® ND-1000 spectrophotometer (Thermo Scientific). 500 ng of DNase-treated RNA was subjected to complementary DNA synthesis using RevertAid First Strand cDNA Synthesis Kit (Thermo Scientific). The reaction was carried out with oligo(dT) primer according to manufacturer’s instructions. 1 μl of cDNA was added to a PCR reaction mixture containing 2X PCR Master Mix (Thermo Scientific) and 0.4 μM primers (Metabion, Planegg, Germany) to amplify a set of genes (Table S1). Reaction conditions were as follows: initial denaturation at 94°C for 3 min followed by 30 cycles of 94°C for 30 s, 60°C for 30 s and 72°C for 45 s, finished with a 5 min extension at 72°C. Amplification products were visualized by ethidium bromide staining in agarose gel electrophoresis. Densitometric analysis of acquired images was carried out using ImageJ software (version 1.48).

Telomere Flow FISH

Relative telomere length of cultured ADSCs was assessed with Telomere PNA Kit/FITC for Flow Cytometry (Dako, Glostrup, Denmark) according to manufacturer’s instructions using BD FACSCanto flow cytometer with BD FACSDiva Software (version 7.0). Jurkat cell line (ATCC/LGC Standards, Boras, Sweden) served as inner control. Each sample was assayed twice. 20 000 events were counted per measurement. Flow cytometer calibration was performed using BD Cytometer Setup and Tracking Beads. Results were analyzed using Infinicyt software (version 1.5.0) (Cytognos, Salamanca, Spain).

DNA index

DNA index of ADSC and Jurkat cells was measured with CycleTEST PLUS DNA Reagent Kit (BD) using BD FACSCanto flow cytometer and ModFit LT v3.3 software (version 3.3) (BD). The procedure was carried out on freshly thawed cells according to manufacturer’s instructions.

Statistical analysis

Statistical analysis was performed in R software (version 3.0.2). Comparison of two data sets was done by t-test or Wilcoxon’s test based on homogeneity of dispersions which was determined by F-test. Relation between results obtained by two different tests was assessed by correlation or regression analysis. For correlation analysis, Shapiro-Wilk test for normality was used to determine whether data were normally distributed. Depending on normality, Pearson or Spearman correlation was used. Regression analysis was performed using lm() function. Regression assumptions were tested by graphic analysis. The influence of each data point on regression model was estimated with Cook’s distance. Significance level for all tests were α=0.05.

Results

Proliferation capacity and morphology of ADSCs during in vitro long-term cultivation

Growth kinetics

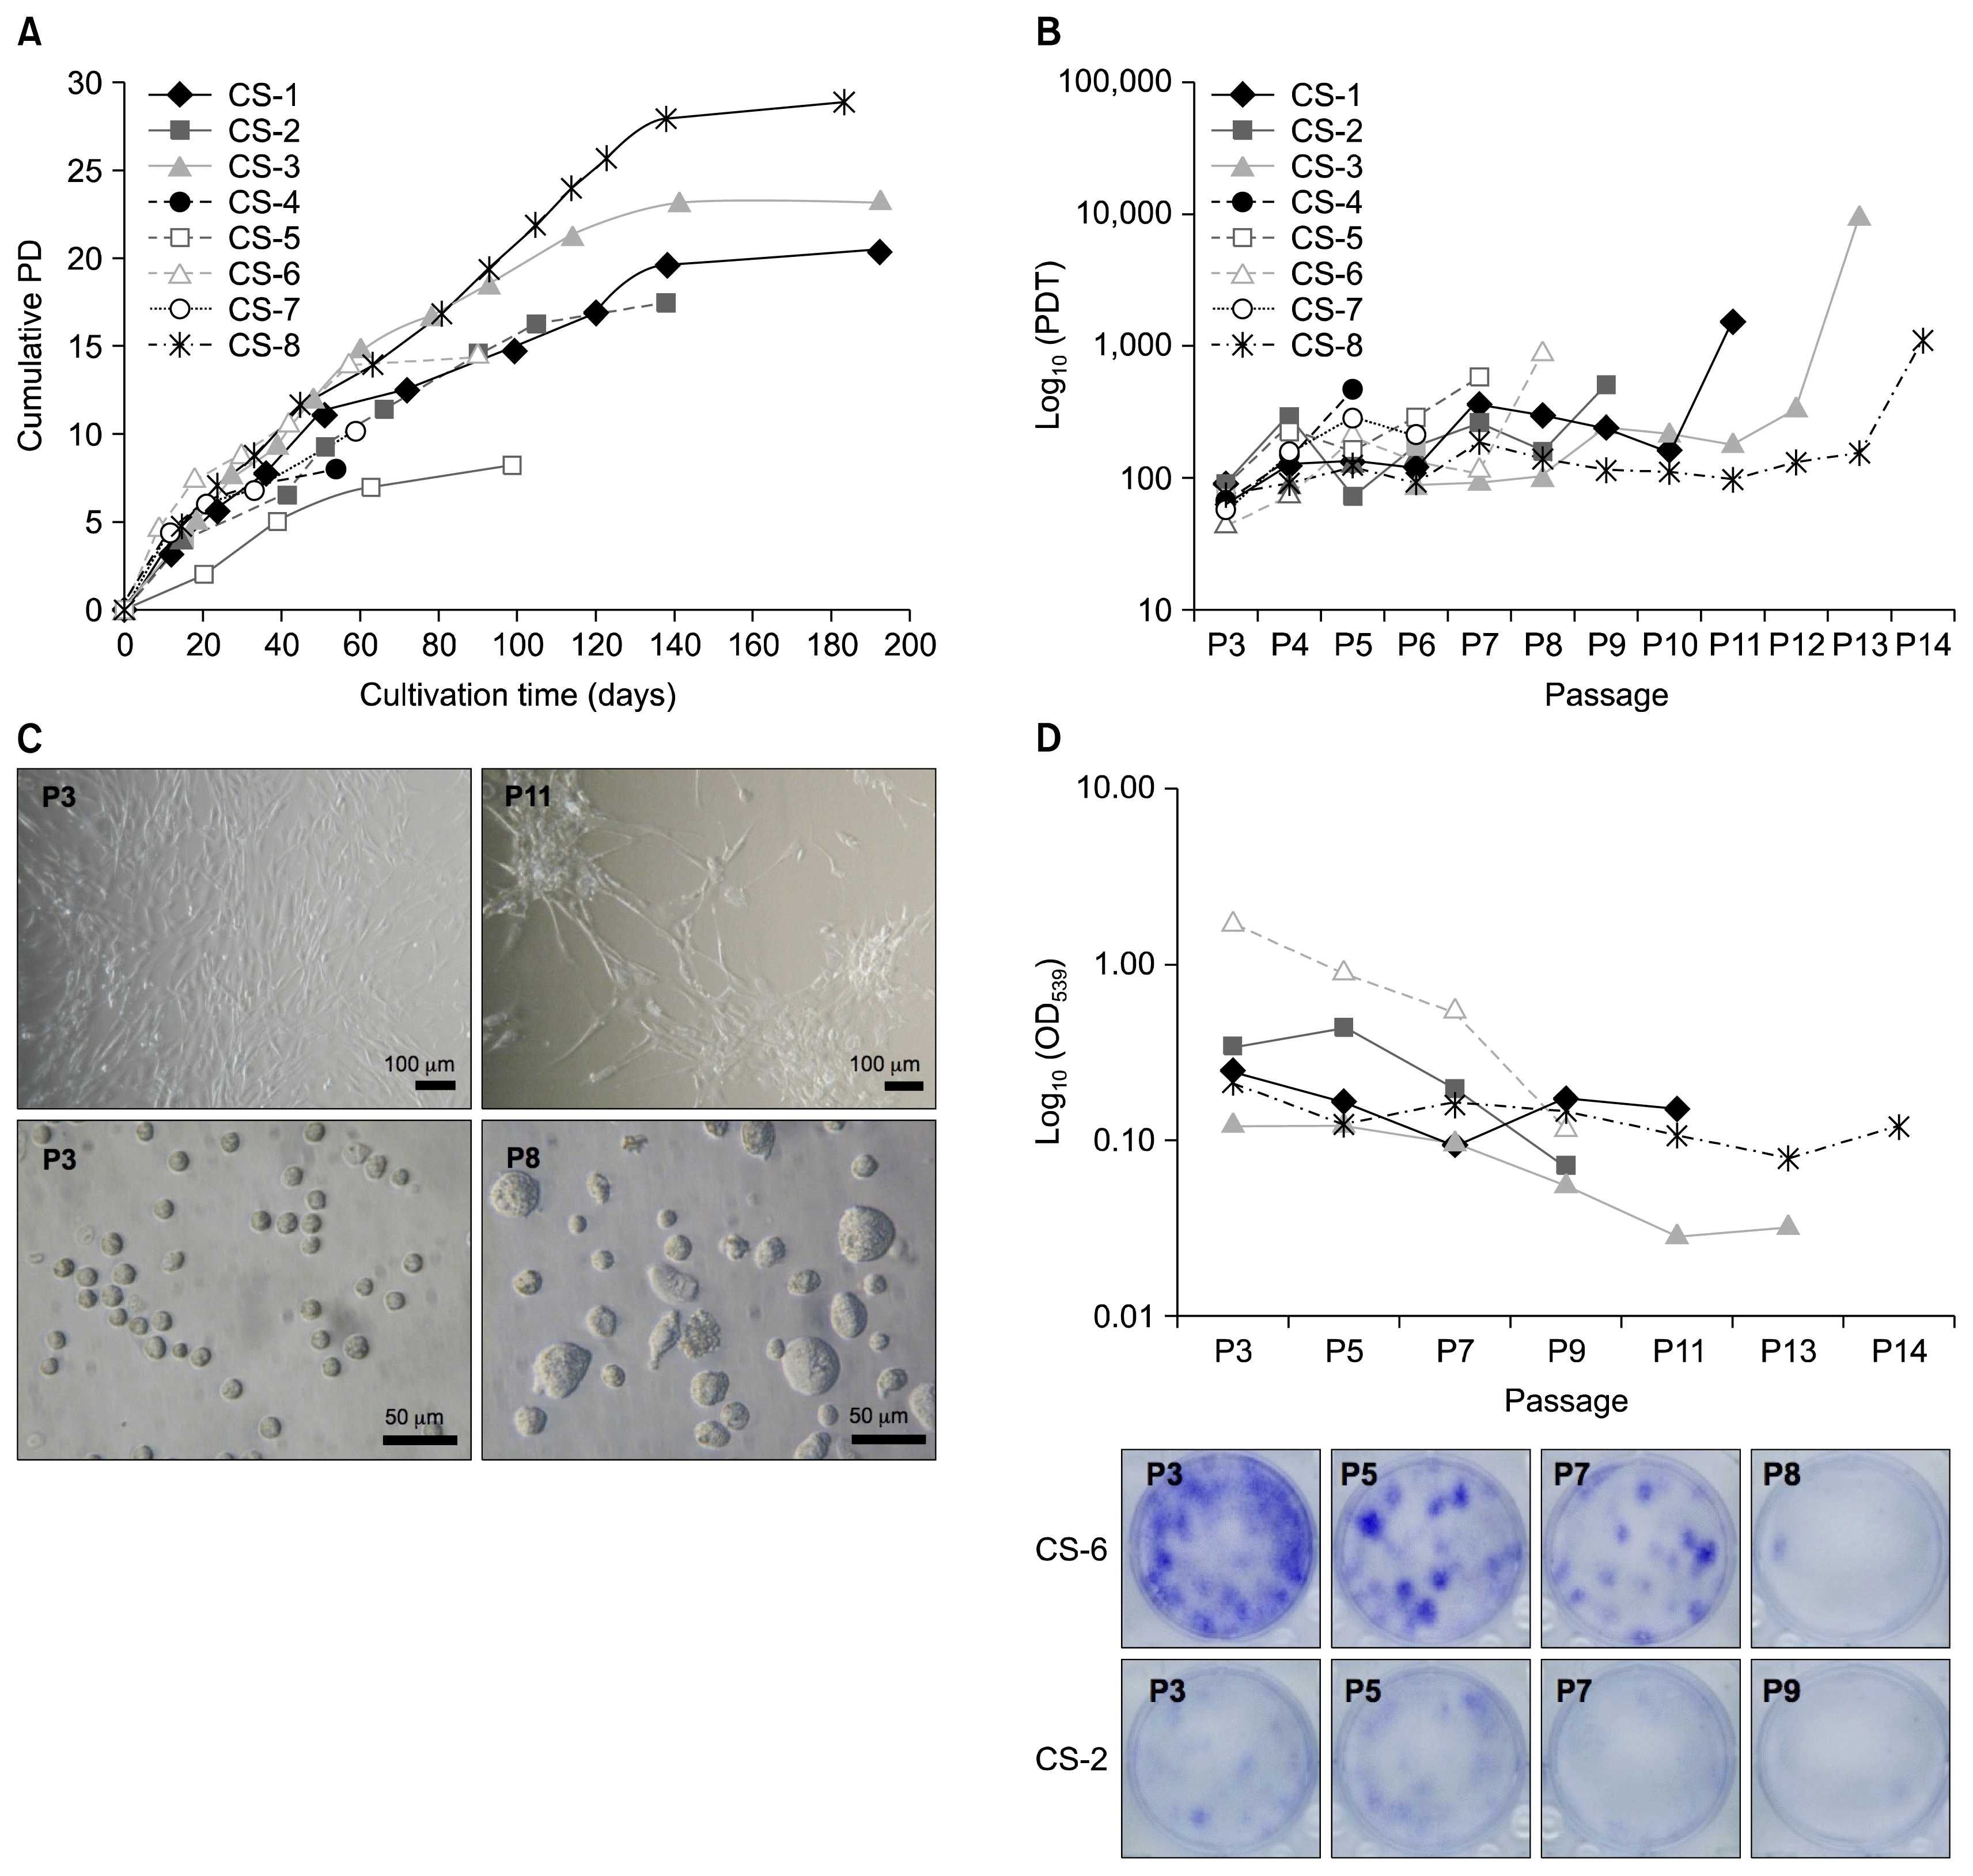
To assess cellular senescence in ADSCs, cell cultures from eight donors were subjected to long-term in vitro cultivation. For most donors, cells had been cryopreserved at P2 before beginning of the study (Table 1). After reaching confluency, a portion of cells was frozen for later analysis while the rest were reseeded to start the next passage. Subculturing was terminated if more than 4 weeks were necessary for cells to become confluent. Individual ADSC cultures reached the state of proliferation arrest after a considerably different time as were seen by differences in their respective cumulative PD values (Fig. 1A). Three cultures (CS-4, CS-5 and CS-7) stopped proliferating as early as after three (CS-4) or four (CS-5, CS-7) passages (cumulative PDs were 8.02, 8.30 and 10.19, respectively) and were excluded from further senescence evaluation as unsuccessfully expanded. In the remaining cultures, the number of cumulative PD varied from 14.69 (CS-6) to 28.97 (CS-8) (Table 1).
The proliferation rates of all cultures decreased unevenly during expansion (Fig. 1B) despite maintaining consistent split ratio of equally dense monolayer cultures. One (CS-1, CS-3, CS-6, CS-8) or two (CS-2) pronounced peaks of increased PDT were observed in the middle part of cultivation followed by reactivation of proliferation in subsequent passages. Proliferative ability of all cultures was lost very rapidly at the last passage indicated by 3.7 to more than 10-fold increase of PDT comparing to penultimate passage. The arrested proliferation was also denoted by the minimal increase of cumulative PDs at the last passage (Fig. 1A). It has been reported that MSC proliferation potential lowers both with increasing time in culture and donor age (13). We found a positive regression between passage number and PDT (p<0.05) in samples CS-1 and CS-3, while in the case of CS-6 and CS-8, p value was close to significance level. Such relation was absent in CS-2 due to specifics of the growth curve. After the exclusion of unsuccessfully expanded cultures the rest of the samples fell into two distinct age categories – above 50 (CS-1, CS-2, CS-3) and under 40 years (CS-6, CS-8). There were no significant differences in growth kinetics between these groups, although the small sample size might compromise the validity of this observation.

Morphology

Morphologically, all cultures showed typical spindle-shaped appearance of MSCs at early passages. During long-term culture, the commonly described senescence-associated changes were observed: the increase of average cell size and heterogeneity, flattening of cells, irregular cell shape, and accumulation of granular inclusions in cytoplasm. Also, cells in late passages had a tendency to grow in star-shaped clusters rather than to form monolayers (Fig. 1C). However, similarly to previously described fluctuations in ADSC growth rates during culture, morphological changes did not accumulate evenly. Reappearance of spindle-shaped cells could be observed at P8 of sample CS-1 (Fig. S1). These cells dominated during P9 and P10 and possessed heightened proliferative abilities as indicated by decrease of PDT by 37.5% and 54.2% at P9 and P10, respectively when comparing to P7 (Fig. 1B). Similar observations were made in other ADSC cultures as well (data not shown).
At early passages, no significant differences in cell morphology were observed among donors. During long-term cultivation, donor-specific characteristics of cell appearance became visible (Fig. S2) indicating different course of aging in individual cultures. Nevertheless, all cultures reached terminal senescence having a typical look of aged cells and were unable to further divide.

Clonogenicity

Alterations in ADSC clonogenic property was assessed using CFU assay. 103 cells were seeded in a six-well plate in two replicates, cultured for 2 weeks and stained with crystal violet. Since we observed a tendency of cells to grow in a more diffused manner rather than form dense colonies the dye was dissolved after staining and quantified spectrophotometrically. Others have shown that colony forming ability negatively correlates with PDT, donor’s age and passage number (28). Our results showed a negative correlation between CFU test value and PDT, but it was not significant (p>0.05). Nevertheless, statistically significant negative relation between CFU test value and passage number existed (p<0.05). Again, the presence of donor variance was observed (Fig. 1D). This was illustrated by CFU test value of sample CS-6 which exceeded that of other cultures 7.47 times on average at P3. However, this difference rapidly declined during culture and reached the level of other samples at the last passage.

Senescence-related alterations of ADSC properties

Differentiation

Differences in adipo- and osteogenic potential between ADSCs from early (P3) and late (P9) passage were analyzed. Adipogenesis was assessed by staining intracellular lipid droplets with Oil Red O after 16 days of cultivation in adipogenesis induction medium. Osteogenesis was demonstrated by alkaline phosphatase activity and Alizarin Red S staining of accumulated calcium deposits after 30 days of differentiation. The results confirmed the ability of ADSCs to differentiate into the two lineages albeit with varying efficiencies among donors (Fig. 2). Accumulation of both lipid inclusions and extracellular calcium reduced dramatically at P9 compared to P3 (Fig. 2A, B). On the other hand, the level of alkaline phosphatase activity remained unchanged between passages (Fig. 2C).

Senescence-associated β-galactosidase expression

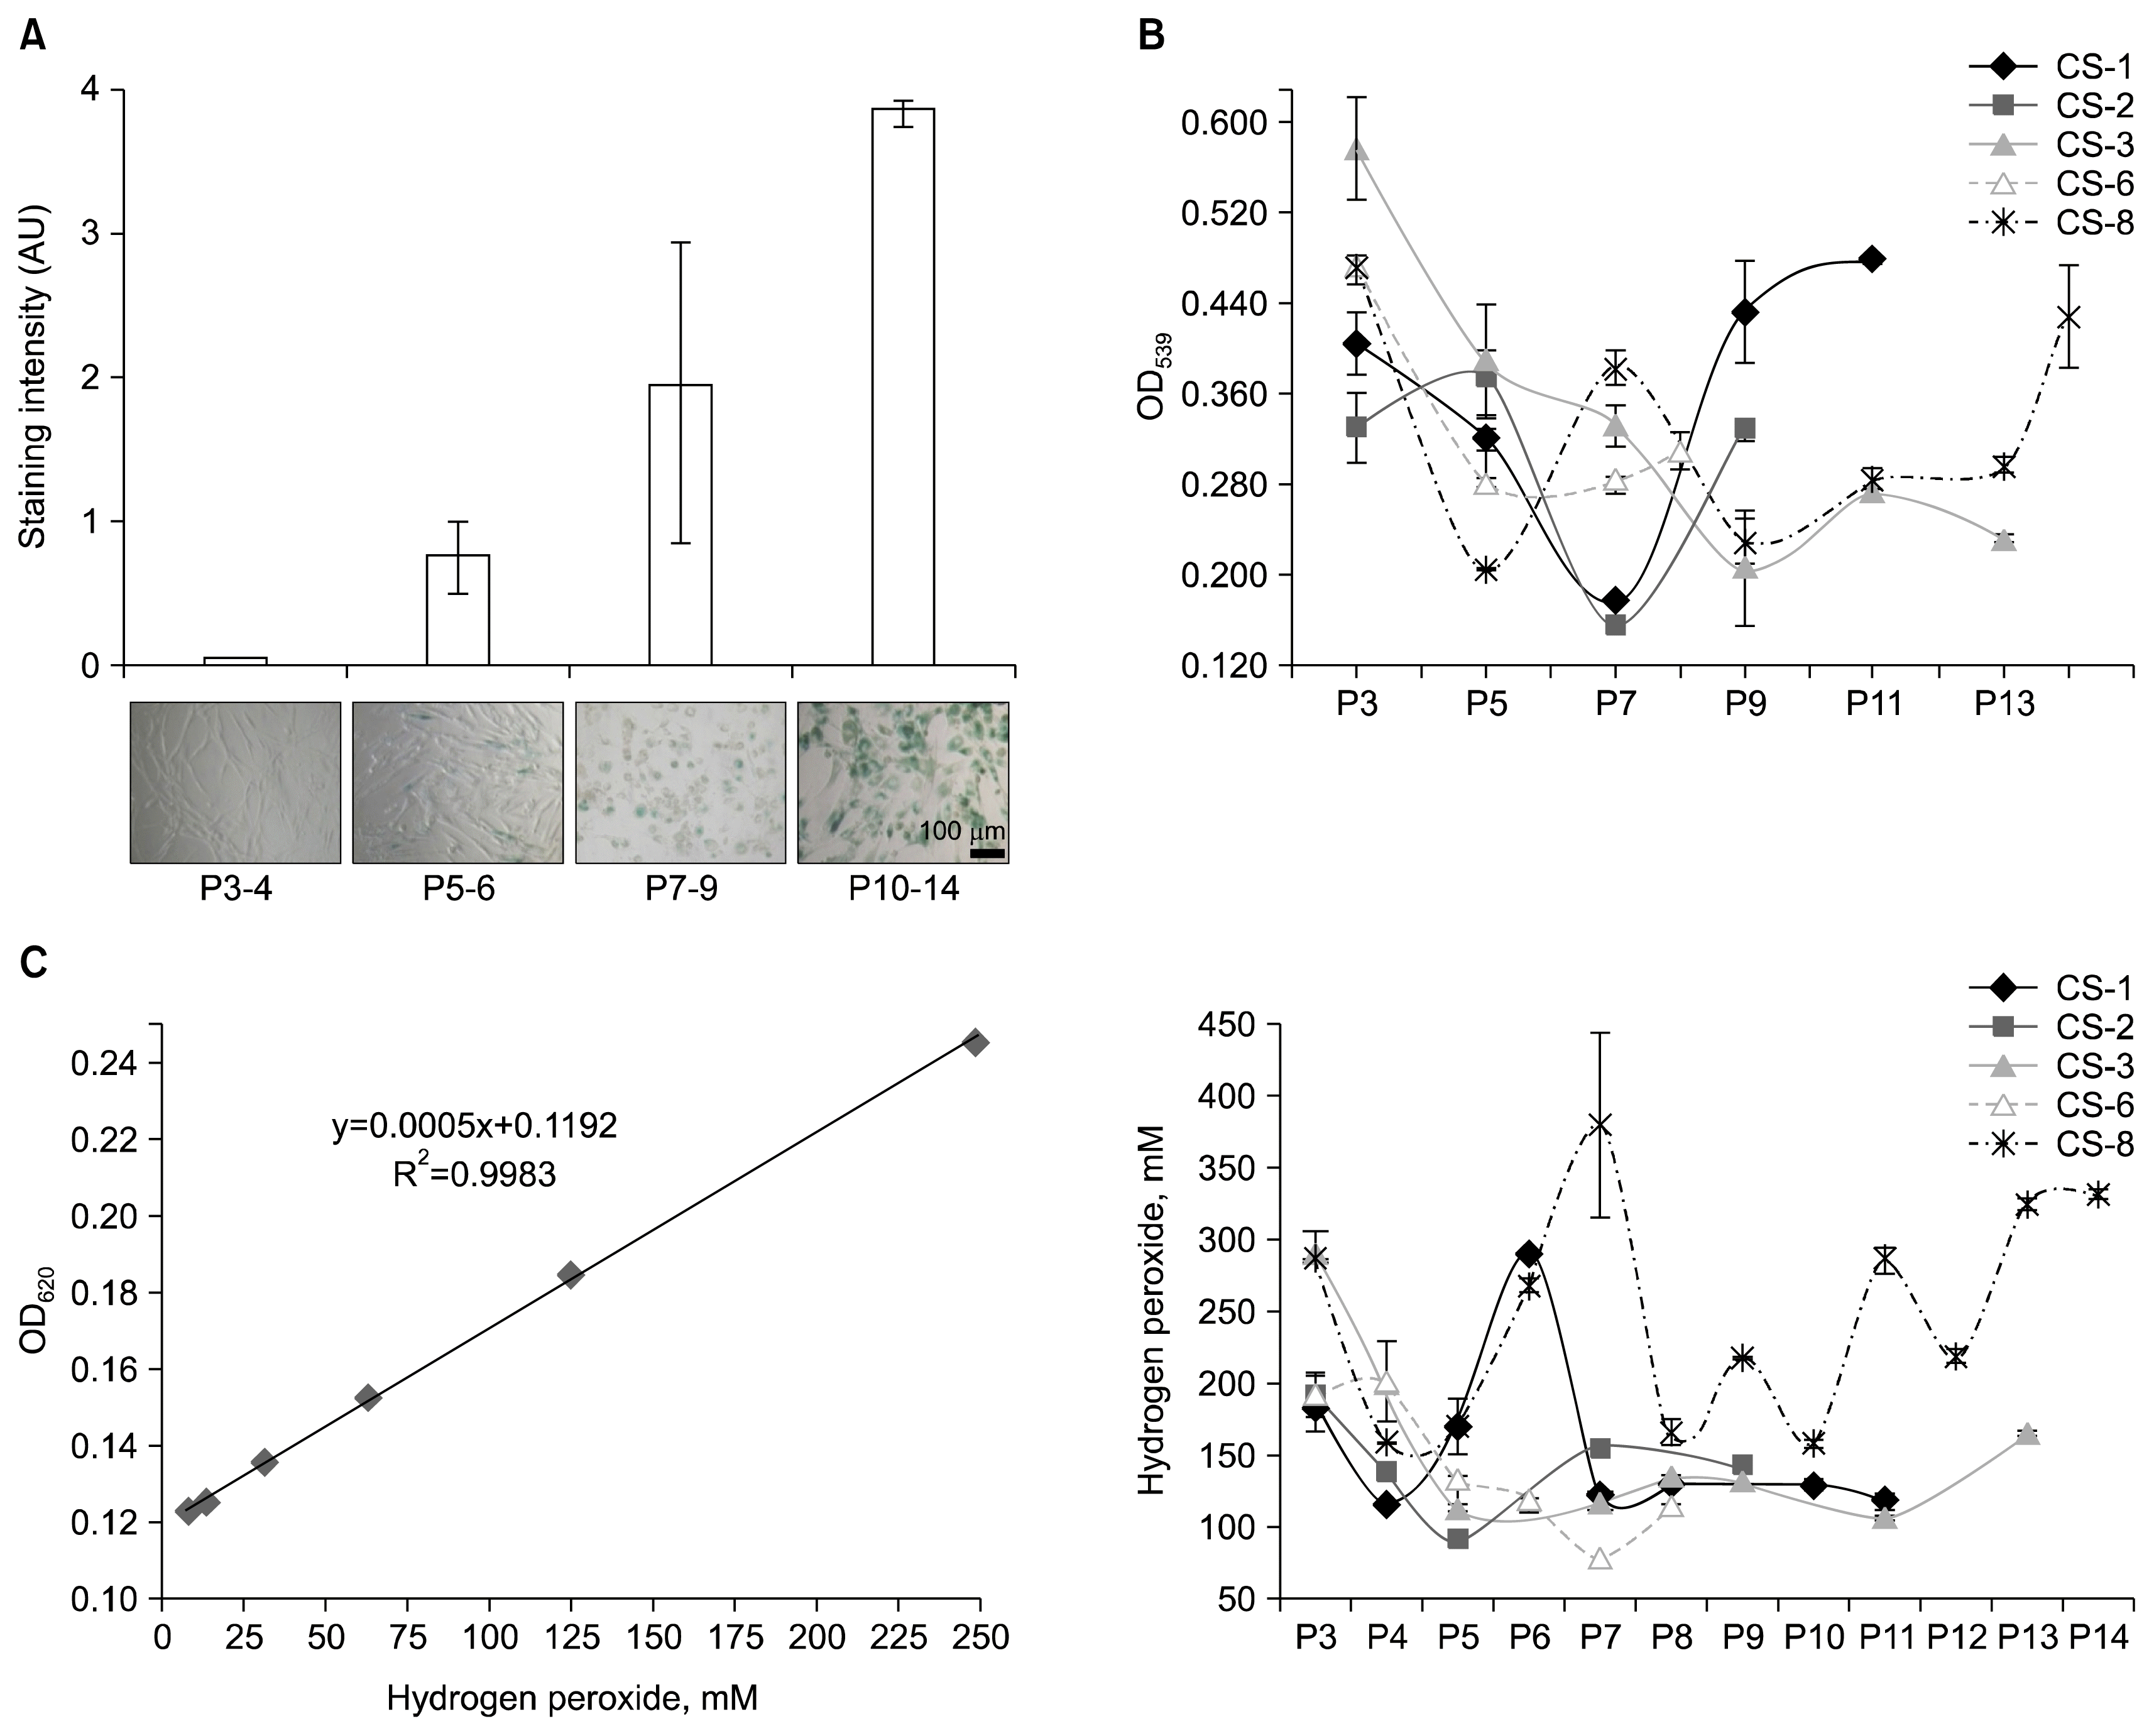
As a common indicator for cellular senescence, expression of SA-β-gal was determined by a histochemical staining method. Every other passage of long-term culture-expanded ADSCs was analyzed. Images of non-overlapping fields of view were evaluated by two independent observers to quantify SA-β-gal expression levels. As expected, little or no SA-β-gal expression was detected in early passages with subsequent increase during further cultivation (Fig. 3A). This result was confirmed by regression analysis revealing a positive association between SA-β-gal expression value and passage number. However, this was not significant (p>0.05) due to fluctuations of SA-β-gal expression levels in samples CS-1, CS-3 and CS-8 (Fig. S3). Interestingly, these fluctuations were concomitant with those observed in growth analysis confirmed by statistically significant positive correlation (p> 0.05) between SA-β-gal expression level and PDT.

Metabolic activity

ADSC metabolic activity was assessed by MTT (3-(4,5-dimethylthiazol-2-yl)-2,5-diphenyltetrazolium bromide) assay. Every other passage was tested. MTT test results showed no association with passage number in neither sample (p>0.05) indicating that, in our experimental conditions, changes of enzymatic activity in cells were not directly related to time in culture or PDT. However, the overall metabolic activity was higher in early passages, decreased during culture and increased once again towards the end of cultivation (Fig. 3B). This result might be explained by a shift in dominant cellular functions during long-term culture. Accordingly, elevated metabolic activity at early passages is consistent with rapid proliferation which ceases as cells approach senescence. In support of this, the lowest absorption values were detected at passages with proliferation slowdown peaks in growth curves (CS-1-P7, CS-2-P7, CS-3-P9, CS-6-P5) (Fig. 1B). The subsequent increase of metabolic activity at late passages could, on the other hand, be explained by such energy-consuming cellular phenomena as senescence-associated secretory phenotype (SASP), characterized by an active secretion of chemokines, cytokines, and other factors participating in inflammation, growth stimulation, tissue remodeling and matrix degradation, and autophagy, a process of nonspecific degradation of cytoplasmic components, which has been shown to be functionally linked to SASP, at least in certain cases (29). Thus, according to our data, increased MTT test values after a ‘fall’ might be associated with senescence.

Intracellular peroxide

Fluctuations of intracellular peroxide in ADSCs were measured quantitatively. Standard curve was generated using 2-fold serially diluted H2O2 starting with 1 mM standard. For precision, dilutions were prepared twice and each set of standards was measured in duplicate. Since the standard curve was not linear over the entire assay range only low end range was used (R2=0.9983) (Fig. 3C, left panel). The measurements of samples fell in this range.
Intracellular peroxide levels showed no association with neither passage number, nor PDT, nor metabolic activity (p>0.05). Peroxide concentrations varied among donors and there were substantial fluctuations even among passages of a single donor (Fig. 3C, right panel). Thus, no direct association between peroxide accumulation and senescence was proved in this study.

Gene expression profiles and transcription activities

To screen for alterations in gene expression in ADSCs during long-term culture 25 genes associated with such cellular functions as DNA repair, cell cycle regulation, antioxidation activity, apoptosis and epigenetic regulation were studied. Relative gene expression was determined by reverse transcription PCR and normalized against β-actin expression. The amplified products were visualized by ethidium bromide staining and quantified by densitometry analysis. Out of 25 genes tested, transcripts of three genes (TERT, BIRC5, GSTA5) were not detected in neither culture except CS-8 showing weak expression of BIRC5 (data not shown). For the rest of the genes, expression profiles were strongly donor-specific (Fig. S4) and rendered it impossible to associate the transcription of any of the genes with the development of senescence.

RTL and detection of ADSC subpopulations

To determine whether ADSC senescence phenotype was associated with alterations in telomere length, fluorescence in situ hybridization technique for flow cytometry (Flow FISH) was utilized using FITC-conjugated telomere-specific peptide nucleic acid (PNA) probes. The specific fluorescence was calculated by subtracting autofluorescence of cells without probe. Jurkat cells were added to each sample at a 1:1 ratio to normalize for inter-experimental variations. Cells in G0/G1 phase were discriminated by propidium iodide staining. Given the pseudodiploid karyotype of Jurkat cells (30) DNA index measurement was made. It was 1.00 for ADSCs (2n) and 1.83 for Jurkat cells (data not shown).
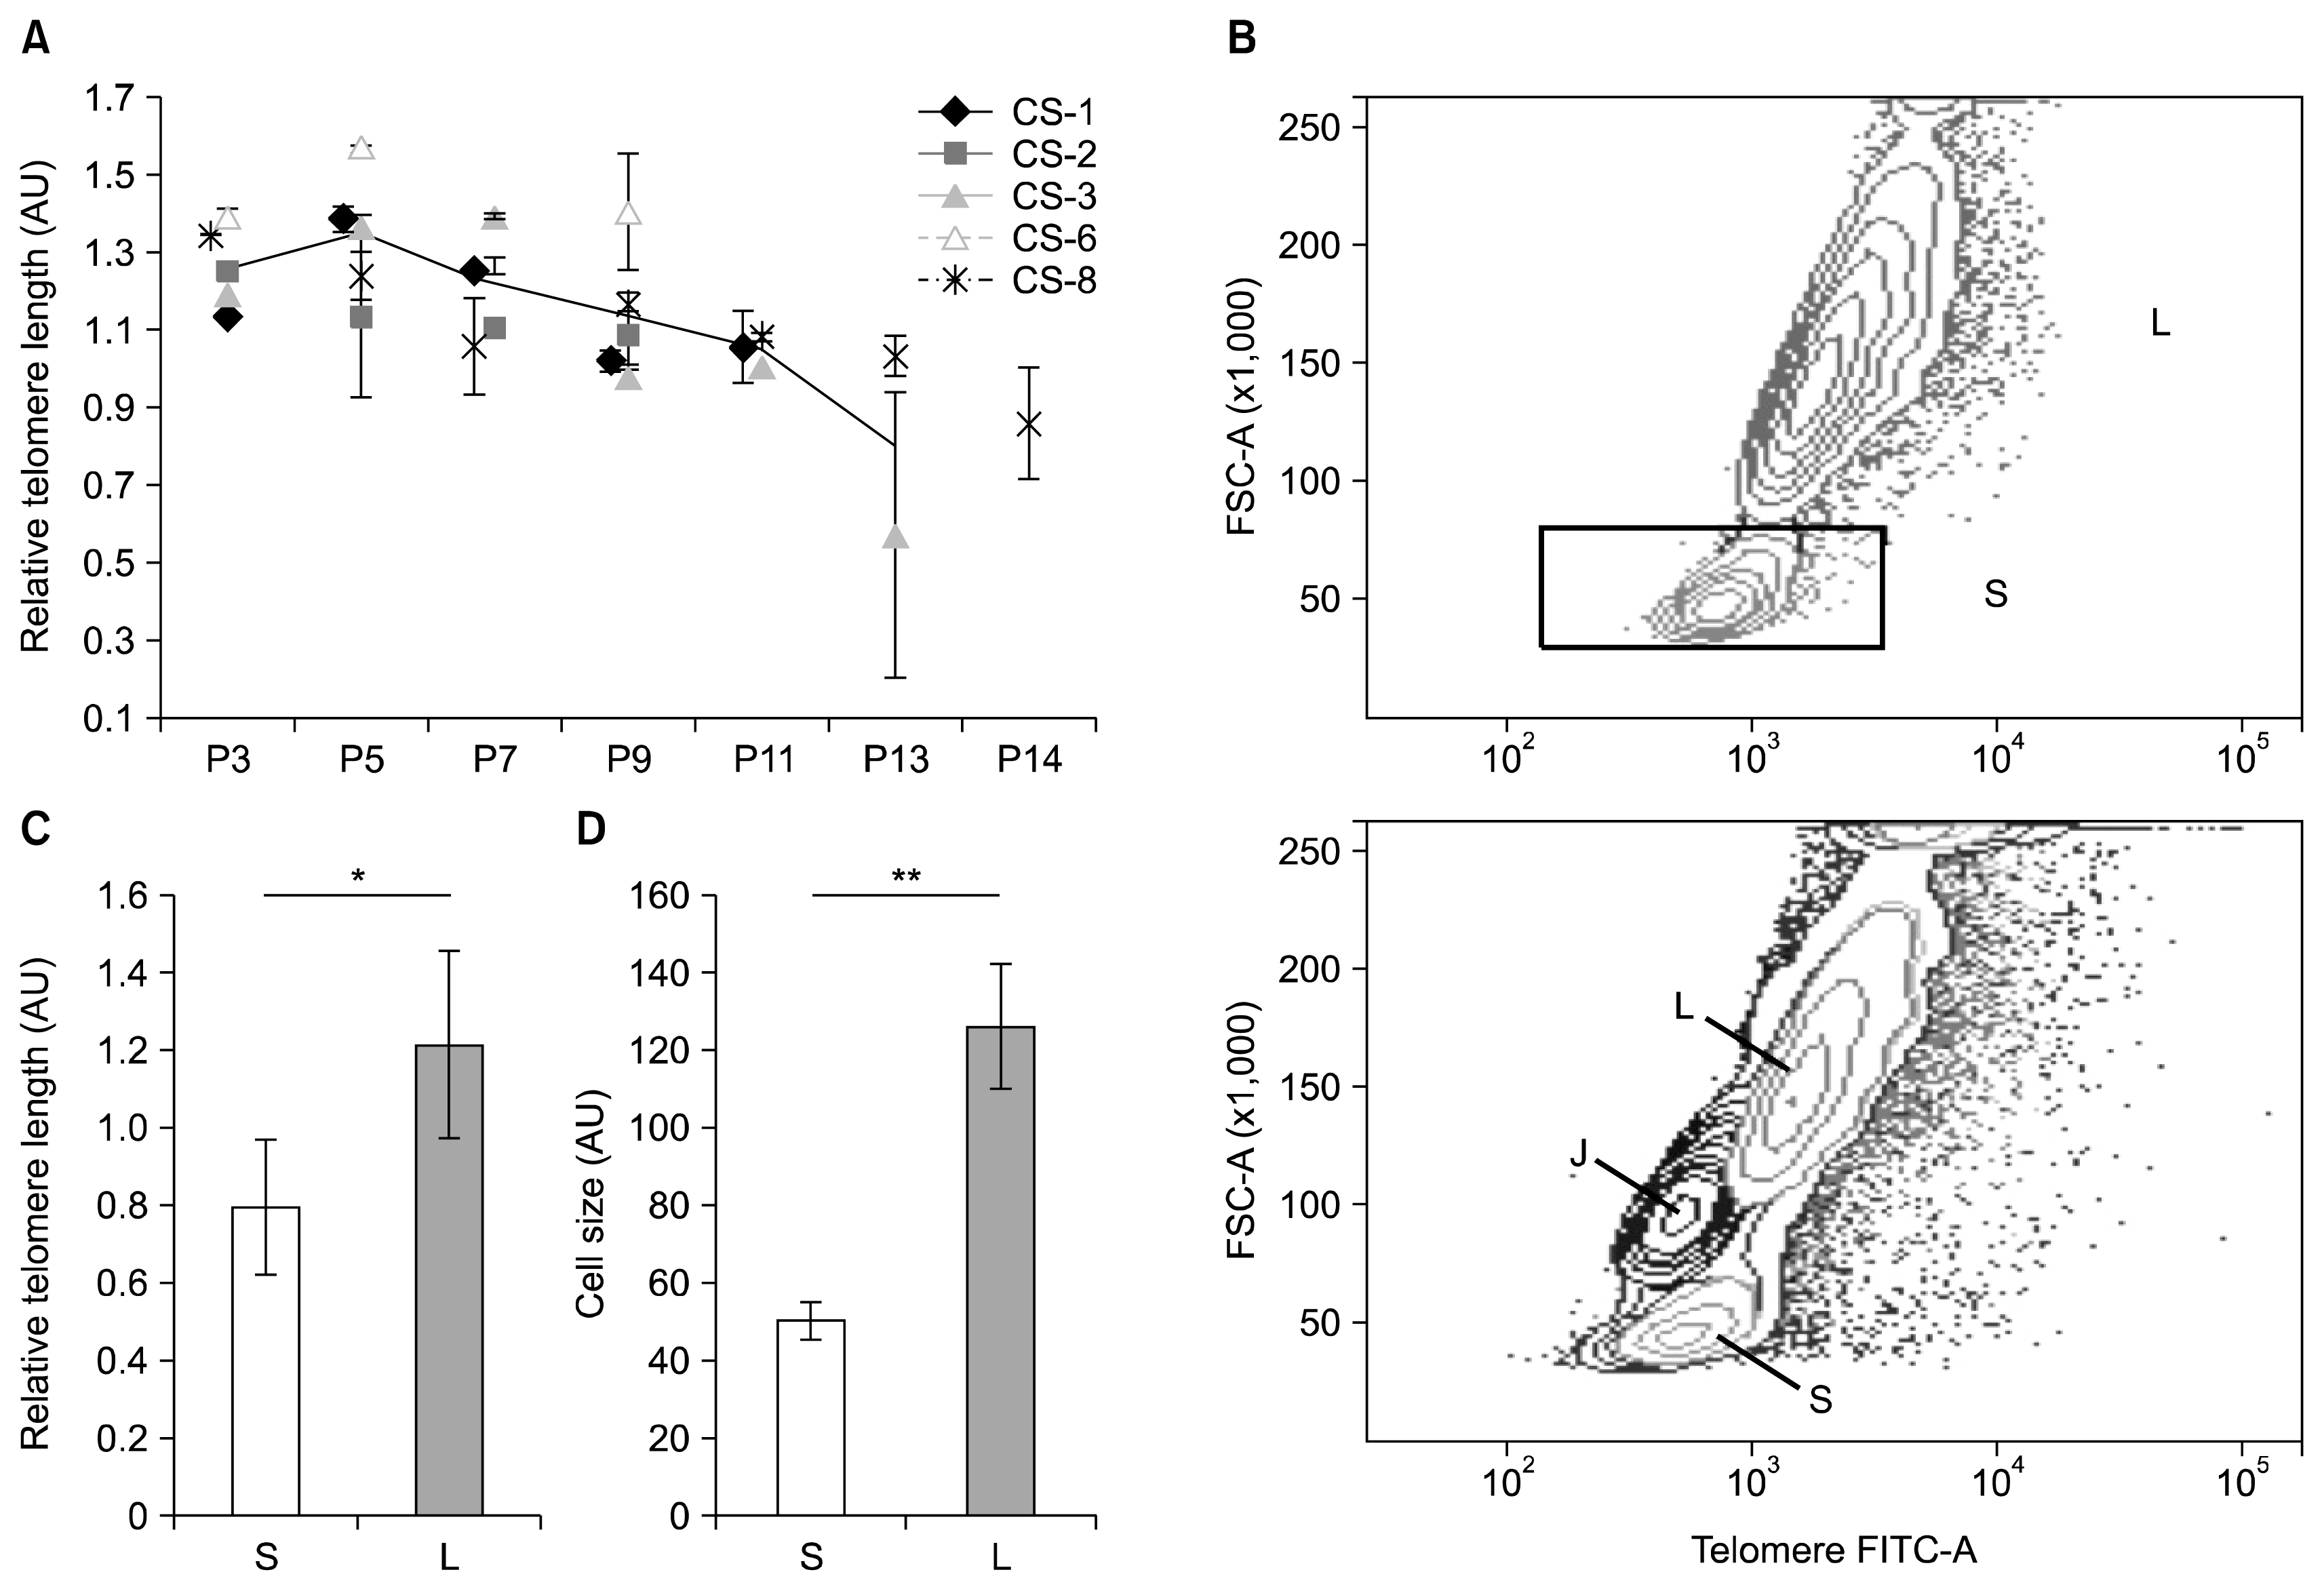
Results indicated that RTL significantly decreased in two samples (CS-3 and CS-8) when comparing the first and last passage (52.3% and 35.8%, respectively, p<0.05) (Fig. 4A). However, fluctuations of RTL were seen during passaging as in the previous tests indicating the complex nature of senescence process.
To test whether the increase of telomere length observed in some passages could occur due to pseudo-lengthening of telomeres because of the presence of various cell sub-populations, forward scatter signal versus telomere-specific FITC fluorescence were analyzed. Surprisingly, two well-separated ADSC subpopulations were detected in all samples and passages analyzed albeit at varying quantitative relations among donors (Fig. 4B, Table 2). This result was specific to ADSCs since no such observation was made for simultaneously tested Jurkat cells (Fig. 4B, lower panel). Interestingly, the discovered subpopulations differed significantly in terms of RTL and cell size (p<0.05, Fig. 4C, D) and were designated as S population for ‘small’ cells and L population for ‘large’ cells. The mean RTL of S population was 0.95 to 1.75 times shorter than that of L population, while the difference of cell size was 2 to 3-fold depending on the sample.
As seen in Table 2, a gradual decrease of RTL during passaging was detected in both populations of CS-3 and CS-8 but for CS-1, only in L population (p<0.05). Furthermore, the shortening of RTL occurred more rapidly in L population compared to S in samples CS-1, CS-3 and CS-8, and, at the last passage, RTL difference between populations became insignificant. Since the cells lost their proliferative ability very rapidly at the last passage (Fig. 1A, B), this might indicate the critical telomere length blocking further proliferation. On the other hand, samples CS-2 and CS-6 followed a different pattern. For CS-6, there were no significant RTL changes during passaging in neither population (p>0.05), while for CS-2, changes were seen only in S population, but they were not significantly associated with passage number (p>0.05, Table 2). Thus, the senescence of these cultures might be caused by factors other than critically short telomeres.
During passaging, changes in quantitative relation between subpopulations were observed in a donor-specific manner (Table 2). When the dynamics of S population quantity and peaks of proliferation slowdown (Fig. 1B) were compared, it was found that peaks corresponded either to the highest percentage of S population cells (for CS-1, the amount of S cells was 2.6% in P3 and 10.9% in P7; for CS-8 – 3.0% in P3 and 32.6% in P7) or to substantial RTL decrease in the S population (for CS-3, RTL decreases by 35% in P9 compared to P7; for CS-2 – by 49% in P7 compared to P5).

Discussion

In this study, we aimed to analyze the development of senescence of eight ADSC cultures previously frozen and stored in liquid nitrogen for 1.5 to 3.5 years.
Originally, all cultures were obtained and cultivated at 5% oxygen in the presence of autologous serum before they were cryopreserved. By contrast, this work employed ambient oxygen and FBS as a serum source which might have impacted the course of senescence. However, such conditions mimic a realistic situation when patient’s cells have been cryopreserved in a tiered cell banking system, a recommended practice to minimize microbial contamination and facilitate large-scale cGMP-compliant cell production (31). In this case, cells can be stored in a master bank for an unknown period of time before further manufacturing is required. Due to evolving technological and regulatory requirements long-preserved cell products may become unintentionally exposed to suboptimal culture conditions.
MSC cultures are thought to be heterogeneous, comprised of subpopulations of cells with diverse features including multilineage potential, growth properties and clonogenicity (32, 33) During expansion, cell subsets possessing specific properties can be selected (34). Our data confirm the complex structure of MSC population by interrelated fluctuations of growth rate, morphology and SA-β -gal expression. Furthermore, an interesting observation was made by telomere Flow FISH when two distinct ADSC populations with significantly different cell size and RTL were found. The question remains whether this finding represents ‘real’ subpopulations of ADSCs. To prepare cells for RTL measurement they are subjected to harsh conditions such as high-temperature denaturation in the presence of a chaotropic agent (formamide) which is shown to have a detrimental effect on chromosomal morphology (35). Furthermore, Baerlocher and colleagues reported that heat and formamide treatment changed light scatter properties of human leukocyte subsets compared to untreated control (36). They also noticed swelling of cells upon prolonged exposure to hybridization mixture which depended on the composition of buffer used to suspend cells. Thus, forward scatter signals of S and L population are not necessarily an indication of the true size of these cells but should rather be perceived as a feature of tested ADSCs resulting in two distinct responses to treatment conditions as measured by Flow FISH. Nevertheless, the RTL difference of these two populations is clearly seen. Furthermore, unlike ADSCs, the control Jurkat cells, though undergoing the same treatment, retained their optical homogeneity and were not separated into distinct subpopulations, thus suggesting that the phenomenon is not a pure artifact.
Although several mechanisms of senescence are described, reduction of telomere length is studied in most detail. Other groups have reported mixed results concerning the role of telomere length in causing senescence (37, 38). The data obtained in this study allow us to conclude that both telomere-dependent and independent mechanisms could be observed in studied ADSC cultures. According to the telomere shortening pattern observed in S and L populations (Table 2) we hypothesize that three cultures (CS-1, CS-3, CS-8) entered replicative senescence (telomere length of L population reached that of – population at the end of cultivation), the other two (CS-2, CS-6) – premature senescence (telomere length of L populations did not change significantly). The three samples excluded from the study (CS-4, CS-5 and CS-7) are likely to be added to premature senescence group. It is reported that MSCs cease to proliferate when their telomeres reach approximately 10 kb in length (15). However, it is also known that critical telomere length can be as low as 4.5 kb (39). In our case, considering the reported average telomere length of Jurkat cells (11.5 kb) (40) that served as a control for RTL analysis, the extrapolated telomere lengths of L subpopulation at the last passage were 9.89, 6.78 and 8.28 kb in samples CS-1, CS-3 and CS-8, respectively which is in agreement with literature and the concept of replicative senescence. On the other hand, the same measurement revealed 13.57 kb in CS-2 and 17.82 kb in CS-6 further supporting the assumption of premature senescence in these samples. Moreover, the total number of PDs of these samples was lower than CS-1, CS-3 and CS-8 (Table 1) and the same result was seen in SA-β-gal test – the mean expression of the enzyme was 1.88 times lower at the last passage of CS-2 and CS-6 compared to the last passage of other samples (Fig. 4S).
According to our results, the preference for the two forms of senescence – replicative and premature – in the cells is dictated in a donor-specific manner. All ADSC cultures were initially obtained by a similar procedure, were all exposed to stress by changing culture conditions and propagated simultaneously under the same conditions. Nevertheless, one of the main observations in this study is the high level of donor variability. Diverse growth properties and functionality of MSCs obtained from different donors were observed previously (28) and are likely explained by different genetic backgrounds, clinical histories and lifestyle of individual donors.

Conclusions

The work presented here demonstrates that human ADSCs are heterogeneous and consist of cell subpopulations which play a major role in the course of in vitro senescence in every individual cell culture. Moreover, the pattern of in vitro aging is strongly donor-specific which my have important implications in personalized medicine.

Supplementary Information

Acknowledgments

We are thankful to Dr. habil.biol Paul Pumpens for scientific support and advice. This work was supported by the project No.10.0014 of the Latvian Council of Science.

Notes

Potential conflict of interest

The authors have no conflicting financial interest.

Supplementary Materials

Supplementary data including four figure can be found with this article online at http://pdf.medrang.co.kr/paper/pdf/IJST/IJST-09-s003.pdf.

References

1. Zuk PA, Zhu M, Ashjian P, De Ugarte DA, Huang JI, Mizuno H, Alfonso ZC, Fraser JK, Benhaim P, Hedrick MH. Human adipose tissue is a source of multipotent stem cells. Mol Biol Cell. 2002; 13:4279–4295. DOI: 10.1091/mbc.E02-02-0105. PMID: 12475952. PMCID: 138633.
crossref
2. Fraser JK, Wulur I, Alfonso Z, Hedrick MH. Fat tissue: an underappreciated source of stem cells for biotechnology. Trends Biotechnol. 2006; 24:150–154. DOI: 10.1016/j.tibtech.2006.01.010. PMID: 16488036.
crossref
3. Ikegame Y, Yamashita K, Hayashi S, Mizuno H, Tawada M, You F, Yamada K, Tanaka Y, Egashira Y, Nakashima S, Yoshimura S, Iwama T. Comparison of mesenchymal stem cells from adipose tissue and bone marrow for ischemic stroke therapy. Cytotherapy. 2011; 13:675–685. DOI: 10.3109/14653249.2010.549122. PMID: 21231804.
crossref
4. Dulic V. Senescence regulation by mTOR. Methods Mol Biol. 2013; 965:15–35. DOI: 10.1007/978-1-62703-239-1_2. PMID: 23296649.
crossref
5. Hayflick L, Moorhead PS. The serial cultivation of human diploid cell strains. Exp Cell Res. 1961; 25:585–621. DOI: 10.1016/0014-4827(61)90192-6. PMID: 13905658.
crossref
6. Shay JW, Wright WE. Hayflick, his limit, and cellular ageing. Nat Rev Mol Cell Biol. 2000; 1:72–76. DOI: 10.1038/35036093.
crossref
7. Ramirez RD, Morales CP, Herbert BS, Rohde JM, Passons C, Shay JW, Wright WE. Putative telomere-independent mechanisms of replicative aging reflect inadequate growth conditions. Genes Dev. 2001; 15:398–403. DOI: 10.1101/gad.859201. PMID: 11230148. PMCID: 312628.
crossref
8. Rochette PJ, Brash DE. Human telomeres are hypersensitive to UV-induced DNA Damage and refractory to repair. PLoS Genet. 2010; 6:e1000926. DOI: 10.1371/journal.pgen.1000926. PMID: 20442874. PMCID: 2861706.
crossref
9. Yuan H, Kaneko T, Matsuo M. Relevance of oxidative stress to the limited replicative capacity of cultured human diploid cells: the limit of cumulative population doublings increases under low concentrations of oxygen and decreases in response to aminotriazole. Mech Ageing Dev. 1995; 81:159–168. DOI: 10.1016/0047-6374(95)01584-M. PMID: 8569280.
crossref
10. Roberson RS, Kussick SJ, Vallieres E, Chen SY, Wu DY. Escape from therapy-induced accelerated cellular senescence in p53-null lung cancer cells and in human lung cancers. Cancer Res. 2005; 65:2795–2803. DOI: 10.1158/0008-5472.CAN-04-1270. PMID: 15805280.
crossref
11. Munro J, Barr NI, Ireland H, Morrison V, Parkinson EK. Histone deacetylase inhibitors induce a senescence-like state in human cells by a p16-dependent mechanism that is independent of a mitotic clock. Exp Cell Res. 2004; 295:525–538. DOI: 10.1016/j.yexcr.2004.01.017. PMID: 15093749.
crossref
12. Serrano M, Lin AW, McCurrach ME, Beach D, Lowe SW. Oncogenic ras provokes premature cell senescence associated with accumulation of p53 and p16INK4a. Cell. 1997; 88:593–602. DOI: 10.1016/S0092-8674(00)81902-9. PMID: 9054499.
crossref
13. Izadpanah R, Trygg C, Patel B, Kriedt C, Dufour J, Gimble JM, Bunnell BA. Biologic properties of mesenchymal stem cells derived from bone marrow and adipose tissue. J Cell Biochem. 2006; 99:1285–1297. DOI: 10.1002/jcb.20904. PMID: 16795045. PMCID: 4048742.
crossref
14. Dimri GP, Lee X, Basile G, Acosta M, Scott G, Roskelley C, Medrano EE, Linskens M, Rubelj I, Pereira-Smith O, Peacocke M, Campisi J. A biomarker that identifies senescent human cells in culture and in aging skin in vivo. Proc Natl Acad Sci U S A. 1995; 92:9363–9367. DOI: 10.1073/pnas.92.20.9363. PMID: 7568133. PMCID: 40985.
crossref
15. Baxter MA, Wynn RF, Jowitt SN, Wraith JE, Fairbairn LJ, Bellantuono I. Study of telomere length reveals rapid aging of human marrow stromal cells following in vitro expansion. Stem Cells. 2004; 22:675–682. DOI: 10.1634/stemcells.22-5-675. PMID: 15342932.
crossref
16. Mao Z, Ke Z, Gorbunova V, Seluanov A. Replicatively senescent cells are arrested in G1 and G2 phases. Aging (Albany NY). 2012; 4:431–435. DOI: 10.18632/aging.100467.
crossref
17. Yu KR, Kang KS. Aging-related genes in mesenchymal stem cells: a mini-review. Gerontology. 2013; 59:557–563. DOI: 10.1159/000353857. PMID: 23970150.
crossref
18. Rufini A, Tucci P, Celardo I, Melino G. Senescence and aging: the critical roles of p53. Oncogene. 2013; 32:5129–5143. DOI: 10.1038/onc.2012.640. PMID: 23416979.
crossref
19. von Zglinicki T, Saretzki G, Ladhoff J, d’Adda di Fagagna F, Jackson SP. Human cell senescence as a DNA damage response. Mech Ageing Dev. 2005; 126:111–117. DOI: 10.1016/j.mad.2004.09.034.
crossref
20. Thomas DM, Yang HS, Alexander K, Hinds PW. Role of the retinoblastoma protein in differentiation and senescence. Cancer Biol Ther. 2003; 2:124–130. DOI: 10.4161/cbt.2.2.235. PMID: 12750549.
crossref
21. Qian Y, Chen X. Senescence regulation by the p53 protein family. Methods Mol Biol. 2013; 965:37–61. DOI: 10.1007/978-1-62703-239-1_3. PMID: 23296650. PMCID: 3784259.
crossref
22. Narita M, Nũnez S, Heard E, Narita M, Lin AW, Hearn SA, Spector DL, Hannon GJ, Lowe SW. Rb-mediated heterochromatin formation and silencing of E2F target genes during cellular senescence. Cell. 2003; 113:703–716. DOI: 10.1016/S0092-8674(03)00401-X. PMID: 12809602.
crossref
23. Ferbeyre G, de Stanchina E, Querido E, Baptiste N, Prives C, Lowe SW. PML is induced by oncogenic ras and promotes premature senescence. Genes Dev. 2000; 14:2015–2027. PMID: 10950866. PMCID: 316863.
crossref
24. Dhahbi JM, Atamna H, Boffelli D, Magis W, Spindler SR, Martin DI. Deep sequencing reveals novel microRNAs and regulation of microRNA expression during cell senescence. PLoS One. 2011; 6:e20509. DOI: 10.1371/journal.pone.0020509. PMID: 21637828. PMCID: 3102725.
crossref
25. Banas A, Teratani T, Yamamoto Y, Tokuhara M, Takeshita F, Osaki M, Kawamata M, Kato T, Okochi H, Ochiya T. IFATS collection: in vivo therapeutic potential of human adipose tissue mesenchymal stem cells after transplantation into mice with liver injury. Stem Cells. 2008; 26:2705–2712. DOI: 10.1634/stemcells.2008-0034. PMID: 18535155.
crossref
26. Cho YB, Lee WY, Park KJ, Kim M, Yoo HW, Yu CS. Autologous adipose tissue-derived stem cells for the treatment of Crohn’s fistula: a phase I clinical study. Cell Transplant. 2013; 22:279–285. DOI: 10.3727/096368912X656045.
crossref
27. Bogdanova A, Bērziņš U, Brūvere R, Eivazova G, Kozlovska T. Adipose-derived stem cells cultured in autologous serum maintain the characteristics of mesenchymal stem cells. Proc Latv Acad Sci, Sect B, Nat Exact Appl Sci. 2010; 64:106–113.
crossref
28. Digirolamo CM, Stokes D, Colter D, Phinney DG, Class R, Prockop DJ. Propagation and senescence of human marrow stromal cells in culture: a simple colony-forming assay identifies samples with the greatest potential to propagate and differentiate. Br J Haematol. 1999; 107:275–281. DOI: 10.1046/j.1365-2141.1999.01715.x. PMID: 10583212.
crossref
29. Salama R, Sadaie M, Hoare M, Narita M. Cellular senescence and its effector programs. Genes Dev. 2014; 28:99–114. DOI: 10.1101/gad.235184.113. PMID: 24449267. PMCID: 3909793.
crossref
30. Evans-Galea MV, Wielgosz MM, Hanawa H, Srivastava DK, Nienhuis AW. Suppression of clonal dominance in cultured human lymphoid cells by addition of the cHS4 insulator to a lentiviral vector. Mol Ther. 2007; 15:801–809. PMID: 17299406.
crossref
31. Crook JM, Stacey GN. Setting quality standards for stem cell banking, research and translation: the international stem cell banking initiative. Ilic D, editor. Stem cell banking. New York City, NY, USA: Humana Press Inc;2014. p. 5–7.
crossref
32. Lee CC, Christensen JE, Yoder MC, Tarantal AF. Clonal analysis and hierarchy of human bone marrow mesenchymal stem and progenitor cells. Exp Hematol. 2010; 38:46–54. DOI: 10.1016/j.exphem.2009.11.001. PMCID: 2807618.
crossref
33. Rada T, Reis RL, Gomes ME. Distinct stem cells sub-populations isolated from human adipose tissue exhibit different chondrogenic and osteogenic differentiation potential. Stem Cell Rev. 2011; 7:64–76. DOI: 10.1007/s12015-010-9147-0.
crossref
34. Cholewa D, Stiehl T, Schellenberg A, Bokermann G, Joussen S, Koch C, Walenda T, Pallua N, Marciniak-Czochra A, Suschek CV, Wagner W. Expansion of adipose mesenchymal stromal cells is affected by human platelet lysate and plating density. Cell Transplant. 2011; 20:1409–1422. DOI: 10.3727/096368910X557218. PMID: 21396157.
crossref
35. Winkler R, Perner B, Rapp A, Durm M, Cremer C, Greulich KO, Hausmann M. Labelling quality and chromosome morphology after low temperature FISH analysed by scanning far-field and near-field optical microscopy. J Microsc. 2003; 209:23–33. DOI: 10.1046/j.1365-2818.2003.01101.x. PMID: 12535181.
crossref
36. Baerlocher GM, Mak J, Tien T, Lansdorp PM. Telomere length measurement by fluorescence in situ hybridization and flow cytometry: tips and pitfalls. Cytometry. 2002; 47:89–99. DOI: 10.1002/cyto.10053. PMID: 11813198.
crossref
37. Noh HB, Ahn HJ, Lee WJ, Kwack KB, Kwon YD. The molecular signature of in vitro senescence in human mesenchymal stem cells. Genes Genomics. 2010; 32:87–93. DOI: 10.1007/s13258-010-0868-x.
crossref
38. Samsonraj RM, Raghunath M, Hui JH, Ling L, Nurcombe V, Cool SM. Telomere length analysis of human mesenchymal stem cells by quantitative PCR. Gene. 2013; 519:348–355. DOI: 10.1016/j.gene.2013.01.039. PMID: 23380569.
crossref
39. Bodnar AG, Ouellette M, Frolkis M, Holt SE, Chiu CP, Morin GB, Harley CB, Shay JW, Lichtsteiner S, Wright WE. Extension of life-span by introduction of telomerase into normal human cells. Science. 1998; 279:349–352. DOI: 10.1126/science.279.5349.349. PMID: 9454332.
crossref
40. Treff NR, Su J, Taylor D, Scott RT Jr. Telomere DNA deficiency is associated with development of human embryonic aneuploidy. PLoS Genet. 2011; 7:e1002161. DOI: 10.1371/journal.pgen.1002161. PMID: 21738493. PMCID: 3128107.
crossref

Fig. 1
Proliferation capacity and morphology of ADSCs during in vitro long-term cultivation. (A) Cumulative population doublings (PD). (B) ADSC proliferation curves showing population doubling time (PDT) at each passage. (C) ADSC morphology during long-term cultivation. Monolayer cells from early (upper-left) and late (upper-right) passage, and suspended cells from early (lower-left) and late (lower-right) passage are shown. (D) Clonogenicity potential of ADSCs. Upper panel –relative CFU test values; lower panel – an image of CFU test wells reflecting donor variance. OD: optical density.
ijsc-09-124f1.tif
Fig. 2
Bilineage potential of ADSCs. Shown is the comparison of early (P3) and late (P9) passage of two representative samples (CS-3 and CS-8) reflecting donor-specific differences. (A) Adipogenesis detected by Oil Red O staining of lipid inclusions. (B, C) Osteogenesis detected by (B) Alizarin Red S staining of extracellular calcium, and (C) alkaline phosphatase activity.
ijsc-09-124f2.tif
Fig. 3
Senescence-related changes of ADSC phenotype. (A) SA-β-gal expression was tested histochemically. Images were subjected to visual evaluation by two observers with regard to color intensity and percentage of stained cells per field of view. A typical view of increased SA-β-gal expression in ADSCs during long-term culture is shown (lower panel) with the respective visual evaluation data (upper panel) (B) ADSC metabolic activity determined by MTT assay. Optical density (OD) readings are expressed as mean of triplicate measurements. (C) Quantity of hydrogen peroxide in ADSCs. H2O2 standard curve is shown (left panel). H2O2 measurements of samples are expressed as mean of two replicates (right panel). AU: arbitrary units; P: passage. Error bars indicate standard deviation.
ijsc-09-124f3.tif
Fig. 4
Relative telomere length (RTL) of culture-expanded ADSCs and identification of cell subpopulations. (A) Flow FISH analysis of RTL dynamics during long-term culture. Each data point is expressed as mean±standard deviation of duplicate measurements. Continuous line represents mean RTL of five (P3–9), three (P11), and two (P13) samples. (B) The presence of two ADSC subpopulations (S and L) during RTL measurement was detected (upper panel). In contrast, only a single population of control Jurkat cells existed (lower panel, J). The S and L populations differed with respect to their RTL (C) and cell size (D) (data expressed as mean of all analyzed passages of five samples CS-1,2,3,6,8±standard deviation; *p<0.05, **p=0.001). AU: arbitrary units; P: passage.
ijsc-09-124f4.tif
Table 1
Summary of adipose-derived mesenchymal stem cell cultures used in the study
Culture code Donor age Donor sex Length of cryo-preservation, years Initial passage Last passage Cumulative PDs
CS-1 61 Male 3 P3 P11 20.46
CS-2 57 Female 2.5 P3 P9 17.46
CS-3 63 Male 2 P3 P13 23.28
CS-4 43 Male 2 P3 P5 8.03
CS-5 47 Male 1.5 P4 P7 8.29
CS-6 38 Female 3 P3 P8 14.69
CS-7 38 Male 2.5 P3 P6 10.19
CS-8 27 Female 3.5 P3 P14 28.97

P: passage; PDs: population doublings.

Table 2
Comparison of relative telomere length (RTL), quantitative ratio and cell size of cell subpopulations S and L as identified by Flow FISH in adipose-derived mesenchymal stem cell cultures
Sample RTL (AU) Quantitative ratio (%) Cell size (AU)


S L S L S L
CS-1
 P3 0.82±0.01 1.17±0.02 2.6±0.99 97.4±0.99 51.75±1.48 114.95±0.21
 P5 0.84±0.03 1.39±0.04 7.0±0.99 93.0±0.03 46.70±0.14 123.90±4.95
 P7 0.81±0.00 1.29±0.00 10.9±0.35 89.1±0.35 46.55±0.35 124.55±1.20
 P9 0.80±0.03 0.95±0.03 2.0±0.14 98.0±0.14 56.45±0.64 123.70±0.57
 P11 0.91±0.12 0.86±0.11 3.0±0.70 97.0±0.70 50.18±1.83 113.03±2.51
CS-2
 P3 0.96±0.02 1.21±0.02 2.1±0.21 97.9±0.21 58.62±0.07 113.55±0.07
 P5 0.79±0.18 1.27±0.29 6.3±0.42 93.7±0.42 49.50±0.42 128.4±2.26
 P7 0.40±0.00 1.10±0.00 7.3±0.78 92.7±0.78 46.88±0.95 103.07±1.27
 P9 0.62±0.03 1.18±0.05 18.3±2.04 81.7±2.04 52.04±0.54 162.35±2.61
CS-3
 P3 0.90±0.02 1.21±0.03 3.9±0.35 96.1±0.35 50.60±2.80 115.26±3.32
 P5 0.90±0.03 1.32±0.04 7.0±0.28 93.0±0.28 49.39±0.59 130.28±0.73
 P7 0.81±0.01 1.34±0.01 14.7±4.38 85.3±4.38 47.67±0.28 124.92±1.08
 P9 0.53±0.01 1.01±0.03 3.7±0.49 96.3±0.49 47.51±0.71 119.38±0.14
 P11 0.57±0.03 1.01±0.05 3.0±0.35 97.0±0.35 56.69±0.04 136.50±0.26
 P13 0.43±0.27 0.59±0.38 29.4±0.99 70.6±0.99 59.40±0.29 131.33±3.79
CS-6
 P3 0.93±0.02 1.36±0.03 2.7±0.21 97.3±0.21 46.88±0.79 109.16±0.50
 P5 1.07±0.00 1.63±0.00 4.3±0.92 95.7±0.92 47.91±0.73 124.96±0.56
 P7 1.01±0.01 1.32±0.01 5.5±0.35 94.5±0.35 47.80±0.74 120.36±1.97
 P8 0.91±0.13 1.55±0.22 6.0±0.92 94.0±0.92 52.18±1.57 138.02±0.46
CS-8
 P3 0.90±0.00 1.40±0.00 3.0±0.14 97.0±0.14 46.50±1.41 123.25±0.63
 P5 0.95±0.07 1.40±0.11 20.5±2.05 79.6±2.05 46.75±0.64 117.8±2.12
 P7 0.87±0.04 1.32±0.06 32.6±2.62 67.5±2.62 46.95±1.06 130.85±5.87
 P9 0.70±0.02 1.21±0.04 24.8±2.47 75.3±2.47 45.00±0.57 112.50±0.07
 P11 0.69±0.01 1.09±0.02 24.0±1.41 76.0±1.41 45.30±0.14 110.40±0.57
 P13 0.67±0.04 0.99±0.06 26.9±1.55 73.1±1.55 51.45±0.07 136.40±0.00
 P14 0.75±0.20 0.72±0.19 11.5±0.35 88.6±0.35 58.85±1.20 177.25±2.90

Data are expressed as means of duplicate measurements±standard deviation. AU: arbitrary units; P: passage.

TOOLS
Similar articles