

 PDF
PDF Citation
 Print
Print


Introduction
In recent biology research, quantification of mRNA using real-time reverse transcription PCR (qRT-PCR) is one of the most frequently used technologies to quantify relative gene expression (1). Based on the principle of polymerase chain reaction and fluorescent reporter system, the technology enables to quantify low abundance messenger RNA (mRNA). The method is reliable, affordable, and relatively easy to perform to investigate mRNA expressions at a particular time point, or in interested relevant cells or tissue types.
There are several methods to quantify and compare the gene expression (2). Most of these methods use housekeeping gene expressions as reference to obtain relative values of interested gene expressions. The strategy stands on the stability of reference gene expression. Selection of the appropriate reference gene is the key for accuracy of the relative value data. Commonly, housekeeping genes such as β-actin, 18S, or glyceraldehyde 3-phosphate dehydrogenase (GAPDH), are used as reference genes (3). In general cell biology, these genes are stable and may not be of concern as long as the same cell types are investigated. However, the selection of reference genes must be carefully addressed in stem cell biology. Most of the time, qRT-PCR technology is used to evaluate either stem cell specific gene expression or interested cell type or cell line-age specific gene expression. Unlike other primary cells or cell line cells, stem cells are unique for the plasticity in any aspect, including gene expressions. Along with the morphological changes, the cell structural gene (e.g. β-actin) expressions may be altered. The metabolic activity-related gene (e.g. GAPDH) expressions may also change during the differentiation. However, often times, the importance of selecting appropriate reference genes is undervalued.
In this present study, we investigated the effect of culture conditions on reference gene expressions in placenta-derived stem cells (4). Previously we have shown that human placenta contains stem cells, which express stem cell surface marker and stem cell specific marker genes, such as OCT4, NANOG (5). Under certain culture conditions these cells showed differentiation into all three germ layer cells (5–7). Based on the plasticity, naïve human amniotic epithelial cells, which contain the placenta-derived stem cells, are considered a suitable material to evaluate effects of minimal difference of culture conditions on the reference gene expression and the data interpretation.
Go to : 
Materials and Methods
Cell isolation and culture conditions
Human placentae were obtained with the approval of the University of Pittsburgh institutional review board (IRB), after uncomplicated elective caesarean deliveries from healthy mothers. Amniotic epithelial (AE) cells were enzymatically dissociated with 0.05% trypsin containing 0.53 mM EDTA-4Na as described previously (8). Viability of the AE cells was determined by exclusion of trypan blue dye and counted with a hemocytometer. Five million AE cells were plated on 100 mm diameter cell culture dishes in culture media with or without 10 ng/ml epidermal growth factor (EGF; PeproTech, Rocky Hill, NJ) for 7 days. The cell culture media was Dulbecco’s modified Eagle’s medium (DMEM) supplemented with 10% fetal bovine serum (FBS), 2 mM L-glutamine, 1% non-essential amino acid, 55 mM 2-mercaptoethanol, 1 mM sodium pyruvate, 1% antibiotic-antimycotic (All from Invitrogen/Gibco, Grand Island, NY).
RNA isolation and cDNA synthesis
Total RNA was isolated from the cell samples at day 0, and day 7 with or without EGF with an mRNA isolation kit (QIAGEN, Valencia, CA). The RNA concentration of each sample was fluorometrically measured (Qubit, Invitrogen). The integrity of RNA samples was further confirmed with the 28S/18S ratio (>1.0) on 1% agarose gel using Gel Logic 100 Imaging System (Kodak Molecular Imaging Systems, New Haven, CT). Two micrograms of total RNA were used to synthesize cDNA (Promega, Madison, WI). The reaction mixture was incubated at 42°C for 60 minutes, followed by heat inactivation of the enzyme at 95°C for 5 minutes. After cooling on ice for 5 minutes, the cDNA was stored at −20°C until analysis.
Quantitative real-time PCR
The TaqMan® Express Human Endogenous Control Plate (Applied Biosystems, Foster City, CA) that contains 32 genes in triplicate were used to evaluate commonly used reference genes (Table 1). The cDNA samples (5 ng) were subjected to quantitative real-time PCR (qPCR) using an ABI PRISM 7,000 (Applied Biosystems) according to the instructions provided by the manufacturer. As experimental target genes, three additional stem cell specific genes were chosen for analysis. The pre-designed TaqMan probe and primer sets for OCT4 (Hs03005111_g1), NANOG (Hs02387400_g1), and KLF4 (Hs00358836_m1), were selected from the library of TaqMan Gene Expression Assays (Applied Biosystems).
Table 1.
List of the tested reference genes
![]()
Statistical analysis
The relative variations of multiple reference genes were calculated by statistical algorithms using the geNorm software package (9). In the first analysis the software returns the internal control gene stability measure (M) for all candidate genes. Furthermore, the software plots two types of graphs. In one of these graphs it plots the average expression stability values of remaining reference genes during stepwise exclusion of the least stable reference gene. This process is repeated until two genes remain. In a second graph the minimal number of reference genes for normalization was determined. This determination is based on the stepwise inclusion of reference genes in the calculation of pairwise variation (V) of a normalization factor (NF). A large variation indicates the added gene has a significant effect and should be included.
The relative expression software tool (REST) was used to quantify mRNA expression of each target gene (10). The REST analysis provides statistical information suitable for comparing groups of treated versus untreated samples by using simple statistical randomization tests with the consideration of multiple reference genes. In this study, gene expression of the day 0 (starting point) samples were used as control group and the samples of EGF (+) and EGF (−) of day 7 samples were statistically compared. Detailed information and free downloading for these statistical software, geNorm and REST, are available at the following websites:
Go to :
Results
Statistical validation on 32 reference genes by geNorm
To identify the most stably expressed reference genes in samples from the starting point and two different culture conditions, the expression of a total of 32 genes (Table 1) was measured by quantitative RT-PCR. Data (Ct values) were further analyzed using the geNorm software. The first output showed that M values of all 32 genes were less than 1.5, which is considered as a cut-off value by the geNorm software to use a gene as reference. The average expression stability output showed that there were some reference genes that led to a great variation (Fig. 1A). The exclusion of genes like GUSB or EIF2B1 led to a dramatical decrease in the average. From this analysis resulted that the most unstable reference gene was GUSB (11) and the most stable genes were PPIA (12) and POLR2A (13). The optimal number of reference genes was assessed calculating the pairwise variation (V) between the normalization factor (NF) with a given number of reference genes and the NF value obtained after the inclusion of the following less stable genes (Fig. 1B). The V values were plotted to determine where the inclusion of the additional gene has little effect on the normalization. As seen in Figure 1B, the inclusion of the first three genes as opposed to two was 0.007. According to Vandesompele, et. al. (9), the suggested cut-off value was 0.15 and at least 3 genes must be used as reference. Therefore, in this experimental condition more than three genes were not necessary to perform the normalization. In this present study, we investigated the influence of three reference genes on the interpretation of expression data. It is important to note that the geNorm software determination (M<1.5) has to be considered as the initial screening. Further evaluation is necessary to confirm the valid reference genes.
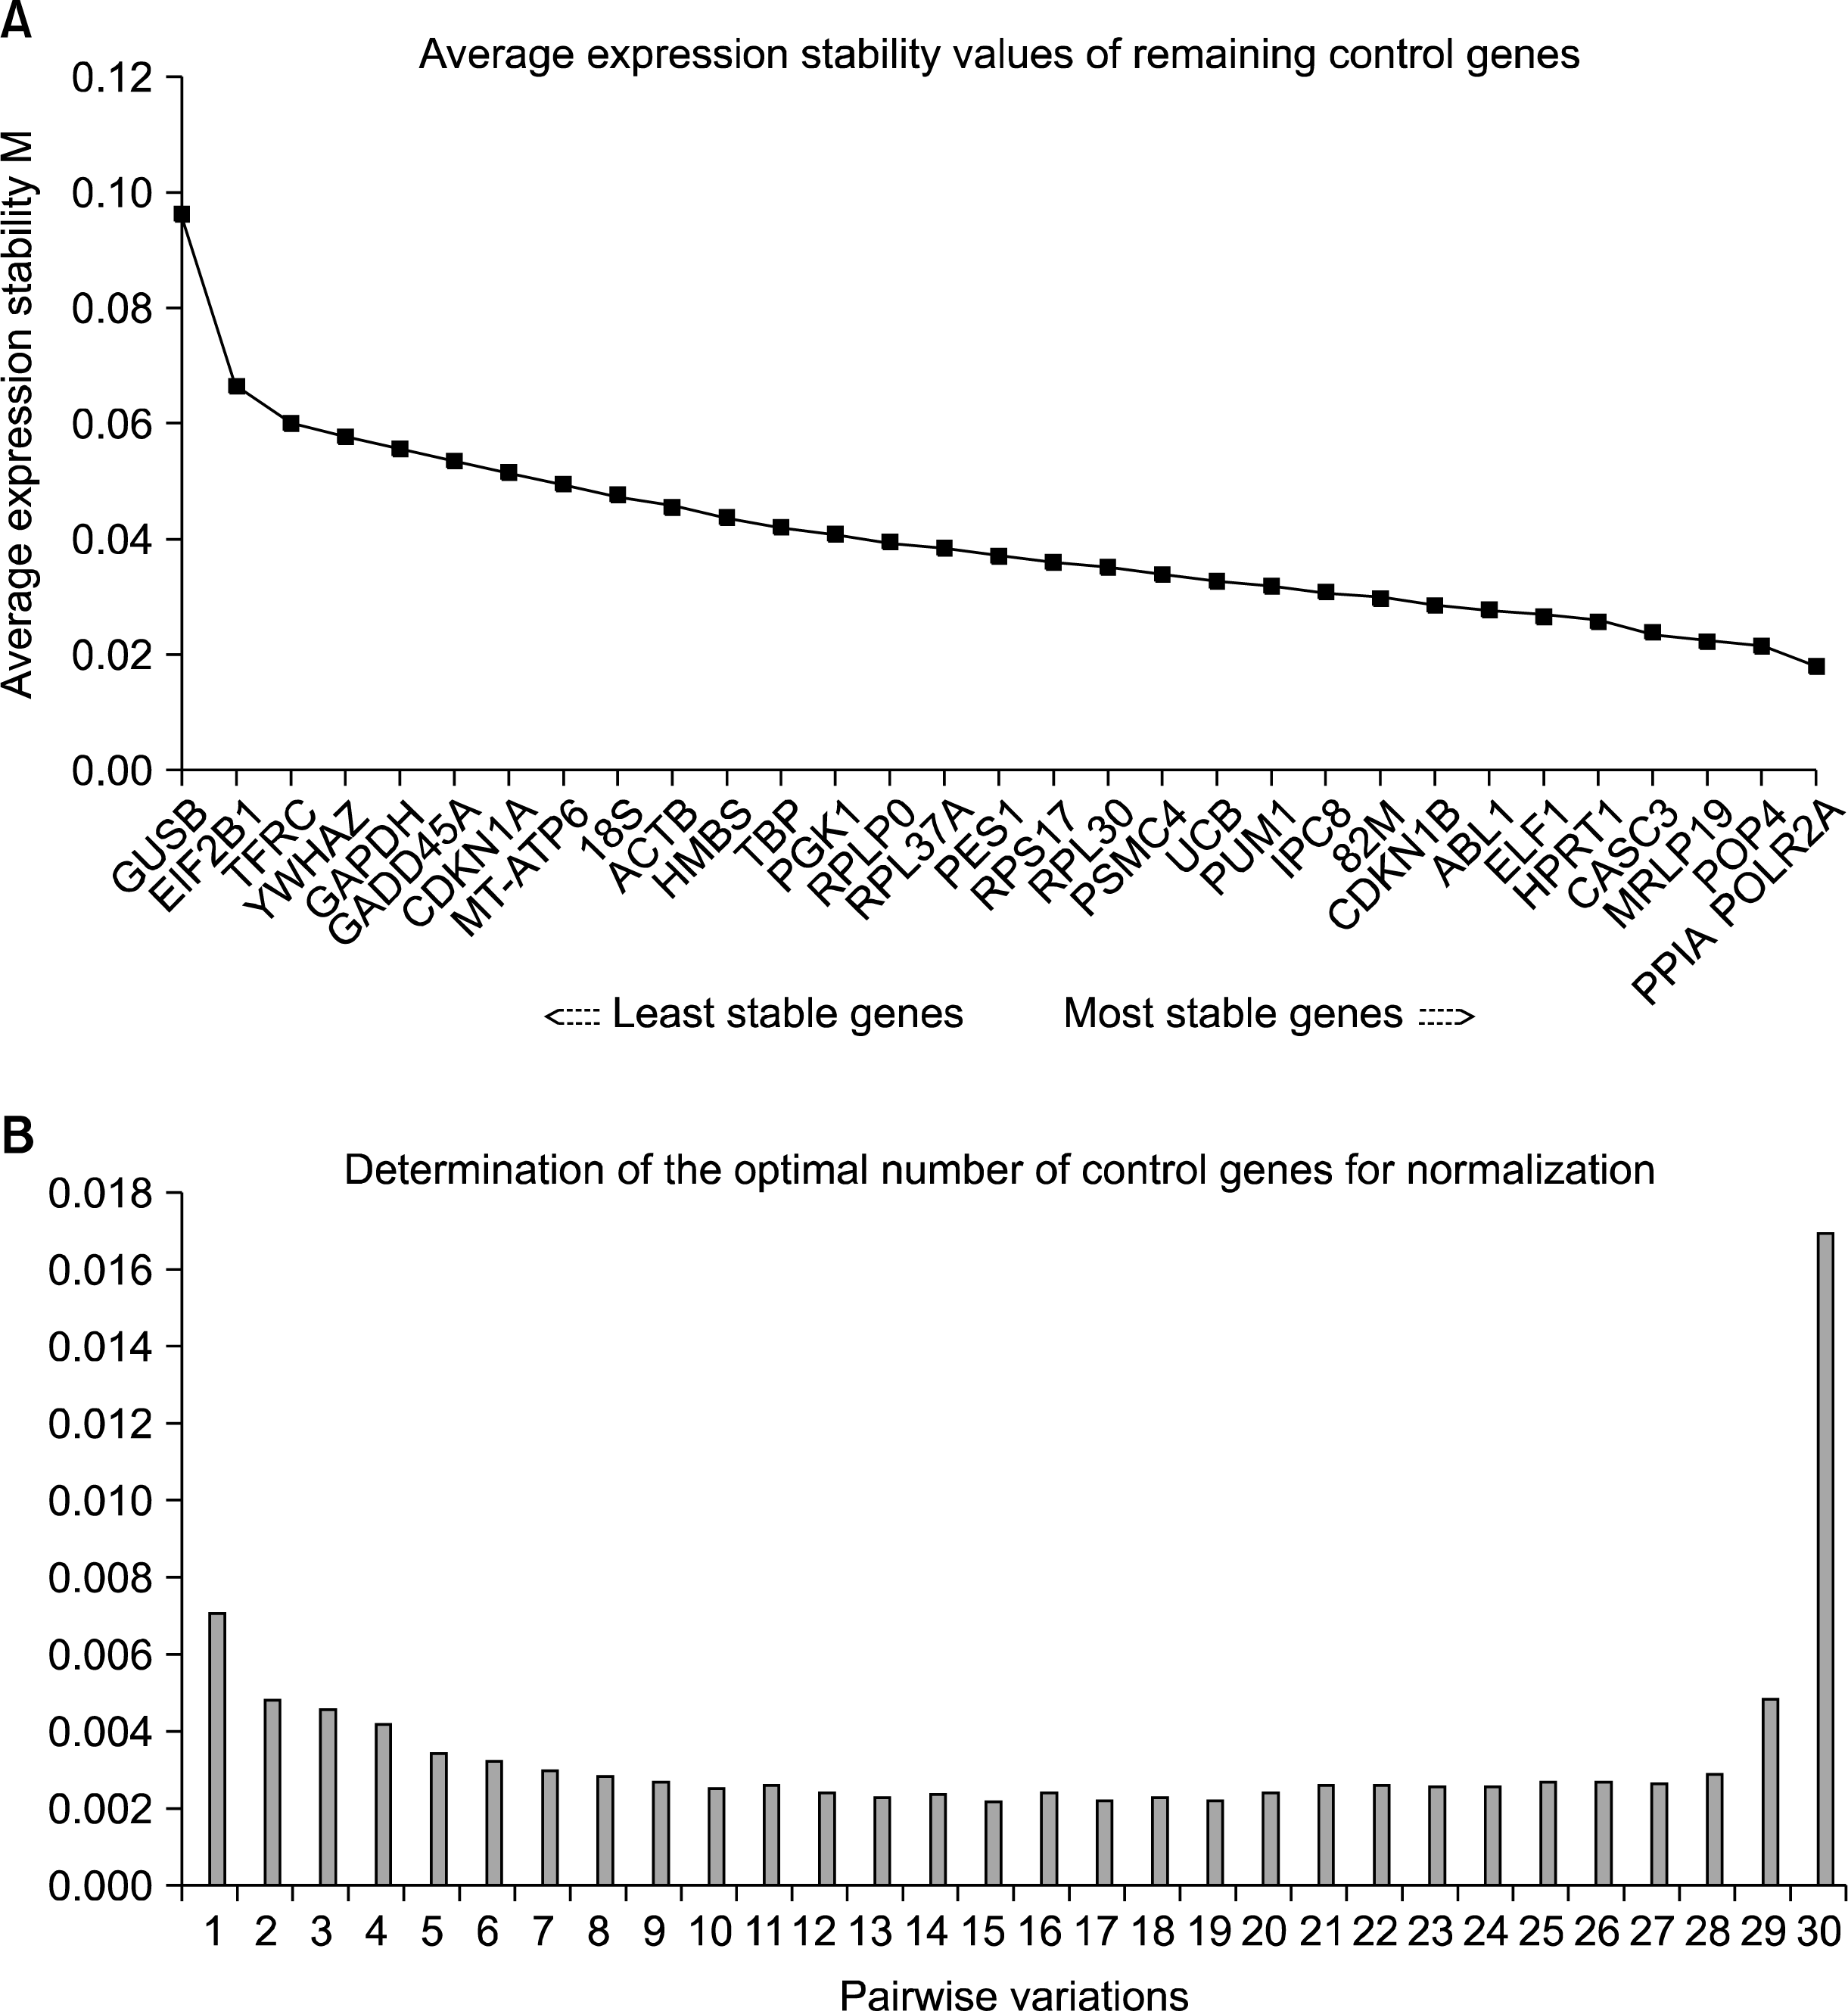 | Fig. 1.Determination of the best reference gene. (A) Average expression stability values (M) of remaining control genes during stepwise exclusion of the least stable control gene. All 32 genes are ranked in order of their expression stability. Lower M value of average expression stability indicates more stable expression. (B) Determination of optimal number of control genes for normalization. The graph reports the pairwise variation (Vn/n+1) of the normalization factors (NFs). The first value corresponds to V2/3.
|
The influence of reference gene selection on the interpretation of stem cell specific gene expression
Expression profiles of the three stem cell specific genes, OCT4, NANOG, and KLF4, were statistically analyzed to investigate the influence of reference gene selection. A total of 9 reference genes were selected and divided into the following three groups based on their expression stability; Group 1: most unstable reference genes, GUSB, EIF2B1, TFRC (Fig. 2A), Group 2: most stable reference genes, PPIA, POLR2A, POP4 (Fig. 2B), and Group 3: commonly used reference genes, GAPDH, 18S, β-actin (Fig. 2C). Each stem cell specific gene expression of EGF(+) and EGF(−) culture conditions was plotted as relative expression to the gene expression of the starting material (day 0). Although the profile of the graph looks similar, the statistical differences were completely different depending on the selection of the reference genes. With the most unstable reference gene, GUSB, the result indicates OCT4 expression was significantly increased in both culture conditions (Fig. 2A). However, when the considerably stable reference genes were used to analyze the data, the OCT4 expression was not significantly increased whereas the KLF4 expression was significantly decreased (Fig. 2B). The results based on the stable 3 reference genes were identical and the interpretation was confident. On the other hand, using some commonly used reference genes and less stable gene group, the statistical data analysis became variable and different from the data obtained with stable genes (Fig. 2A, 2C). When GAPDH and 18S were used as reference genes, the data indicates that OCT4 and KLF4 gene expressions were significantly changed. The significance of OCT4 gene expression in EGF treated groups was not detected when the most popular reference gene, β-actin, was used. The statistical results indicate that the selection of reference genes critically influences the gene expression analysis interpretation.
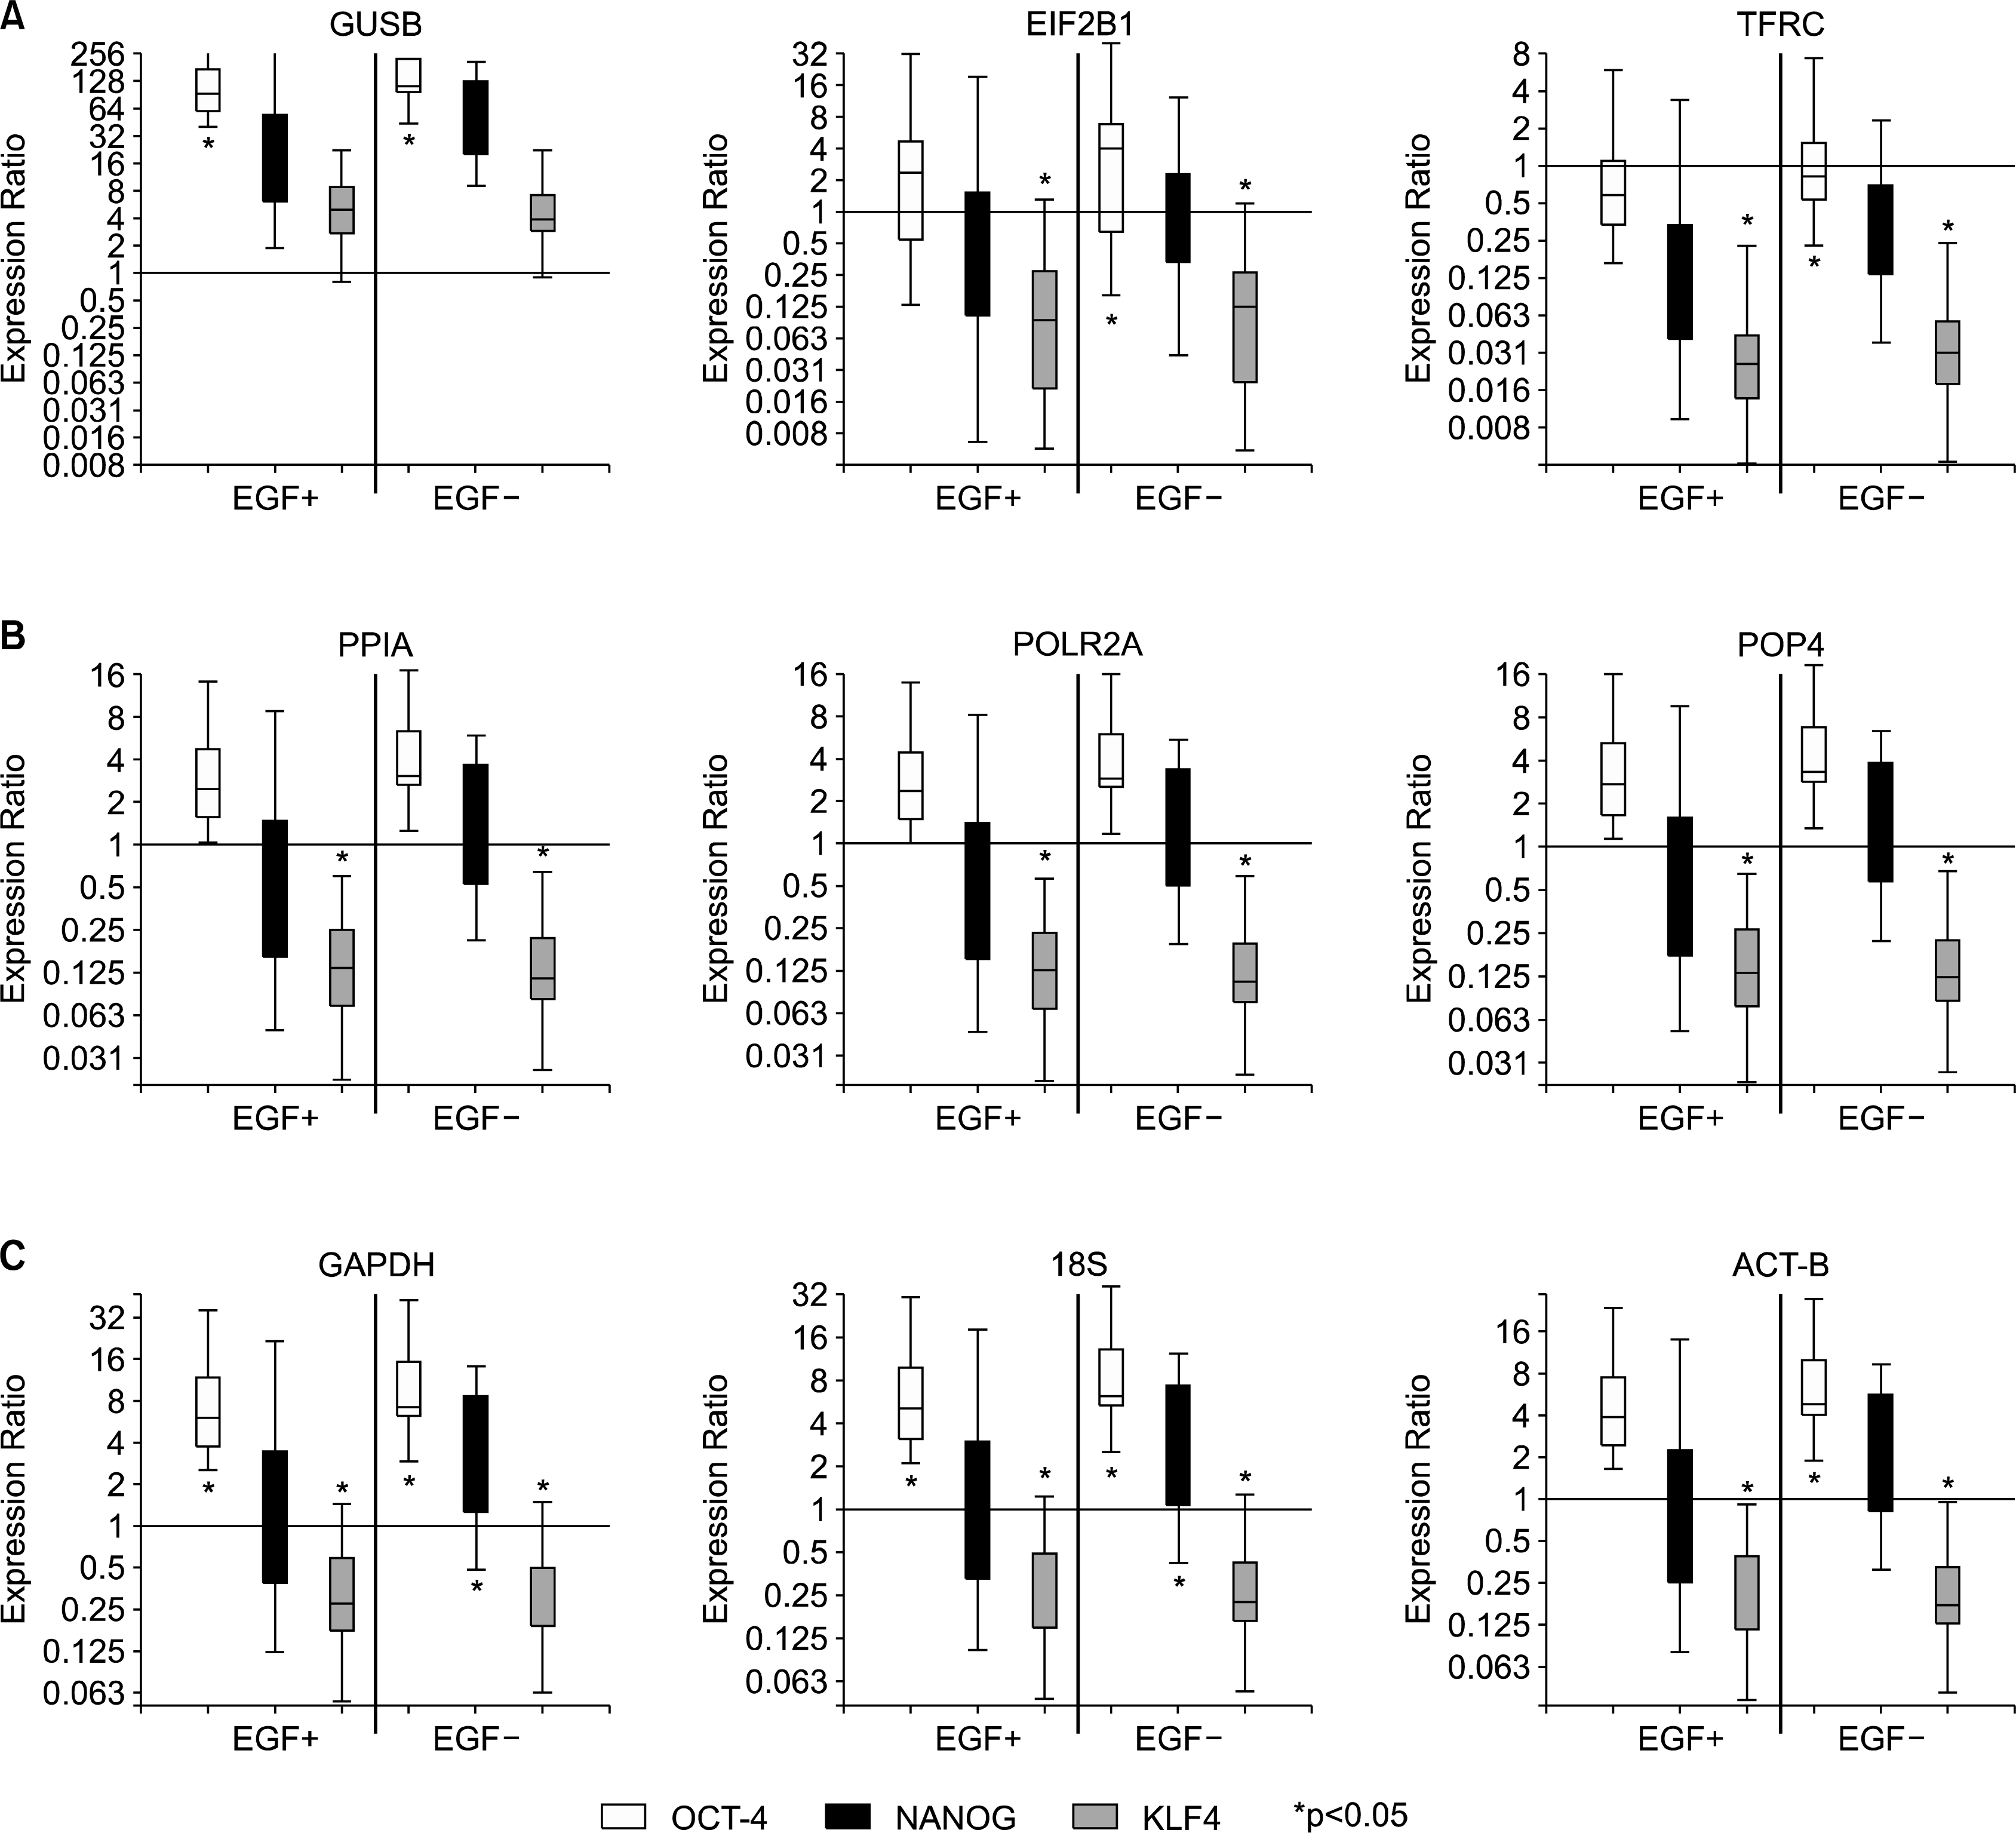 | Fig. 2.Influence of the reference gene on the data statistical interpretation. Graphs show the expression of OCT4, NANOG and KLF4 in the placenta-derived stem cells cultured with and without EGF relative to the starting material. Statistically significant up/down regulation is marked by an asterisk (p<0.05). Three groups of reference genes are shown: less stable genes group, more stable genes group based on the geNorm analysis (A and B, respectively) and the most commonly used genes group (C).
|
Go to :
Discussion
In the present study, 32 commonly used reference gene expressions were investigated in human placenta-derived stem cells. Freshly isolated human placenta-derived stem cells were cultured in two different conditions for 7 days. The gene expression was statistically analyzed using the gene expression value of day 0 as the control group. Although the difference of the culture condition was minimum and the culture period was relatively short, the reference gene expressions were varied. And the selection of the reference gene significantly influenced the interpretation of the target gene expression. Influence of the selection of reference genes on the normalization has been reported in several cell types (14) including other types of stem cells such as embryonic stem cells (15, 16) and adipose-derived stem cells (17) but not placenta-derived stem cells. Most of the reports concluded that multiple reference genes might overcome the problems. However, in the present study we demonstrated that random selection of commonly used reference genes not only misleads the data interpretation, but may also cause confusion.
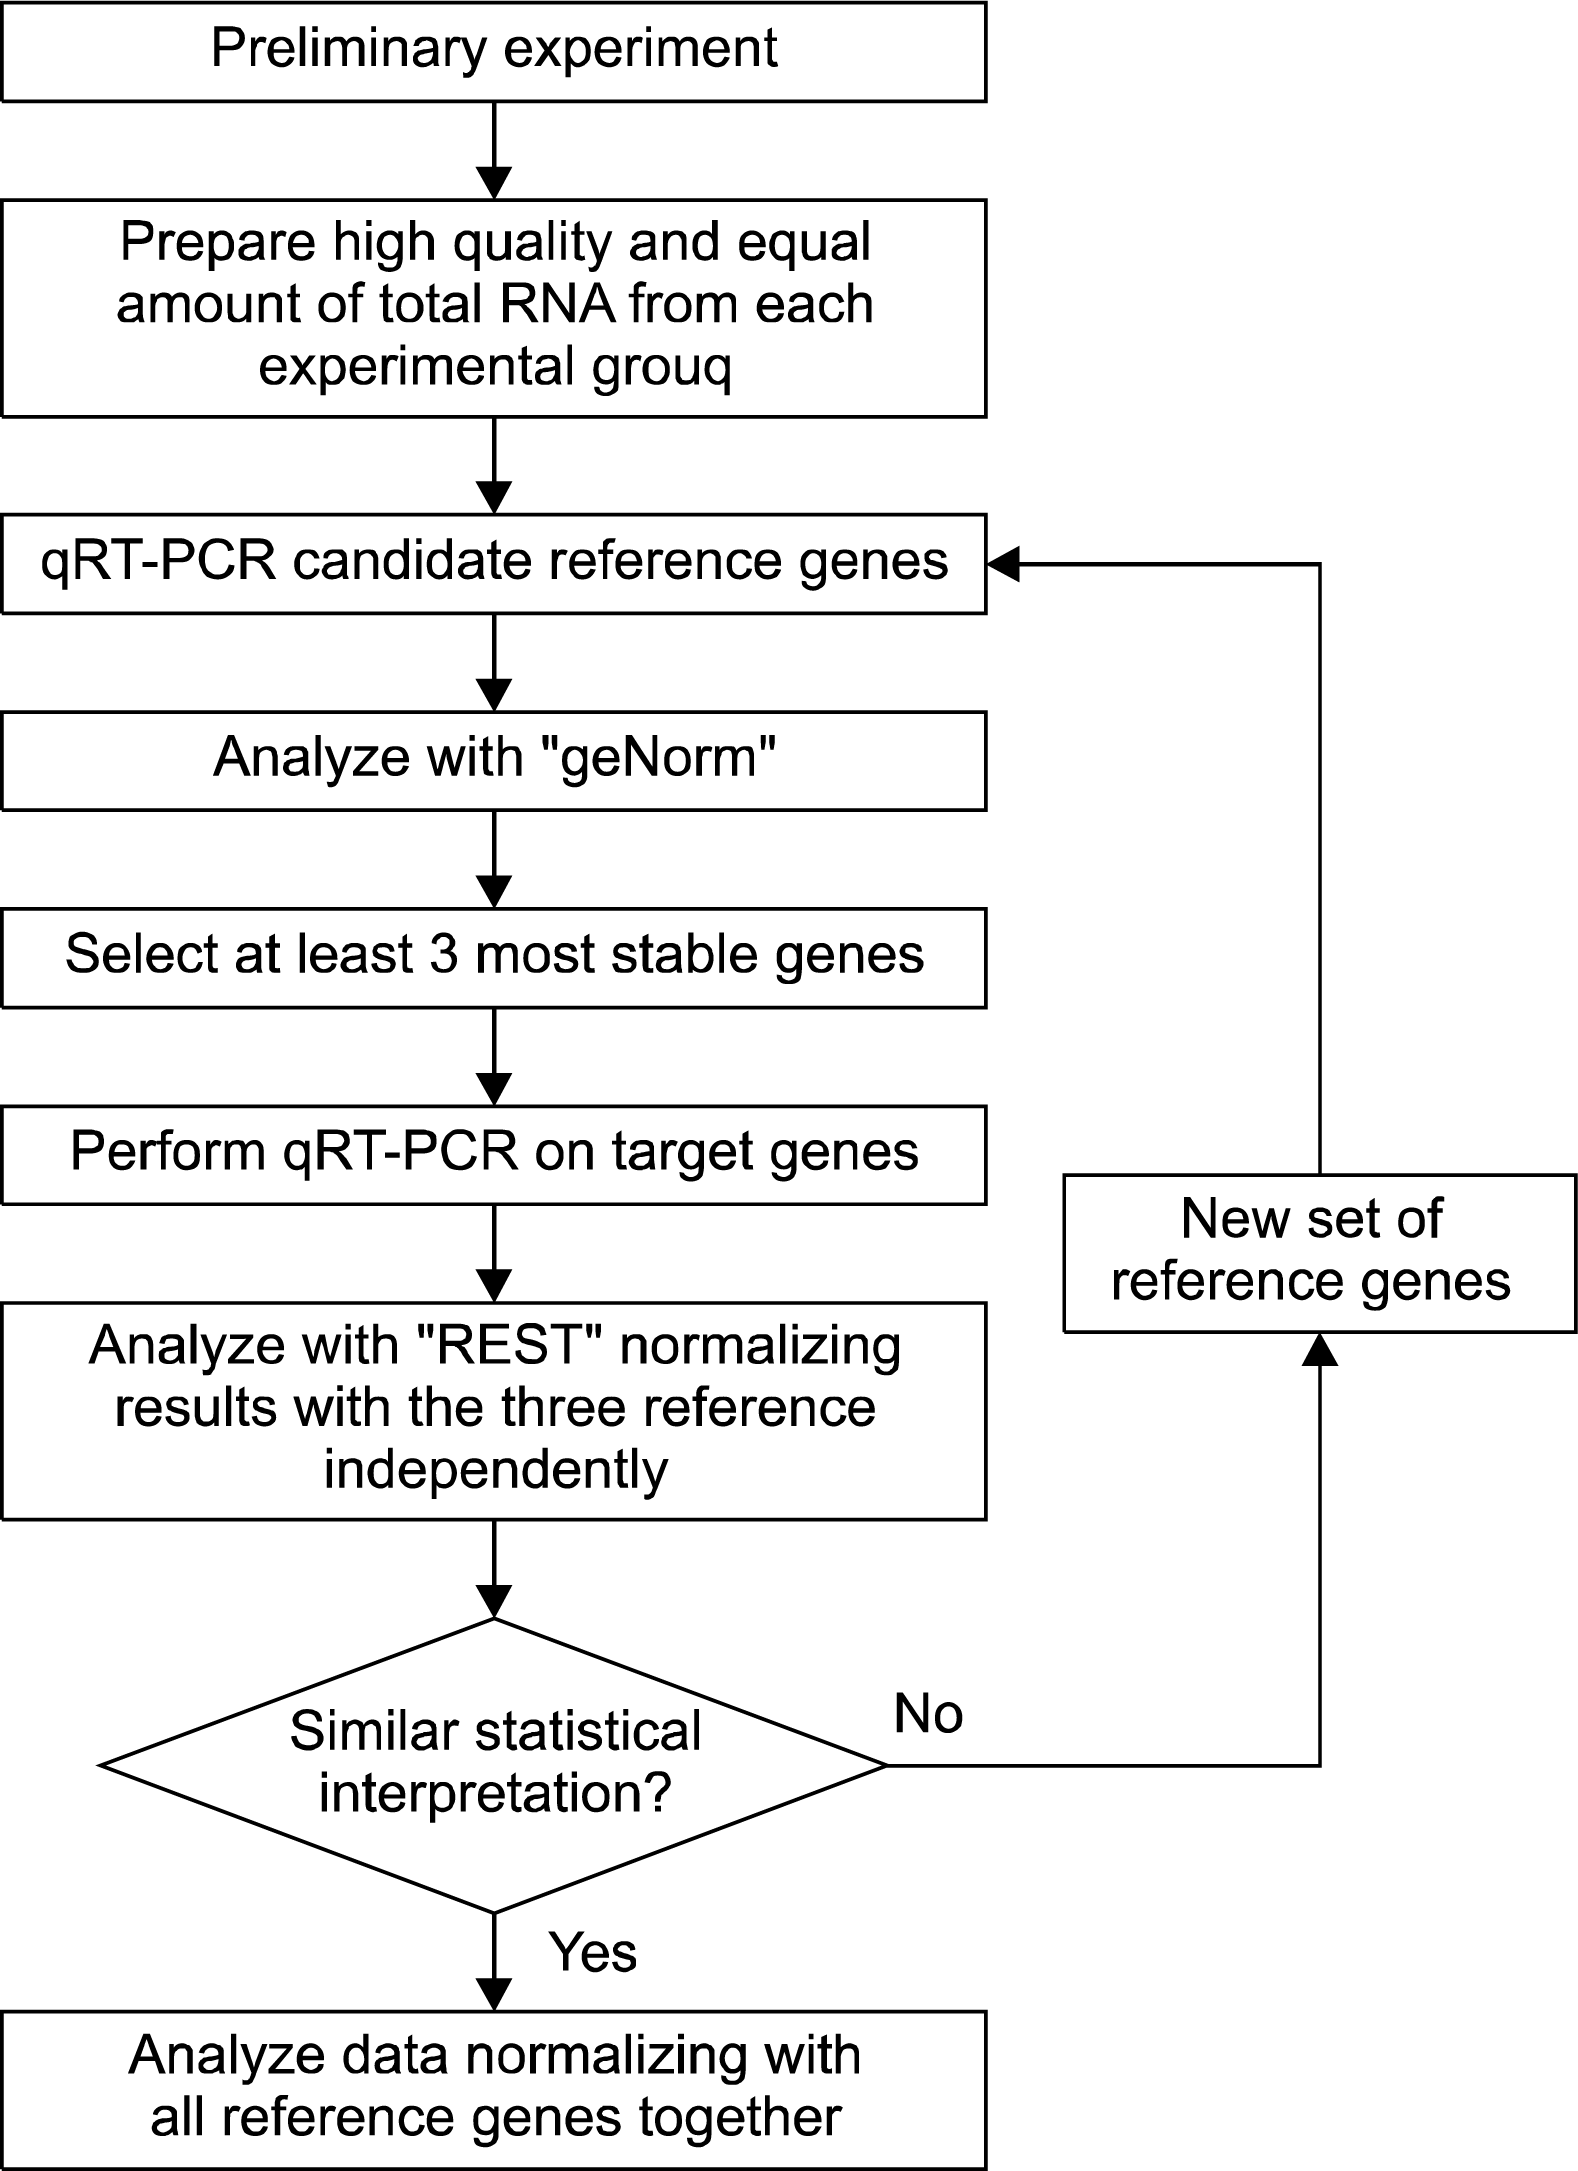
In consideration of the unique characteristics of stem cells, the selection of reference genes for expression analysis in stem cell research must be carefully performed. One of the strategical approaches is to identify valid reference genes by stepwise screening processes (Fig. 3). We recommend initial screening followed by multiple reference gene setup for each experiment with final confirmation. The selection of 12 reference genes will be sufficient for the initial screening of each experimental culture condition prior to the experimental analysis. For the initial screening, the samples must be prepared with all different experimental conditions in use. Using the geNorm software, the nature and optimal number of reference genes will be determined. In each experiment, the selected reference genes will be used to normalize the expression of the target genes using the REST software. We suggest performing a crosschecking independently calculating the relative expression of the target genes using one reference gene each time. The analysis should return the same statistical interpretation for each reference gene used. At this point it will be possible to re-calculate the expression data using all reference genes together, which will yield results as accurate as possible. Failing in crosschecking will require repeating the reference gene selection and expanding the starting gene set.
In conclusion, the identification of valid reference genes is critically important to investigate the gene expression in stem cell research. We propose a methodological approach that considers not only stable reference gene selection but also the influence of the selection on the statistical interpretation of the results.
Go to :
 XML Download