Journal List > Int J Stem Cells > v.2(1) > 1158877

Park, Kim, Bae, Son, Myung, Hong, and Kim: Cytokine Secretion Profiling of Human Mesenchymal Stem Cells by Antibody Array

Abstract

Mesenchymal stem cells (MSCs) provide not only cell sources for connective tissues but also the control of hematopoiesis and immune response. A multitude of cytokines and growth factors secreted from MSCs are known to confer such multifunctional functionality, but their overall spectrum and the respective expression strength have not been thoroughly illustrated. In this study, we have obtained the comprehensive cytokine secretion profile of human bone marrow (BM)-derived MSCs, with the use of an antibody array recognizing 120 cytokines and chemokines. The array membrane incubated with the secretion media of the cells featured a predominant hybridization signal for IL-6 and moderately elevated signals for IL-8, TIMP-2, MCP-1, VEGF and OPG. This cytokine secretion profile was found to be common to all cell lines from three different donors, and also similar but not identical to that of umbilical cord blood-derived cells, suggesting that the trophic nature of the MSCs might depend slightly on the cell origin but not on individuality of the donors. Our results here may provide the molecular basis for further studies on MSC-assisted biological processes, such as connective tissue homeostasis, hematopoiesis and immune modulation.

Introduction

Bone marrow (BM), as an ample adult stem cell source, contains at least three distinct stem cell species, namely, mesenchymal stem cells (MSCs), hematopoietic stem cells (HSCs) and multipotent adult progenitor cells (MAPCs) (1). Among them, MSCs have been most extensively investigated with respect to tissue engineering and cell therapy. Since they can be conveniently isolated from various human tissues, expanded in vivo to a great extent, and specifically induced to differentiate into cells of multiple line-ages, they are regarded as one of ideal sources for stem cell-based regenerative medicine (2).
Within BM, MSCs continuously proliferate and generate differentiated cells of a mesodermal lineage, such as osteoblasts, chondrocytes, adipocytes and myoblasts, thus serving as a bona-fide cell reservoir for connective tissues (3). Besides this tissue regenerative function, MSCs play a central role in a microenvironment or niche that controls the localization, self-renewal and differentiation of HSCs (47) and modulates the cellular functions of a variety of immune cells including, B and T lymphocytes, natural killer cells, monocytes and dendritic cells (813).
Presumably, the HSC niche is operated by a complex interplay of short- and long-range signaling that may entail a wide spectrum of molecular mediators, including soluble cytokines and growth factors, as well as diverse molecules on the plasma membrane and the extracellular matrix (ECM) (57). In the past year considerable efforts have been directed to identifying the key molecular players of the niche, leading to the findings that the physical contact of the HSCs with neighboring osteoblasts regulates the developmental stage and size of their niche (14, 15), and that such processes are mediated, alone or in combination, by a number of diverse signaling pathways, such as bone morphogenic protein (BMP) (15), Notch (16), Tie-2/Angiopoietin-1 (17) and Wnt pathways (18, 19). On the other hand, the result from a recent gene expression profiling study has indicated that the molecular context of the niche may be much more complex than originally anticipated (20).
In particular, MSCs embedded in the niche have been known to play crucial roles in the regulation and fine-tuning of the HSC development, primarily through a collective action of as-yet-unidentified soluble mediators (46). Of prime importance in understanding the niche at the molecular level is, therefore, to characterize the trophic nature of MSCs in a comprehensive manner. For this, a number of cytokine gene expression profiling studies of BM-derived MSCs have been performed (2125), but the compilation of the data has generated neither a consistent nor comprehensive expression profile. In this study, we attempted to determine a comprehensive cytokine secretion profile of MSCs with the use of a wide-spectrum human cytokine antibody array. This profile was then compared to DNA microarray-based gene expression data recently obtained using the same cell populations (26).

Materials and Methods

Cell culture of human MSCs

Human BM-derived MSC samples were purchased (Cambrex BioScience, Baltimore, MD), all of which exhibited an immunophenotype of CD105+ CD166+ CD29+ CD44+ CD14 CD34 CD45, and in vitro mesengenic differentiation potential. And full-term umbilical cord blood (UCB) sample was collected with mother’s consent and the protocol approved by internal review board of our institutions. Mononuclear cell (MNC) fraction was separated from UCB using Ficoll-Paque PLUS (Amersham Biosciences, Uppsala, Sweden) and MSCs were derived by continuous subculture. All these cells were further cultured as monolayers in culture media consisting of Low Glucose Dulbecco’s Modified Eagle Medium (LG-DMEM, Life Technologies, Gaithersburg, MD), 20% fetal bovine serum (FBS, RH Biosciences, Lenexa, KS), 2 mM L-glutamine, 1 mM sodium pyruvate, and 1% antibiotics/an-timycotics (Life Technologies, Gaithersburg, MD) comprising of 100 U/ml penicillin, 100μg/ml streptomycin, and 25μg/ml amphotericin B. The cells were detached with with 0.1% trypsin-EDTA when they reached their 60∼70% confluence and re-plated at a density of 2×10³/cm2 in Falcon culture flasks. For this study, the cells and culture media were collected at the early (3rd) passage, and total RNA was separately prepared from each cell sample using RNeasy Mini Isolation Kit (Qiagen, Valencia, CA).

Cytokine secretion profiling by cytokine antibody array

Human Cytokine Arrays VI and VII (Ray Biotech Inc, Norcross, GA) consisting of total 120 different cytokine and chemokine antibodies spotted in duplicate onto two membranes were used (Fig. 1A). Array membranes, each in separate wells of provided six-well plate, were incubated for 10 or 90 min in 2 ml of blocking buffer consisting of 10% bovine serum albumin in Tris buffered saline, further incubated for 10 min or 90 min in a shaker at room temperature with 2 ml of 4 or 20-fold diluted incubated or fresh culture medium. After the membranes were thoroughly washed, 2μl of biotin-conjugated antibodies at 1: 250-fold dilution was added to each membrane, and the mixture was incubated on a shaker for 10 or 90 min at room temperature. Following the wash, the membranes were incubated with a 1:40,000 dilution of streptavidin-conjugated peroxidase for 45 min at room temperature. Proteins were detected by enhanced chemiluminescence and signals were captured on X-ray films. The exposure time was varied from 1 min to 1 hr to optimize the signal-to-background ratio of the image. Arrays images were photographed and processed with Chemi Doc XRS (Bio-Rad Laboratories, Hercules, CA).

Semi-Quantification of cytokine antibody array data

Chemiluminescent cytokine array data were semi-quantified with Quantity One software (Bio-Rad Laboratories). The intensity of each cytokine spot was measured on the basis of gray-scale levels. For every spot, the net density gray level was determined by subtracting the average gray level of four negative controls from the measured density gray levels. The density gray level of six positive controls was used to normalize the results from different membranes. The density for each cytokine was then averaged over duplicated spot signals.

RT-PCR analysis

To confirm the cytokine secretion profile determined by antibody arrays, the gene expression levels for abundantly secreted cytokines were measured by RT-PCR, using total RNAs derived from three different MSC samples. Messenger RNA of β-actin served as an internal control. The sense and antisense primers used for each gene were as follows: IL-6, sense 5′-TAC CCC CAG GAG AAG ATT CC-3′ and antisense 5′-CAG GGG TGG TTA TTG CAT CT-3′; IL-8, sense 5′-TCT GCA GCT CTG TGT GAA GG-3′ and antisense 5′-TGA ATT CTC AGC CCT CTT CAA-3′; MCP-1, sense 5′-TCT GTG CCT GCT GCT CAT AG-3′ and antisense 5′-GAG TTT GGG TTT GCT TGT CC-3′; TIMP-2, sense 5′-GGA AGT GGA CTC TGG AAA CG-3′ and antisense 5′-GTC GAG AAA CTC CTG CTT GG-3′; VEGF, sense 5′-GGC AGA AGG AGG AGG GAC AGA ATC-3′ and antisense 5′-CAT TTA CAC GTC TGC GGA TCT TGT-3′; OPG, sense 5′-TCC TGG CAC CTA CCT AAA ACA GCA-3′ and antisense 5′-CTA CAC TCT CGG CAT TCA CTT TGG-3′;β-actin, sense 5′-AGA AAA TCT GGC ACC ACA CC-3′ and antisense 5′-CCA TCT CTT GCT CGA AGT CC. The thermocycler conditions were initial denaturation at 95°C for 5 minutes; 35 cycles of 95°C for 30 seconds, 57°C for 30 seconds, 72°C for 30 second; and finally 72°C for 7 minutes. The amplified PCR products were resolved in 1.5% agarose gel, stained with eithidium bromide, visualized and photographed with Chemi Doc XRS (Bio-Rad Laboratories).

Results

FBS contains numerous cytokines that are reactive to human antibodies

The cytokine antibody array incubated for 90 min with the 4-fold diluted culture medium as suggested in the manufacturer’s protocol yielded a number of spots whose intensities were significantly stronger than the back-ground level (Fig. 1B), indicating that FBS contains numerous soluble factors that could be cross-reactive to human antibodies. However, when the incubation time was reduced to 10 min with 20-fold diluted medium, the hybridization signals for most of these serum proteins were minimized to background (Fig. 1C). This hybridization condition was used for further cytokine secretion profiling studies of BM-derived MSCs.

The cytokine secretion profile of BM-derived MSCs is donor-independent

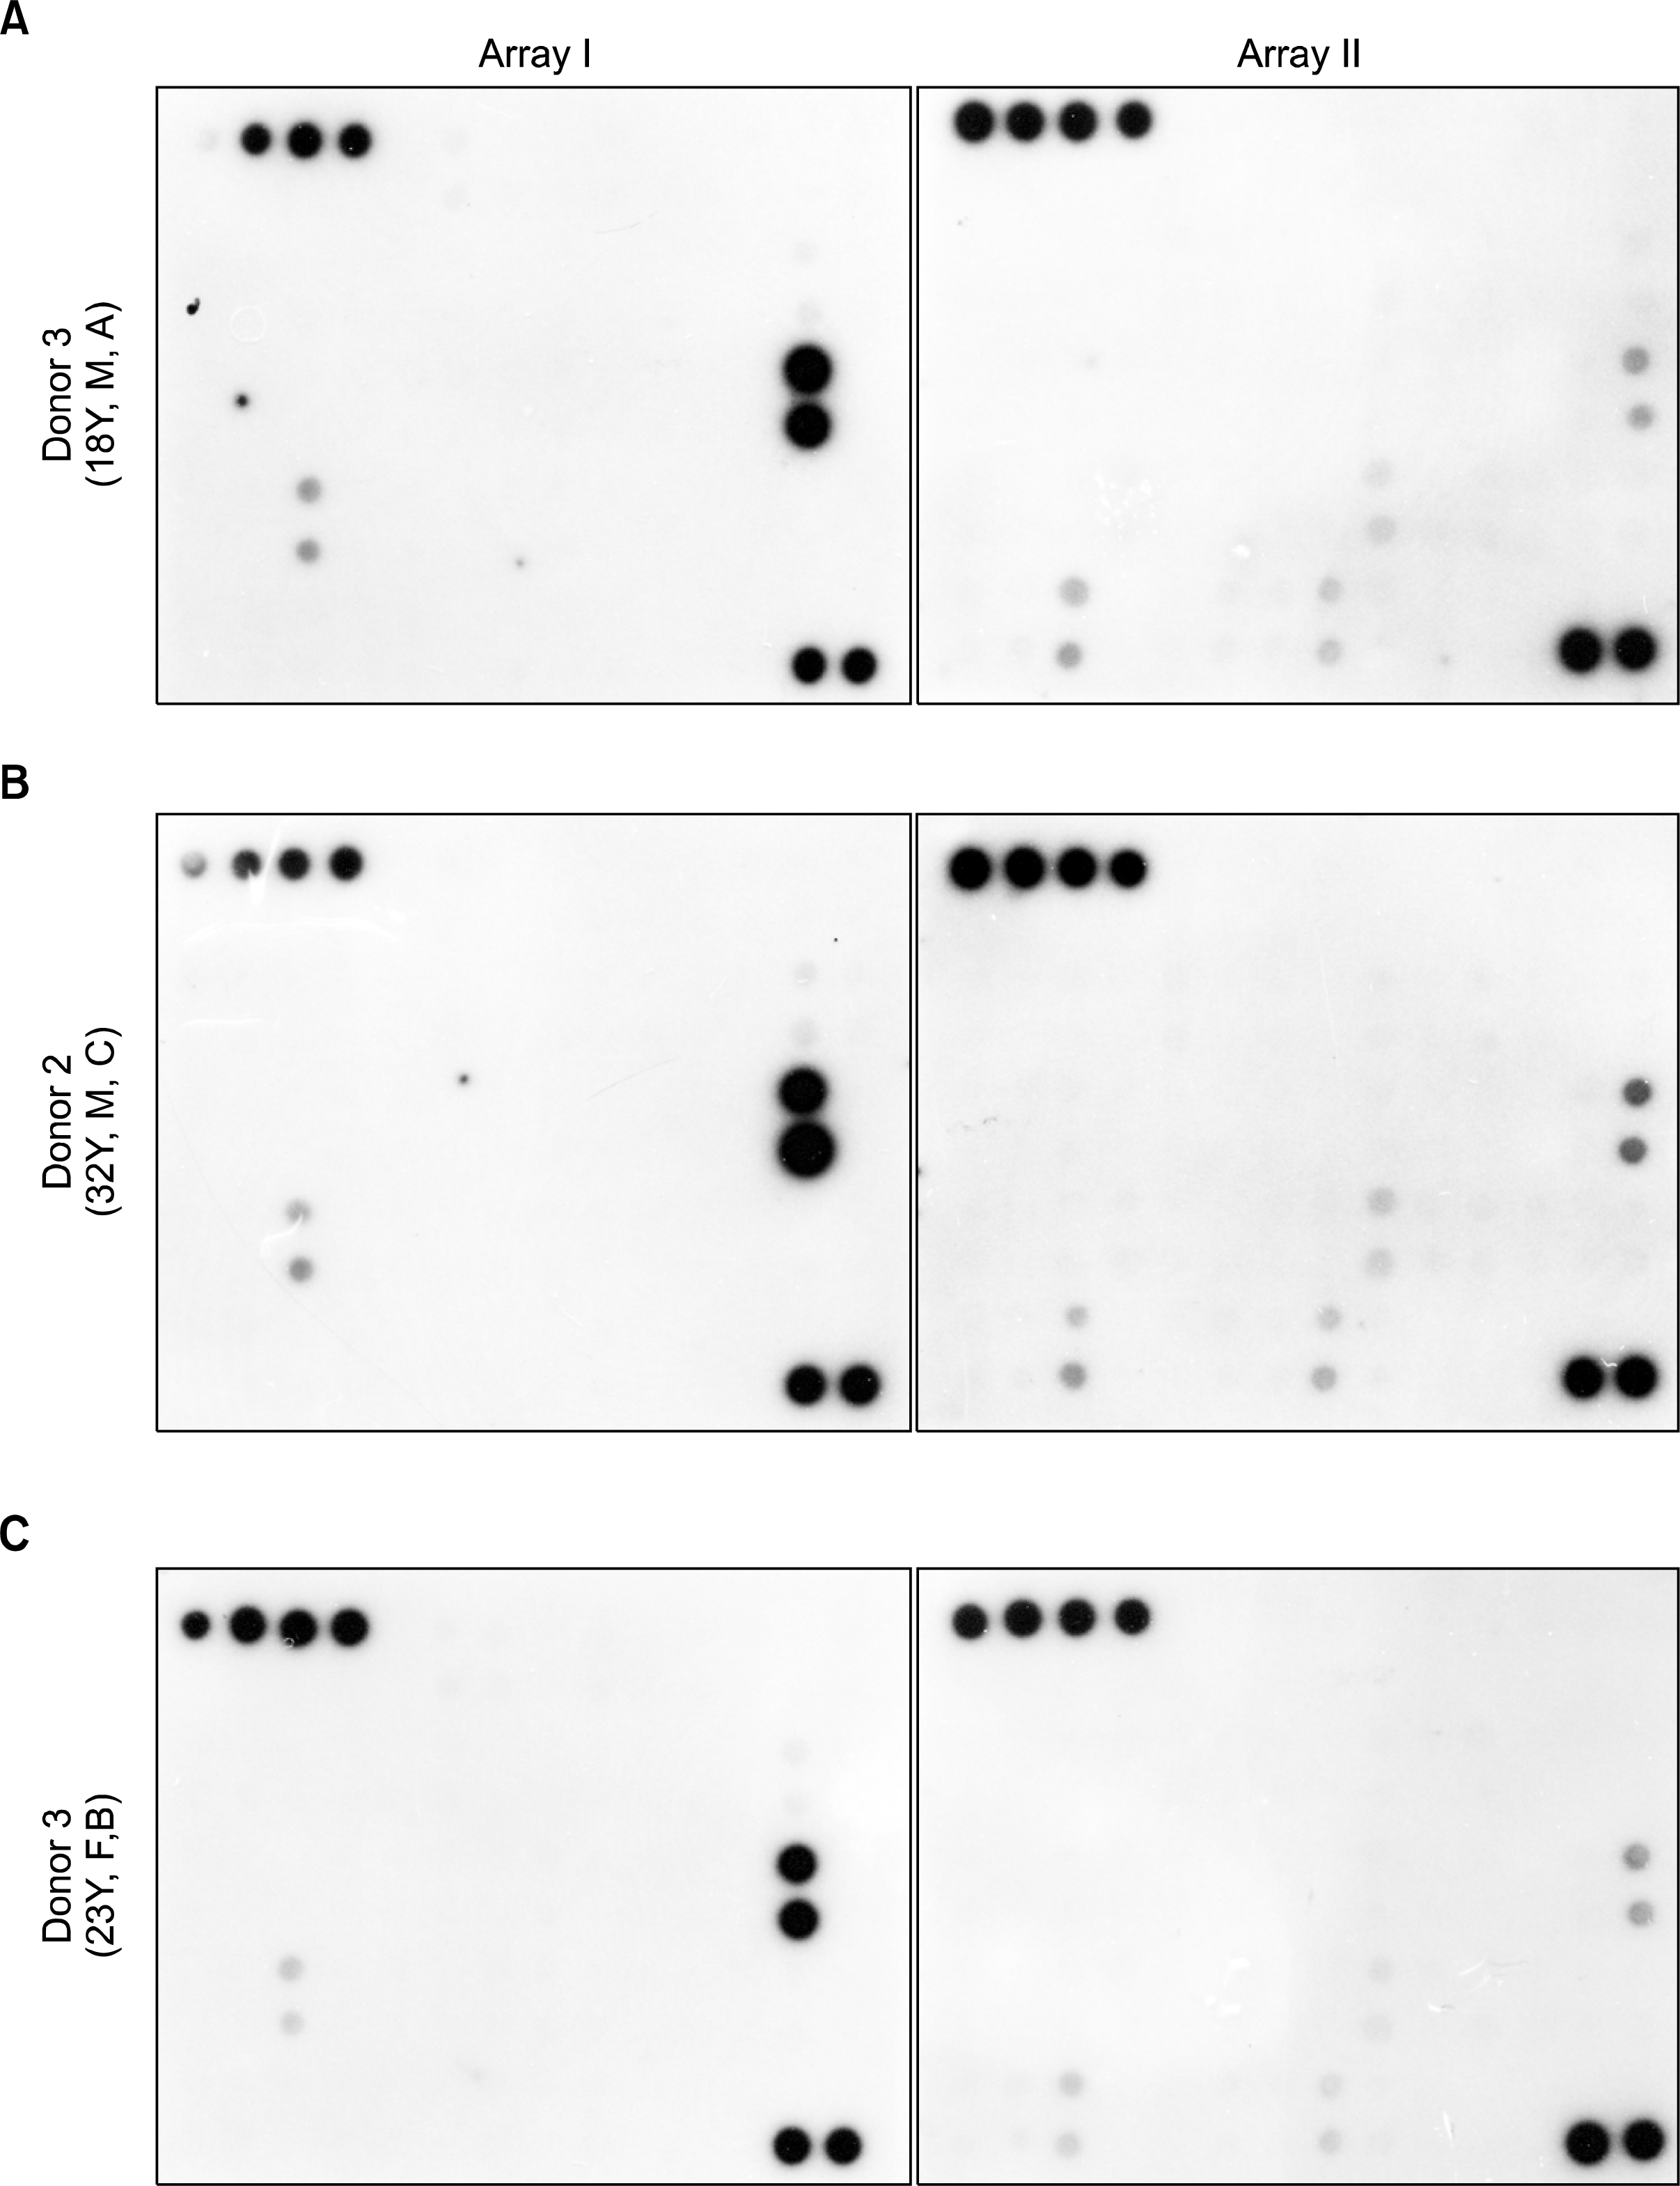
Next in order to investigate whether the cytokine secretion profile of BM-derived MSCs was dependent on individuality factors such as gender, race and age, we prepared MSC populations derived from three different donors of diverse genetic backgrounds. Since the transcriptomes of these populations were found to be highly similar to each other, with the correlation coefficients ranging from 0.943 to 0.972, it was expected that their variation in cytokine expression and secretion patterns if any would be minimal. As it turned out, the three MSC populations exhibited a common hybridization pattern on cytokine antibody arrays (Fig. 2), suggesting that the cytokine secretion profile of the cells might be donor-independent under the normal condition. This consistent cytokine secretion profile in MSCs was believed to be essential for performing their intrinsic functionalities.

Only few cytokines were secreted at a sufficiently high level from MSCs

As being common to three cell populations, the arrays featured a single predominant hybridization signal for IL-6, and moderate elevated signals for five cytokines, IL-8, TIMP-2, MCP-1, VEGF and OPG (Fig. 2). To facilitate further analyses, all spots in the arrays were semi-quantified and their net intensity values were obtained by subtracting the background intensity. The intensity for a specific cytokine was then computed by averaging over duplicated spots and the three membranes (Table 1). Among 120 cytokines implemented in the array, only six cytokines have the spot intensity above 50 while the intensity for a majority of other cytokines remained at the background level. This observation indicates that only a small subset of cytokines may be abundantly secreted from human BM-derived MSCs. It was worthwhile to note that a number of cytokines, previously known as MSC-related cytokines, such as MCSF, GM-CSF, G-CSF, LIF, IL-11, IL-7, TPO, SCF, HGF, SDF-1 and TGF-β were detected with no measurable intensity.

RT-PCR but not DNA microarray analysis confirms gene expressions for secreted cytokines

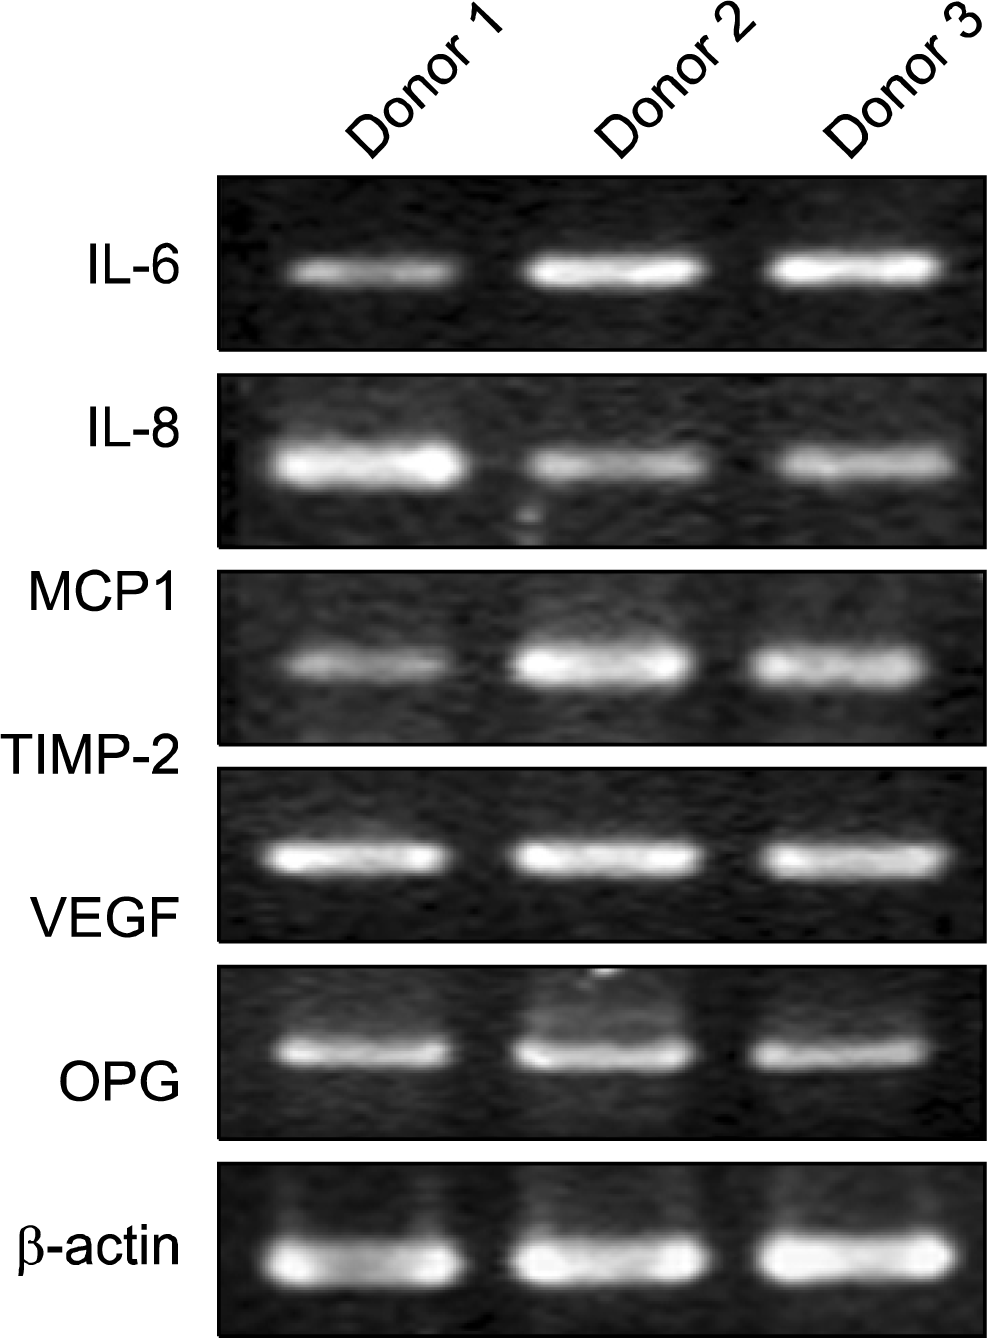
To validate the cytokine secretion profile at the transcriptional level, we analyzed gene expressions of highly secreted six cytokines by RT-PCR. The result showed that the cells from all three donors expressed the messenger RNAs of these cytokines at a similar and relatively high level (Fig. 3), indicating that these molecules might be consistently up-regulated at both the gene expression and protein synthesis/secretion levels. However, when all cytokines implemented in antibody arrays were compared to recent DNA microarray-based gene expression data (26), a poor agreement was yielded. Among above-mentioned six cytokines, only IL-6, TIMP2 and VEGF were found to have sufficiently high gene expression intensities, but the genes for the other three cytokines appeared to have minimal or negligible gene expression intensities. Moreover, a number of molecules that were higher in gene expression intensity, such as IGFBP4, IGFBP6, MIF and TIMP1, turned out to be secreted at the minimal level. This result indicated a poor agreement between the antibody array-generated secretion profile of the cytokines and DNA microarray-based gene expression data. This gene-to-protein disparity, however, appeared not to be unusual as reported elsewhere (27, 28). between the present secretion profile of cytokines and its gene expression profile.

Comparison of cytokine secretion profile between BM and UCB-derived MSCs

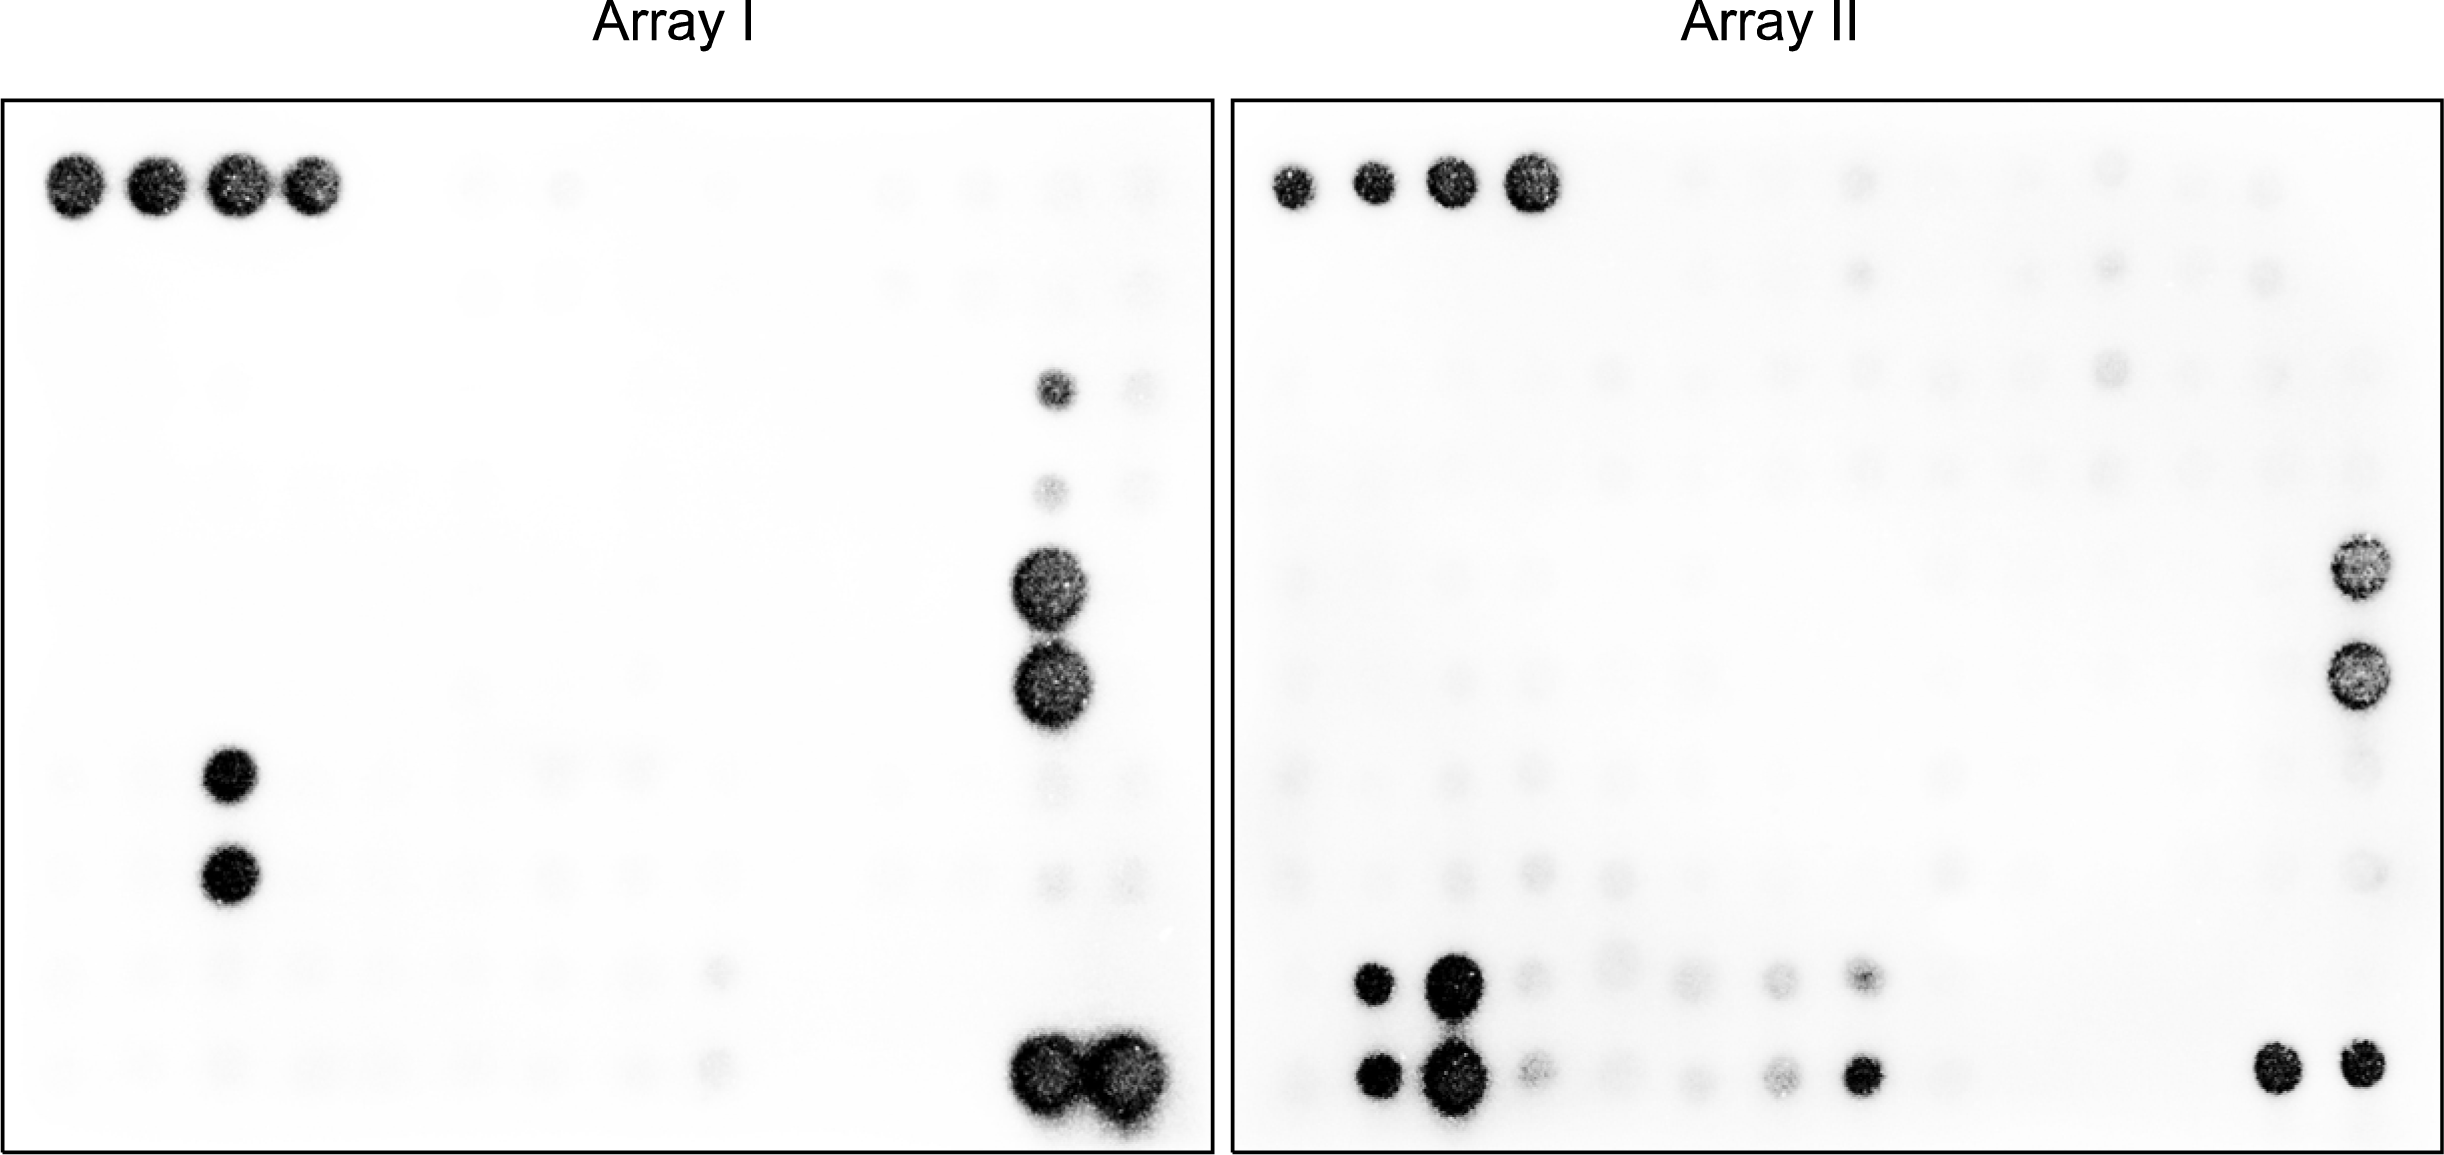
Finally, in order to investigate whether the current cytokine secretion profile could be generalized to all MSC populations from diverse cell sources, we derived a MSC population from a UCB sample and determined its cytokine secretion profile by the identical approach. The result indicated that the profile of UCB-derived MSCs shared a high similarity with that of BM-derived cells. However, a noticeable difference was found in the secretion level of IL-8 (Fig. 4), that appeared to be more up-regulated in the UCB-derived cells than in the adult counterpart. In addition, the UCB-derived MSCs, but not BM-derived cells, were found to secrete cytokines of the IGBP class cytokines slightly in a donor-dependent manner.

Discussion

Cytokines or growth factors are decision-makers of cell fates toward survival versus death and interaction versus protection, etc. Stem cells are no exception to this rule; it is now well established that the core stem cell properties, such as self-renewal, lineage-specific differentiation and tissue engraftment, are largely influenced by the local microenvironment (or niche) and soluble molecular signals. A multitude of cytokines and growth factors may form a complex cytokine network, which confers not only considerable stability and flexibility to the cells, but also rapid amplification of response against a particular stimulus. Thus, the disequilibrium of this network, usually caused by either progressive diseases or bacterial/viral infections, may distort the intrinsic biological functions of stem cells. The cytokine network is best studied in adult BM, in which a plethora of molecular mediators regulates the development of HSCs and also possibly other stem or progenitor cells. It has been long known that a variety of soluble molecules secreted from a neighboring MSC population largely contribute to this network, but their molecular constituents and respective roles have not been well delineated. Therefore, a characterization of the trophic nature of MSCs at the molecular level is regarded as an inevitable step for understanding of the complex cytokine network in BM.
In this study, we have attempted to determine the cytokine secretion profile of human BM-derived MSCs with using an antibody array that could analyze simultaneously protein expressions of up to 120 human cytokines. The overall spectrum of this array is broad enough to encompass most of MSC-secreted cytokines, such as M-CSF, GM-CSF, G-CSF, IL-6, IL-11, IL-7, TPO, SCF, FLT3L, HGF, IL-8, SDF-1, MCP-1, TGF-β, IGF-1, PDGF, and bFGF (5, 6). However, when the array membranes were shortly incubated with secretion media of the cells, the pronounced hybridization signals were only observed for six cytokines; IL-6, IL-8, MCP-1, TIMP-2, VEGF and OPG and the rest majority of cytokines were hybridized at zero or minimal level.
It was found that this cytokine secretion profile was highly conserved among BM-derived MSCs from donors of diverse race, age and sex. The conserved secretion pattern, together with the results from our genome-wide gene expression (26) and proteomic profiling studies (Jeong et al., unpublished results), suggested that the molecular resource of the cells would not be greatly influenced by the individuality factors of the donors. Furthermore, the profile was found to be similar, although not identical, to that of UCB-derived MSCs, reinforcing, together with high commonalities in cellular characteristics, differentiation potential and genetic resources, the idea that the two cell populations are the same cellular identity.
In both cases with BM and UCB-derived MSCs, a spot for IL-6 on the array membrane produced the strongest hybridization signal, indicating that IL-6 might be a cytokine secreted predominantly from the MSC population. This pleiotrophic factor were already known to be expressed in a constitutive and excessive manner for diverse biological functions, such as proliferation of HSCs and stromal cells, growth and differentiation of B and T lymphocytes, regulation of inflammatory responses, and many other functions related to bone and BM (29). IL-8 was also known as an MSC-secreted cytokine with mitogenic and angiogenic potential (30), but its higher secretion level in UCB-derived MSCs compared to BM-derived cells was not previously reported. UCB-derived cells requires a higher amount of IL-8, probably because the target cells in the neonatal tissue are less mature with respect to the integrity of the cell signaling system. Aside from the two interleukins, the preferential secretion of the rest four cytokines over others in MSCs has not been well documented. It was only recent to show that MCP-1, TIMP-2, and VEGF, but not OPG, would be secreted from UCB-derived cells in appreciable quantities (31), although the functional roles of these cytokines with respect to MSC’s intrinsic functionalities are not as yet known.
In summary, the trophic nature of human BM-derived MSCs was assessed by an antibody array. This wide-spectrum cytokine secretion profile would not only provide a valuable insight on MSC’s roles in hematopoietic support and immune modulation, but also facilitate future studies on molecular mechanisms underlying their core biological properties.

ACKNOWLEDGMENTS

This research was supported in part by a Korea Science and Engineering Foundation grant (M10641000037) funded by the Ministry of Science and Technology, and in part by the grant (SC-2140) from Stem Cell Research Center of the 21st Century Frontier Research Program, Republic of Korea.

Notes

Potential Conflict of Interest

The authors have no conflicting financial interest.

References

1. Herzog EL, Chai L, Krause DS. Plasticity of marrow-derived stem cells. Blood. 2003. 102:3483–3493.
crossref
2. Barry F, Murphy JM. Mesenchymal stem cells: clinical applications and biological characterization. Int J Biochem Cell Biol. 2004. 36:568–584.
crossref
3. Minguell JJ, Erices A, Conget P. Mesenchymal stem cells. Exp Biol Med. 2001. 226:507–520.
crossref
4. Dorshkind K. Regulation of hemopoiesis by bone marrow stromal cells and their products. Annu Rev Immunol. 1990. 8:111–137.
crossref
5. Charbord P. Stromal support of Hematopoiesis. Sell S, editor. Stem Cell Handbook. New Jersey: Humana Press;2004. 143–154.
crossref
6. Charbord P. Mediators involved in the control of hematopoiesis by the microenvironment. Zon L, editor. Hematopoiesis A developmental approach. New York: Oxford University Press;2001. 748–759.
7. Moore MAS. Cytokine and chemokine networks influencing stem cell proliferation, differentiation, and marrow homing. J Cell Biochem Suppl. 2002. 38:29–38.
crossref
8. Corcione A, Benvenuto F, Ferretti E, Giunti D, Cappiello V, Cazzanti F, Risso M, Gualandi F, Mancardi GL, Pistoia V, Uccelli A. Human mesenchymal stem cells modulate B-cell functions. Blood. 2006. 107:367–372.
crossref
9. Plumas J, Chaperot L, Richard MJ, Molens JP, Bensa JC, Favrot MC. Mesenchymal stem cells induce apoptosis of activated T cells. Leukemia. 2005. 19:1597–1604.
crossref
10. Sotiropoulou PA, Perez SA, Gritzapis AD, Baxevanis CN, Papamichail M. Interactions between human mesenchymal stem cells and natural killer cells. Stem Cells. 2006. 24:74–85.
crossref
11. Spaggiari GM, Capobianco A, Becchetti S, Mingari MC, Moretta L. Mesenchymal stem cell-natural killer cell interactions: evidence that activated NK cells are capable of killing MSCs, whereas MSCs can inhibit IL-2-induced NK-cell proliferation. Blood. 2006. 107:1484–1490.
crossref
12. Beyth S, Borovsky Z, Mevorach D, Liebergall M, Gazit Z, Aslan H, Galun E, Rachmilewitz J. Human mesenchymal stem cells alter antigen-presenting cell maturation and induce T-cell unresponsiveness. Blood. 2005. 105:4120–4126.
crossref
13. Jiang XX, Zhang Y, Liu B, Zhang SX, Wu Y, Yu XD, Mao N. Human mesenchymal stem cells inhibit differentiation and function of monocyte-derived dendritic cells. Blood. 2005. 105:4120–4126.
crossref
14. Zhang J, Niu C, Ye L, Huang H, He X, Tong WG, Ross J, Haug J, Johnson T, Feng JQ, Harris S, Wiedemann LM, Mishina Y, Linheng L. Identification of the haematopoietic stem cell niche and control of the niche size. Nature. 2003. 425:836–841.
crossref
15. Calvi LM, Adams GB, Weibrecht KW, Weber JM, Olson DP, Knight MC, Martin RP, Schipani E, Divieti P, Bringhurst FR, Milner LA, Kronenberg HM, Scadden DT. Osteoblastic cells regulate the haematopoietic stem cell niche. Nature. 2003. 425:841–846.
crossref
16. Karanu FN, Murdoch B, Gallacher L, Wu DM, Koremoto M, Sakano S, Bhatia M. The Notch ligand Jagged-1 represents a novel growth factor of human hematopoietic stem cells. J Exp Med. 2000. 192:1365–1372.
crossref
17. Arai F, Hira A, Ohmura M, Sato H, Matsuoka S, Takubo K, Ito K, Koh G, Suda T. Tie2/angiopoietin-1 signaling regulates hematopoietic stem cell quiescence in the bone marrow niche. Cell. 2004. 118:149–161.
crossref
18. Van Den Berg DJ, Sharma AK, Bruno E, Hoffman R. Role of members of the Wnt gene family in human hematopoiesis. Blood. 1998. 92:3189–3202.
crossref
19. Yamane T, Kunisada T, Tsukamoto H, Yamazaki H, Niwa H, Takada S, Hayashi SI. Wnt signaling regulates hemopoiesis through stromal cells. J Immunol. 2001. 167:765–772.
crossref
20. Hackney JA, Charbord P, Brunk BP, Stoeckert CJ, Lemischka IR, Moore KA. A molecular profile of a hematopoietic stem cell niche. Proc Natl Acad Sci. 2002. 99:13061–13066.
crossref
21. Majumdar MK, Thiede MA, Mosca JD, Moorman M, Gerson SL. Phenotypic and functional comparison of cultures of marrow-derived mesenchymal stem cells (MSCs) and stromal cells. J Cell Physiol. 1998. 176:57–66.
crossref
22. Majumdar MK, Thiede MA, Haynesworth SE, Bruder SP, Gerson SL. Human marrow-derived mesenchymal stem cells (MSCs) express hematopoietic cytokines and support long-term hematopoiesis when differentiated toward stromal and osteogenic lineages. J Hematother Stem Cell Res. 2000. 9:841–848.
crossref
23. Haynesworth SE, Baber MA, Caplan AI. Cytokine expression by human marrow-derived mesenchymal progenitor cells in vitro: effects of dexamethasone and IL-1 α. J Cell Physiol. 1998. 166:585–592.
crossref
24. Dormady SP, Bashayan O, Dougherty R, Zhang XM, Basch RS. Immortalized multipotential mesenchymal cells and the hematopoietic microenvironment. J Hematother Stem Cell Res. 2001. 10:125–140.
crossref
25. Kim DH, Yoo KH, Choi KS, Choi J, Choi SY, Yang SE, Yang YS, Im HJ, Kim KH, Jung HL, Sung KW, Koo HH. Gene expression profile of cytokine and growth factor during differentiation of bone marrow-derived mesenchymal stem cell. Cytokine. 2005. 31:119–126.
crossref
26. Jeong JA, Ko KM, Bae S, Jeon C-J, Koh GY, Kim H. Genome-wide differential gene expression profiling of human mesenchymal stem cells. Stem Cells. 2007. 25:994–1002.
27. Griffin TJ, Gygi SP, Ideker T, Rist B, Eng J, Hood L, Aeber-sold R. Complementary profiling of gene expression at the transcriptome and proteome levels in Saccharomyces cerevisiae. Mol Cell Proteomics. 2002. 1:323–333.
crossref
28. Lian Z, Wang L, Yamaga S, Bonds W, Beazer-Barclay Y, Kluger Y, Gerstein M, Newburger PE, Berliner N, Weissman SM. Genomic and proteomic analysis of the myeloid differentiation program. Blood. 2001. 98:513–524.
crossref
29. Haser SP, Kajkenova O, Lipschitz DA. The pivotal role of interleukin 6 in formation and function of hematopoietically active murine long-term bone marrow cultures. Stem Cells. 1997. 15:125–132.
crossref
30. Xie K. Interleukin-8 and human cancer biology. Cytokine Growth Factor Rev. 2001. 12:375–391.
crossref
31. Liu CH, Hwang SM. Cytokine interactions in mesenchymal stem cells from the cord blood. Cytokine. 2005. 32:270–279.
crossref

Fig. 1.
Control cytokine profiling of fresh culture medium. (A) Layout of antibody arrays and abbreviated names for 120 different cytokine probes. The full names of cytokines are indicated in Table 1. POS; positive control, BNK; blank, NEG; negative control. Membrane hybridization signals of (B) the antibody array incubated for 90 min with the 4-fold diluted culture medium and (C) the array incubated for 10 min with the 20-fold diluted medium. The latter hybridization condition was used for further cytokine secretion profiling studies of human MSCs.
ijsc-02-058f1.tif
Fig. 2.
Cytokine secretion profiles of human BM-derived MSCs. These profiles were obtained by incubating the array membrane with culture media of BM-derived MSCs from (A) 18-year-old Asian male, (B) 23-year-old Caucasian male, and (C) 23-year-old Black female.
ijsc-02-058f2.tif
Fig. 3.
RT-PCR analysis of cytokines abundantly secreted from BM-derived MSCs. Gene expressions of six most abundantly secreted cytokines were analyzed by RT-PCR, using total RNAs obtained from the same cell samples and β-actin as an internal control.
ijsc-02-058f3.tif
Fig. 4.
Cytokine secretion profile of an UCB-derived MSC population. Note that the spot intensity for IL-8 has much stronger in this cell compared to BM-derived cell populations.
ijsc-02-058f4.tif
Table 1.
A list of 120 cytokine probes implemented in the antibody array. Their respective full and systematic names are provided with the antibody array-generated spot intensities as well as DNA microarray-based gene expression intensity (26)
Name Full name (systematic name) NCBI gene accession number Ab array average intensity DNA microarray intensity (26)
ANG Angiogenin NM_001145 3.9 n/d
BDNF Brain-derived neurotrophic factor NM_170732 0.0 33.2
BLC B-lymphocyte chemoattractant (CXCL13) NM_006419 0.0 1.2
BMP4 Bone morphogenetic protein 4 NM_001202 0.0 2.6
BMP6 Bone morphogenetic protein 6 NM_001718 0.0 n/d
CKβb-1 Chemokine βb-1 (CCL23) NM_005064 0.0 1.0
CNTF Ciliary neurotrophic factor NM_000614 0.0 1.6
EGF Epidermal growth factor NM_001963 0.0 28.2
eotaxin Eotaxin 1 (CCL11) NM_002986 0.0 1.0
eotaxin2 Eotaxin 2 (CCL24) NM_002991 2.2 10.3
eotaxin3 Eotaxin 3 (CCL26) NM_006072 0.9 5.3
FGF6 Fibroblast growth factor 6 NM_020996 0.7 3.6
FGF7 Fibroblast growth factor 7 NM_002009 0.0 10.4
FLT3L Fms-related tyrosine kinase 3 ligand NM_001459 0.0 1.7
FKN Fractalkine (CX3CL1) NM_002996 0.8 2.9
GCP2 Granulocyte chemotactic protein 2 (CXCL6) NM_002993 0.0 1.0
GDNF Glial-derived neurotrophic factor NM_003976 0.7 4.3
GM-CSF Granulocyte-macrophage CSF NM_000758 0.4 1.0
I309 Small inducible cytokine I-309 (CCL1) NM_002981 0.5 1.0
IFN-γ Interferon γ NM_000619 0.0 1.0
IGFBP1 Insulin-like growth factor binding protein 1 NM_000596 0.0 4.4
IGFBP2 Insulin-like growth factor binding protein 2 NM_000597 20.0 15.1
IGFBP4 Insulin-like growth factor binding protein 4 NM_001552 0.0 291.1
IGF1 Insulin-like growth factor 1 NM_000618 5.8 1.6
IL10 Interleukin 10 NM_000572 3.9 1.0
IL13 Interleukin 13 NM_002188 1.6 1.0
IL15 Interleukin 15 NM_000585 0.6 2.3
IL16 Interleukin 16 NM_004513 0.2 1.2
IL1α Interleukin 1α NM_000575 2.5 1.0
IL1β Interleukin 1β NM_000576 3.3 1.2
IL1ra Interleukin 1 receptor antagonist NM_000577 6.4 1.9
IL2 Interleukin 2 NM_000586 3.2 1.0
IL3 Interleukin 3 NM_000588 4.4 1.0
IL4 Interleukin 4 NM_000589 6.1 4.7
IL5 Interleukin 5 NM_000879 6.2 1.0
IL6 Interleukin 6 NM_000600 213.9 20.8
IL7 Interleukin 7 NM_000880 0.0 1.1
Leptin Leptin NM_000230 7.3 1.3
LIGHT Lymophotoxin-like HVEM ligand NM_003807 8.8 1.0
MCP1 Monocyte chemoattractant protein 1 (CCL2) NM_002982 80.6 2.7
MCP2 Monocyte chemoattractant protein 2 (CCL8) NM_005623 5.7 1.0
MCP3 Monocyte chemoattractant protein 3 (CCL7) NM_006273 3.1 1.4
MCP4 Monocyte chemoattractant protein 4 (CCL13) NM_005408 2.2 1.0
MCSF Macrophage colony stimulating factor 1 NM_000757 3.6 1.0
MDC Macrophage-derived chemokine (CCL22) NM_002990 4.0 63.2
MIG Monokine induced by interferon (CXCL9) NM_002416 0.5 1.0
MIP1d Macrophage inflammatory protein 1d (CCL15) NM_032964 0.2 1.0
MIP3a Macrophage inflammatory protein 3a (CCL20) NM_004591 1.8 1.0
NAP2 Neutrophil activating peptide 2 (CXCL7) NM_002704 3.0 1.0
NT3 Neurotrophin 3 NM_002527 2.8 4.2
PARC Pulmonary & activation-regulated (CCL18) NM_002988 0.0 3.9
PDGF-BB Platelet-derived growth factor polypeptide NM_033016 6.5 1.3
RANTES RNATES (CCL5) NM_002985 10.6 2.4
SCF Stem cell growth factor NM_002975 9.3 7.7
SDF1 Stromal cell-derived factor 1 (CXCL12) NM_000609 8.9 16.3
TARC Thymus & activation-regulated (CCL17) NM_002987 5.3 1.0
TGFb1 Transforming growth factor b1 NM_000660 3.5 16.4
TGFb3 Transforming growth factor b3 NM_003239 4.8 1.0
TNF-a Tumor necrosis factor a NM_000594 0.7 7.5
TNF-b Tumor necrosis factor b NM_000595 0.6 1.5
Acrp30 Adiponectin precursor NM_004797 0.0 n/d
AgRP Agouti related protein NM_001138 0.0 1.0
ANG2 Angiopoietin 2 NM_001147 3.2 1.0
AR Amphiregulin NM_001657 7.6 1.0
AXL AXL receptor tyrosine kinase NM_021913 10.9 12.0
bFGF Fibroblast growth factor 2 NM_002006 10.5 12.3
b-NGF Basic nerve growth factor NM_002506 13.9 5.8
BTC Betacellulin NM_001729 16.7 1.7
CCL-28 Chemokine (C-C motif) ligand 28 NM_019846 17.0 2.4
CTACK Cutaneous T-cell attracting (CCL27) NM_006664 0.0 1.0
DTK Developmental tyrosine kinase NM_006293 0.0 7.1
EGFR Epidermal growth factor receptor NM_005228 0.0 3.1
ENA78 Epithelial neutrophil-activating protein NM_002994 0.0 n/d
FAS Fas antigen NM_000043 1.7 16.8
FGF4 Fibroblast growth factor 4 NM_002007 0.0 1.0
FGF9 Fibroblast growth factor 9 NM_002010 4.5 1.0
GCSF Granulocyte colony stimulating factor NM_000759 3.6 16.2
GITR-light Glucocorticoid-induced TNFR ligand NM_005092 12.6 n/d
GITR Glucocorticoid-induced TNFR NM_004195 15.5 1.0
GRO Growth-related oncogene (CXCL1) NM_001511 21.0 3.7
GRO-a Growth-related oncogene a NM_001511 19.9 n/d
HCC4 Hemofiltrate CC chemokine (CCL16) NM_004590 19.5 2.7
HGF Hepatocyte growth factor NM_000601 21.9 3.1
ICAM1 Intercellular adhesion molecule 1 (CD54) NM_000201 0.0 39.2
ICAM3 Intercellular adhesion molecule 3 NM_002162 0.0 8.7
IGFBP3 Insulin-like growth factor binding protein 3 NM_000598 0.7 26.3
IGFBP6 Insulin-like growth factor binding protein 6 NM_002178 0.0 121.6
IGF1SR Insulin-like growth factor 1 soluble receptor NM_000875 0.0 6.0
IL1R4 Interleukin 1 receptor, type 4 N/d n/d n/d
IL1R1 Iinterleukin 1 receptor, type 1 NM_000877 3.5 7.1
IL11 Interleukin 11 NM_000641 8.0 1.0
IL12p40 Interleukin 12B NM_002187 19.7 11.9
IL12p70 Interleukin 12A and 12B NM_000882 18.9 3.1
IL17 Interleukin 17 NM_002190 20.9 1.0
IL2R Interleukin 2 receptor ♋ NM_000417 17.7 1.0
IL6R Interleukin 6 receptor NM_000565 29.3 1.0
IL8 Interleukin 8 NM_000584 112.5 1.0
I-TAC IFN-ind. T-cell chemoattractant (CXCL11) NM_005409 1.3 1.0
Ltn Lymphotactin (XCL1) NM_002995 0.0 11.5
MIF Mesoderm-inducing factor NM_002192 0.0 240.7
MIP1a Macrophage inflammatory protein 1a (CCL3) NM_002983 0.3 1.9
MIP1b Macrophage inflammatory protein 1b (CCL4) NM_002984 0.0 1.4
MIP3b Macrophage inflammatory protein 3b (CCL19) NM_006274 0.0 1.0
MSP-a Macrophage stimulating protein a NM_020998 5.9 1.0
NT4 Neurotrophin 4 NM_006179 20.2 14.4
OPG Osteoprotegerin NM_002546 52.2 2.9
OSM Oncostatin M NM_020530 27.7 1.0
PIGF Placental growth factor NM_002632 26.5 9.3
sgp130 Soluble glycoprotein 130 NM_002184 27.2 1.0
sTNFRII Soluble TNF receptor, member 2 NM_001066 26.9 3.4
sTNFRI Soluble TNF receptor, member 1 NM_001065 28.1 2.9
TECK Thymus-expressed chemokine (CCL25) NM_005624 13.1 1.0
TIMP1 Tissue inhibitor of metalloproteinase 1 NM_003254 11.9 528.6
TIMP2 Tissue inhibitor of metalloproteinase 2 NM_003255 70.9 66.2
TPO Thrombopoietin NM_199356 0.2 2.3
TRAIL3 TNF-related apoptosis-inducing ligand 3 NM_003841 6.0 1.0
TRAIL4 TNF-related apoptosis-inducing ligand 4 NM_003840 15.3 2.1
UPAR Urokinase plasminogen activator receptor NM_002659 15.7 56.1
VEGFB Vascular endothelial growth factor B NM_003377 60.3 178.6
VEGFD Vascular endothelial growth factor D NM_004469 26.9 1.0
TOOLS
Similar articles