

 PDF
PDF Citation
 Print
Print


Introduction
Intestinal epithelium is a rapidly self-renewing tissue, which consists of a crypt/villus unit. The renewal process is driven by leucine-rich G-protein-coupled receptor 5 (LGR5)+ intestinal stem cells (ISCs) at the crypt bottom (1). ISC has another population of the cells for tissue maintenance, named reserve ISC (rISC) located around +4 position from the bottom of the crypt (2). The rISCs are slowly cycling, injury-resistant and are capable of giving rise to multiple cell types upon injury or LGR5+ ISC loss (2, 3). B-cell-specific Moloney murine leukemia virus integrin site 1 (BMI1) is known as one of the rISC marker (4). Previous studies demonstrated that BMI1+ ISCs contribute to the regenerative response after injury to the small intestinal epithelium while LGR5+ ISCs are ablated (5, 6).
During homeostasis, ISCs produce the progenitors in the transit-amplifying cell zone that are committed to becoming differentiated cells (1). Differentiated cells in the small intestine are classified into two groups, absorptive and secretory cells (7). The absorptive progenitors differentiate into enterocyte. Secretory cells include goblet, Paneth, enteroendocrine and tuft cells. Previous studies suggest that during homeostasis secretory cell lineage originates from BMI1+ ISC, however it remains unclear how secretory cell differentiation from BMI1+ ISC is regulated (6, 8).
The zinc finger transcription factor, Krüppel-like factor 4 (KLF4) is normally expressed in the differentiated epithelial cells of the intestine, and contributes to epithelial homeostasis (9). Previously, we reported that KLF4 modulates the fate of BMI1+ ISCs and contributes to crypt regeneration from the BMI1+ cell-derived lineage by promoting its clonal expansion after radiation-induced injury (10). Furthermore, several studies suggested that goblet cell differentiation is regulated by KLF4 in the small intestine (11-13). However, it has not been elucidated how KLF4 regulates intestinal BMI1+ ISC during homeostasis.
These findings provide definitive evidence that KLF4 is essential in regulating goblet cell differentiation in the BMI1-expressing intestinal stem cells both in vivo and in cultured organoids in vitro.
Go to : 
Materials and Methods
Mouse strains and treatment
Bmi1-CreER;Rosa26eYFP (Bmi1Ctrl) mice and Bmi1-CreER; Rosa26eYFP;Klf4fl/fl (Bmi1ΔKlf4) mice were used as described previously (10). Three to four months old mice were used in this study. Tamoxifen was dissolved in a corn oil (37.5 mg/ml) and administrated by single intraperitoneal injection (9 mg per 40 g of body weight). All studies and procedures involving animal subjects were approved by the Stony Brook University Institutional Animal Care and Use Committee and conducted strictly in accordance with the approved animal handling protocol.
Immunofluorescence (IF) staining
Proximal parts of small intestines were swiss-rolled as described previously (10), and paraffin embedded blocks were cut into 5 μm thick sections. Tissues were de-paraffinized in xylen, rehydrated in ethanol gradient and incubated in a 10 mM Na-citrate buffer (pH 6.0) at 120℃ for 10 min in a pressure cooker in order to retrieve antigen. Sections were then washed with water, incubated for 1h at 37℃ in a blocking solution (5% Bovine serum albumin and 0.01% Tween 20 in 1x Tris-based phosphate-buffered saline [PBS]), and incubated with primary antibodies for GFP (AvesLabs), KLF4 (R&D Systems), MUC2 (GeneTex), chromogranin A (Abcam), Lysozyme (Leica biosystems). EdU was administered 3 h prior to euthanasia. EdU labelled cells were stained using Click-IT EdU imaging kit (Thermo Fisher Scientific) according to manufacturer’s instruction. Tissues were also counterstained with Hoechst 33258 to visualize nuclei.
EYFP+ cell isolation and organoid culture
Proximal small intestine was harvested from mice at 48 h after tamoxifen injection. Intestinal epithelial cells were dissociated as previously described (14). EYFP+ cells were sorted by flow cytometry (BD FACSARIA III; BD Biosciences, San Jose, CA) from Bmi1Ctrl and Bmi1ΔKlf4 mice. Sorted eYFP+ cells were embedded in Matrigel (Corning) and dispensed into 24-well plates as 20∼30 μl droplets. Organoid culture medium was prepared using L-WRN cells as previously described (15) and supplemented with 1x N2 suplement (Theromo Fisher Scientific), 1x B27 supplement (Thermo Fisher Scientific), gastrin I (10 nM) (Sigma-Aldrich), recombinant human epidermal growth factor (50 ng/ml) (Thermo Fisher Scientific), trans-forming growth factor β inhibitor A83-01 (500 nM) (Tocris Bioscience, Bristol, United Kingdom), N-acetylcysteine (1 mM) (Sigma-Aldrich) and antibiotic cocktail Primocin (100 μg/ml) (Thermo Fisher Scientific). GSK3β inhibitor CHIR99021 (10 μM) (Tocris) and ROCK inhibitor Y-27632 (10 μM) (Sigma-Aldrich) were also added during the first 2 days of the culture. The media were changed every 2 days. Live organoids were imaged using inverted microscope (Eclipse Ti2, Nikon).
Intestinal organoid paraffin section preparation
Cultured organoids were washed with PBS. Matrigel was dissolved with Cell Recovery Solution (Corning) and collected organoids were resuspended in iPGell (GenoStaff, Tokyo, Japan). The iPGell-embedded organoids were fixed in 4% paraformaldehyde and embedded in paraffin.
Statistical analysis
Statistical analysis was carried out using GraphPad Prism version 8.3.0 for Windows (GraphPad). Student t test, Dunn’s multiple comparisons test with Kruskal-Wallis test, Spearman correlation were used. Values of p<0.05 were considered significant. All data are shown as Mean± SEM.
Go to :
Results and Discussion
KLF4 is expressed in goblet cells in the crypt of small intestine
As previously reported, KLF4 is expressed mainly in the terminally differentiated epithelial cells lining the intestinal villi with the highest levels of expression within the proximal intestinal epithelium and also in a small population of the cells within the intestinal crypts of Bmi1Ctrl mice (Fig. 1A) (12, 16). BMI1+ ISCs exist predominantly in the crypts of the proximal intestinal epithe-lium. Therefore, in this study, we focused on the KLF4 function in BMI1+ ISC lineage within this region. Immunostaining revealed that the goblet cell marker, MUC2 is expressed in 74.1±4.0% of KLF4+ cells in crypts (Fig. 1B and 1C). We also performed immunofluo-rescent staining (IF) of KLF4 and chromogranin A (an enteroendocrine cell marker) and lysozyme (a Paneth cell marker) (Fig. 1D and 1E). Co-expression rates of KLF4 in MUC2+, chromogranin A+ and lysozyme+ cells are 79.0±2.0%, 3.3±1.7% and 0.7±0.7%, respectively (Fig. 1F). Thus, KLF4 is mainly expressed in goblet cells in the crypt of small intestine.
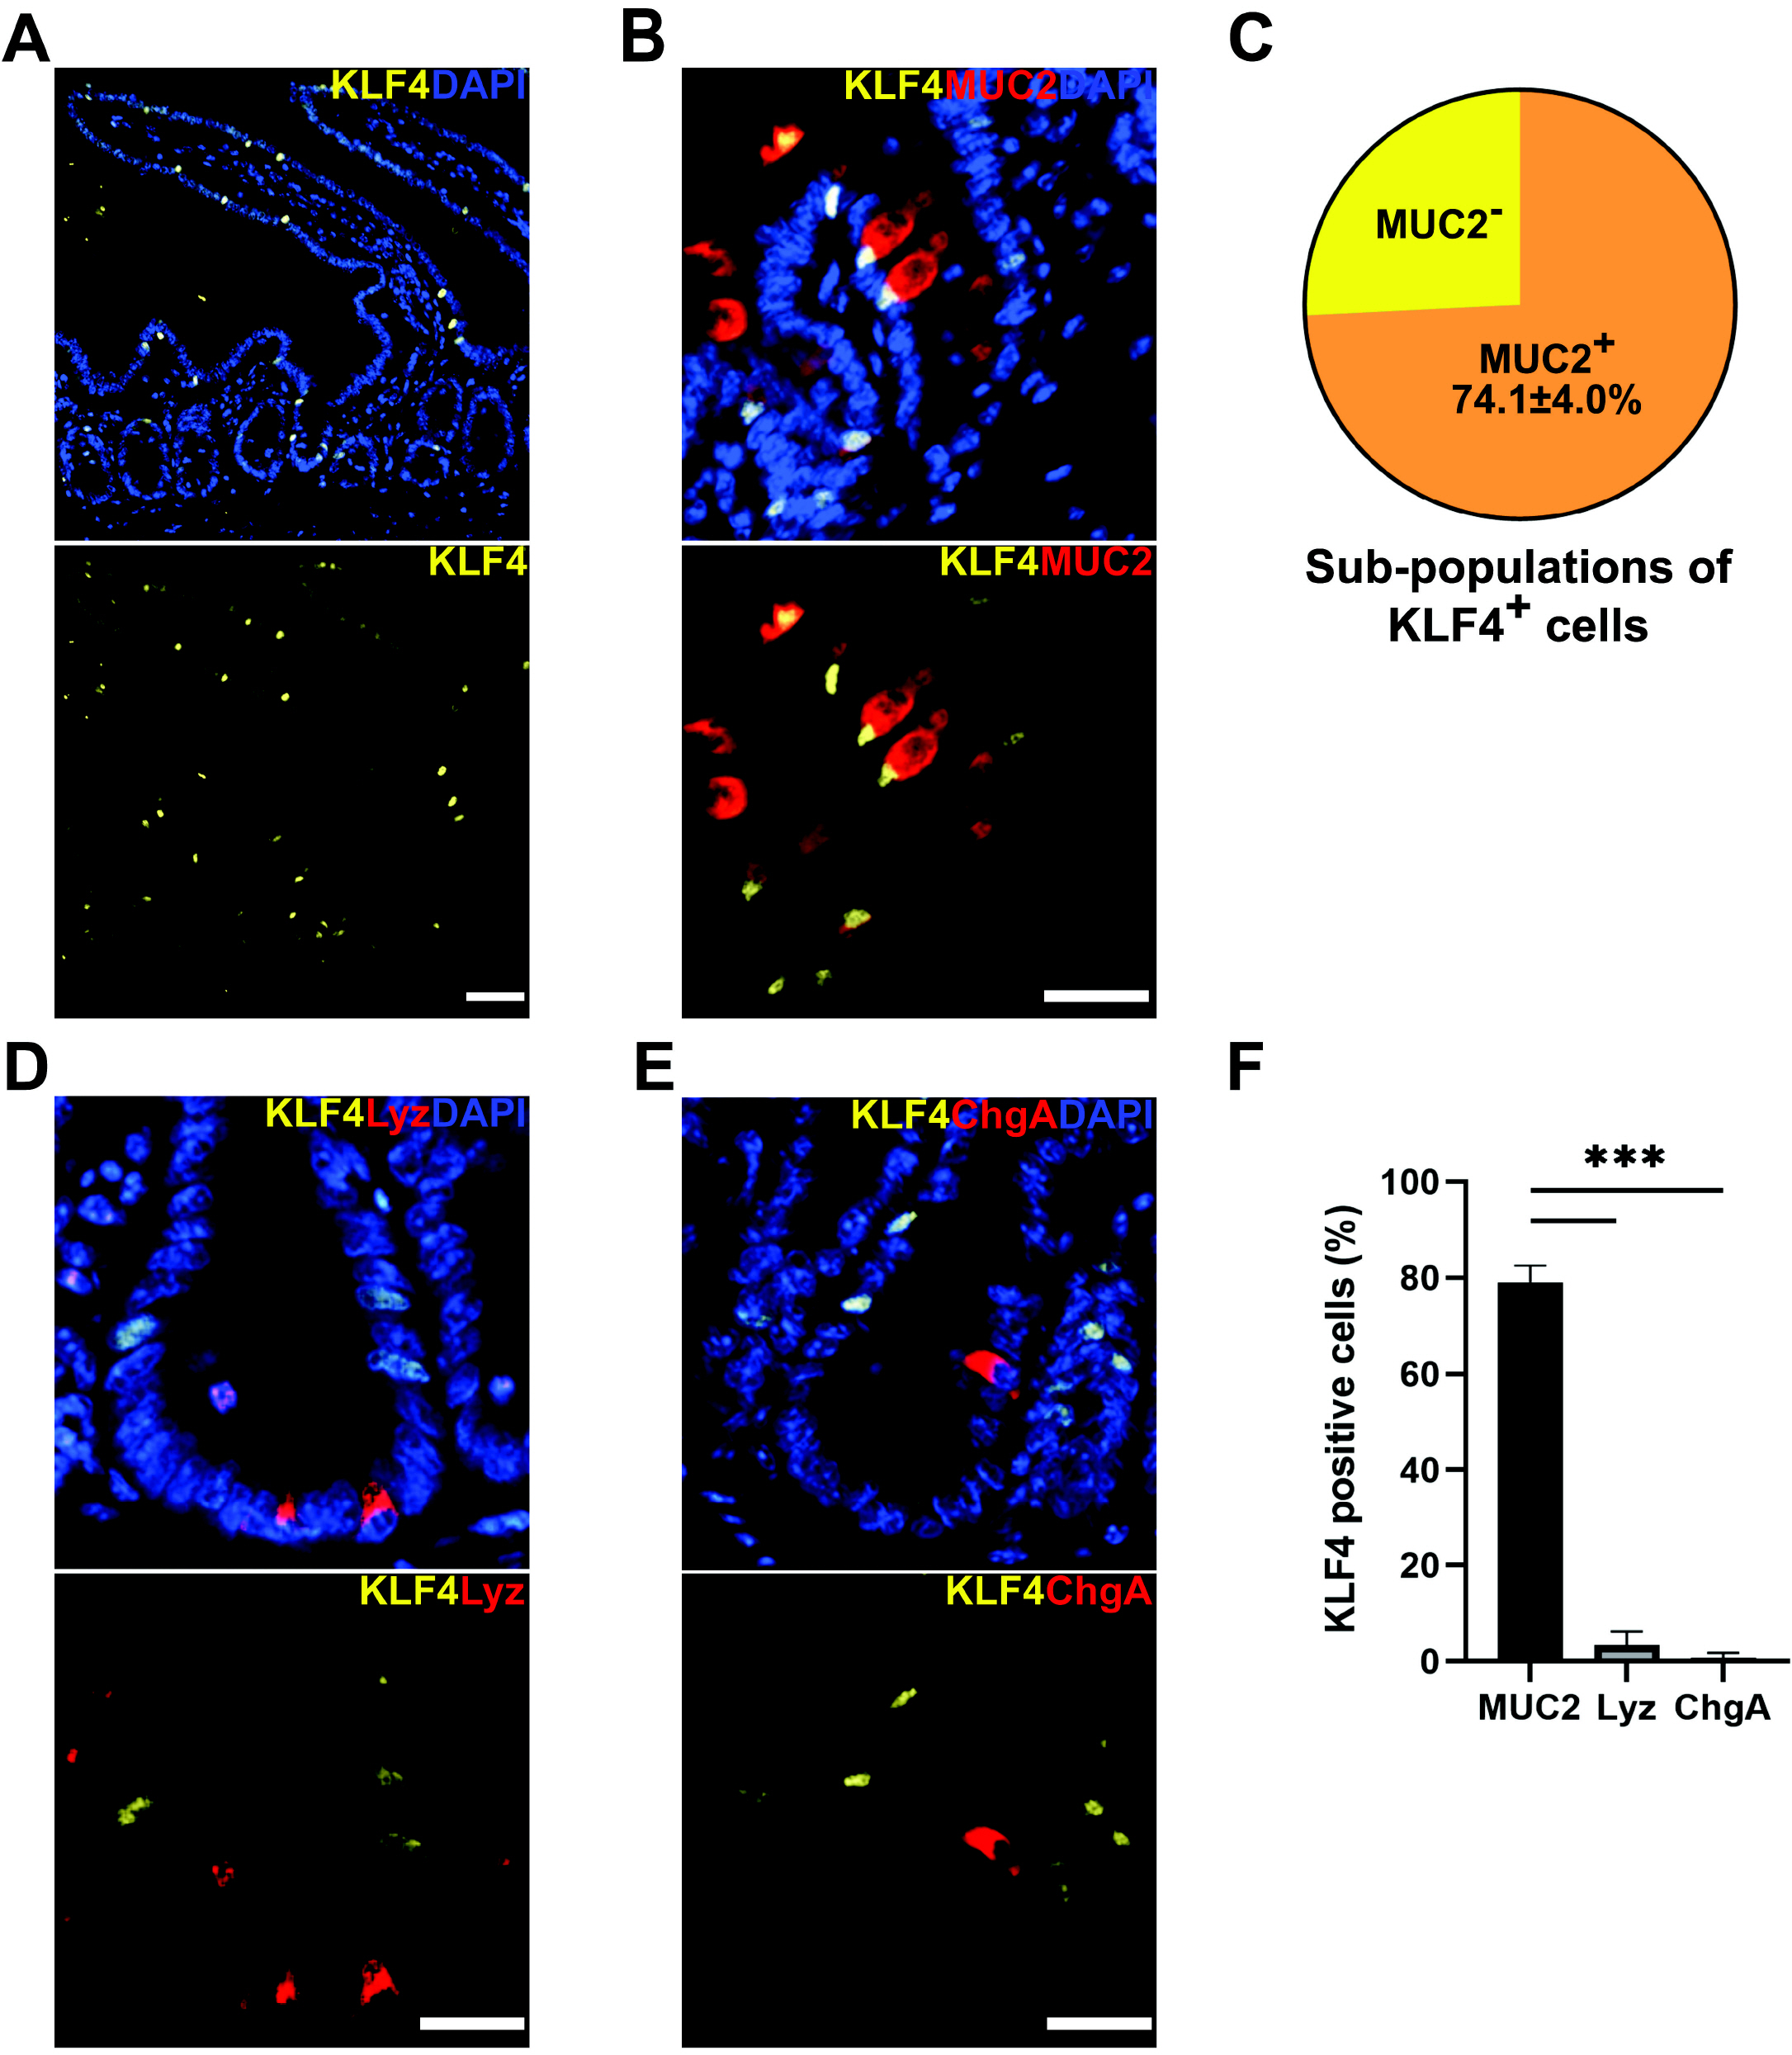 | Fig. 1Relationship between KLF4 expression and markers of differentiated cells in proximal small intestine. (A) Immunostaining of Bmi1Ctrl mouse intestine. KLF4 (yellow) was expressed mainly in the terminally differentiated epithelial cells and was also expressed in a subpopulation of the cells in the crypt. Scale bar, 50 μm. (B) Immunostaining for MUC2 (goblet cell marker, red) and KLF4 (yellow). MUC2 was overlapped with KLF4 in the crypt of proximal small intestine. Scale bar, 25 μm. (C) MUC2 was co-expressed in 74.1±4.0% of KLF4+ cells. KLF4+ cells were collected from a total of 50 crypts per Bmi1Ctrl mouse (n=3). (D) Immunostaining for lysozyme (Paneth cell marker, red) and KLF4 (yellow). Scale bar, 25 μm. (E) Immunostaining for chromogranin A (enteroendocrine cell marker, red) and KLF4 (yellow). Scale bar, 25 μm. (F) Co-expression rate of KLF4+ in MUC2+ cells was significantly higher than Lyz+ and ChgA+ cells (79.0±2.0%, 3.3±1.7%, and 0.7±0.7%, respectively). ***p<0.001 MUC2+, lysozyme+, and chromogranin A+ cells were collected from a total of 150, 100 and 60 crypts from 3 Bmi1Ctrl mice, respectively (n=3 for each group). Lyz, lysozyme; ChgA, chromogranin A.
|
KLF4 regulates goblet cell differentiation and proliferation in BMI1+-ISC lineage in vivo
Next, we investigated the effect of Klf4 deletion in BMI1+ ISC population on goblet cells differentiation. Bmi1Ctrl and Bmi1ΔKlf4 mice were injected with tamoxifen and the proximal small intestinal tissues were collected on days 2, 3, and 7 post-treatment and stained for eYFP (BMI1+ cells and their lineage), KLF4 and MUC2 (Fig. 2A). The number of eYFP+ cells increased in both Bmi1Ctrl and Bmi1ΔKlf4 mice after tamoxifen injection (Bmi1Ctrl vs. Bmi1ΔKlf4, 2.0±0.1 vs. 2.5±0.2, 4.0±0.2 vs. 6.3±0.2, 9.0±0.6 vs. 9.4±0.6 at days 2, 3, and 7, respectively) (Fig. 2B). At 3 days after tamoxifen injection, the number of eYFP+ cells per eYFP crypt in Bmi1ΔKlf4 mice was significantly higher than Bmi1Ctrl mice (6.3±0.2 and 4.0±0.2, respectively; p<0.001) (Fig. 2A and 2B). Importantly, the number of KLF4+ cells in Bmi1-eYFP+ cells in Bmi1ΔKlf4 mice was significantly lower than Bmi1Ctrl mice on days 3 and 7 after tamoxifen injection (Fig. 2C). The number of goblet cells marked by MUC2 stain per eYFP+ crypt in Bmi1Ctrl mice was significantly higher than in Bmi1ΔKlf4 mice on day 7 (Fig. 2D). Thus, goblet cell differentiation was significantly inhibited in BMI1+ ISC derived lineage after Klf4 deletion in BMI1+ ISC during homeostasis. Deletion of Klf4 within BMI1+ cell population did not affect differentiation of other secretory lineages marked by chromogranin A and lysozyme (data not shown). Three days after tamoxifen administration, the percentage of EdU+ cells in eYFP+ cells in Bmi1ΔKlf4 mice was also significantly higher than in Bmi1Ctrl mice (46.7±2.1% and 20.7±0.9%, respectively; p<0.001) (Fig. 2E and 2F). Taken together these data suggest that Klf4 deletion in BMI1+ ISC leads to increased cell proliferation in BMI1+ ISC derived cell lineages and a reduction of goblet cell differentiation.
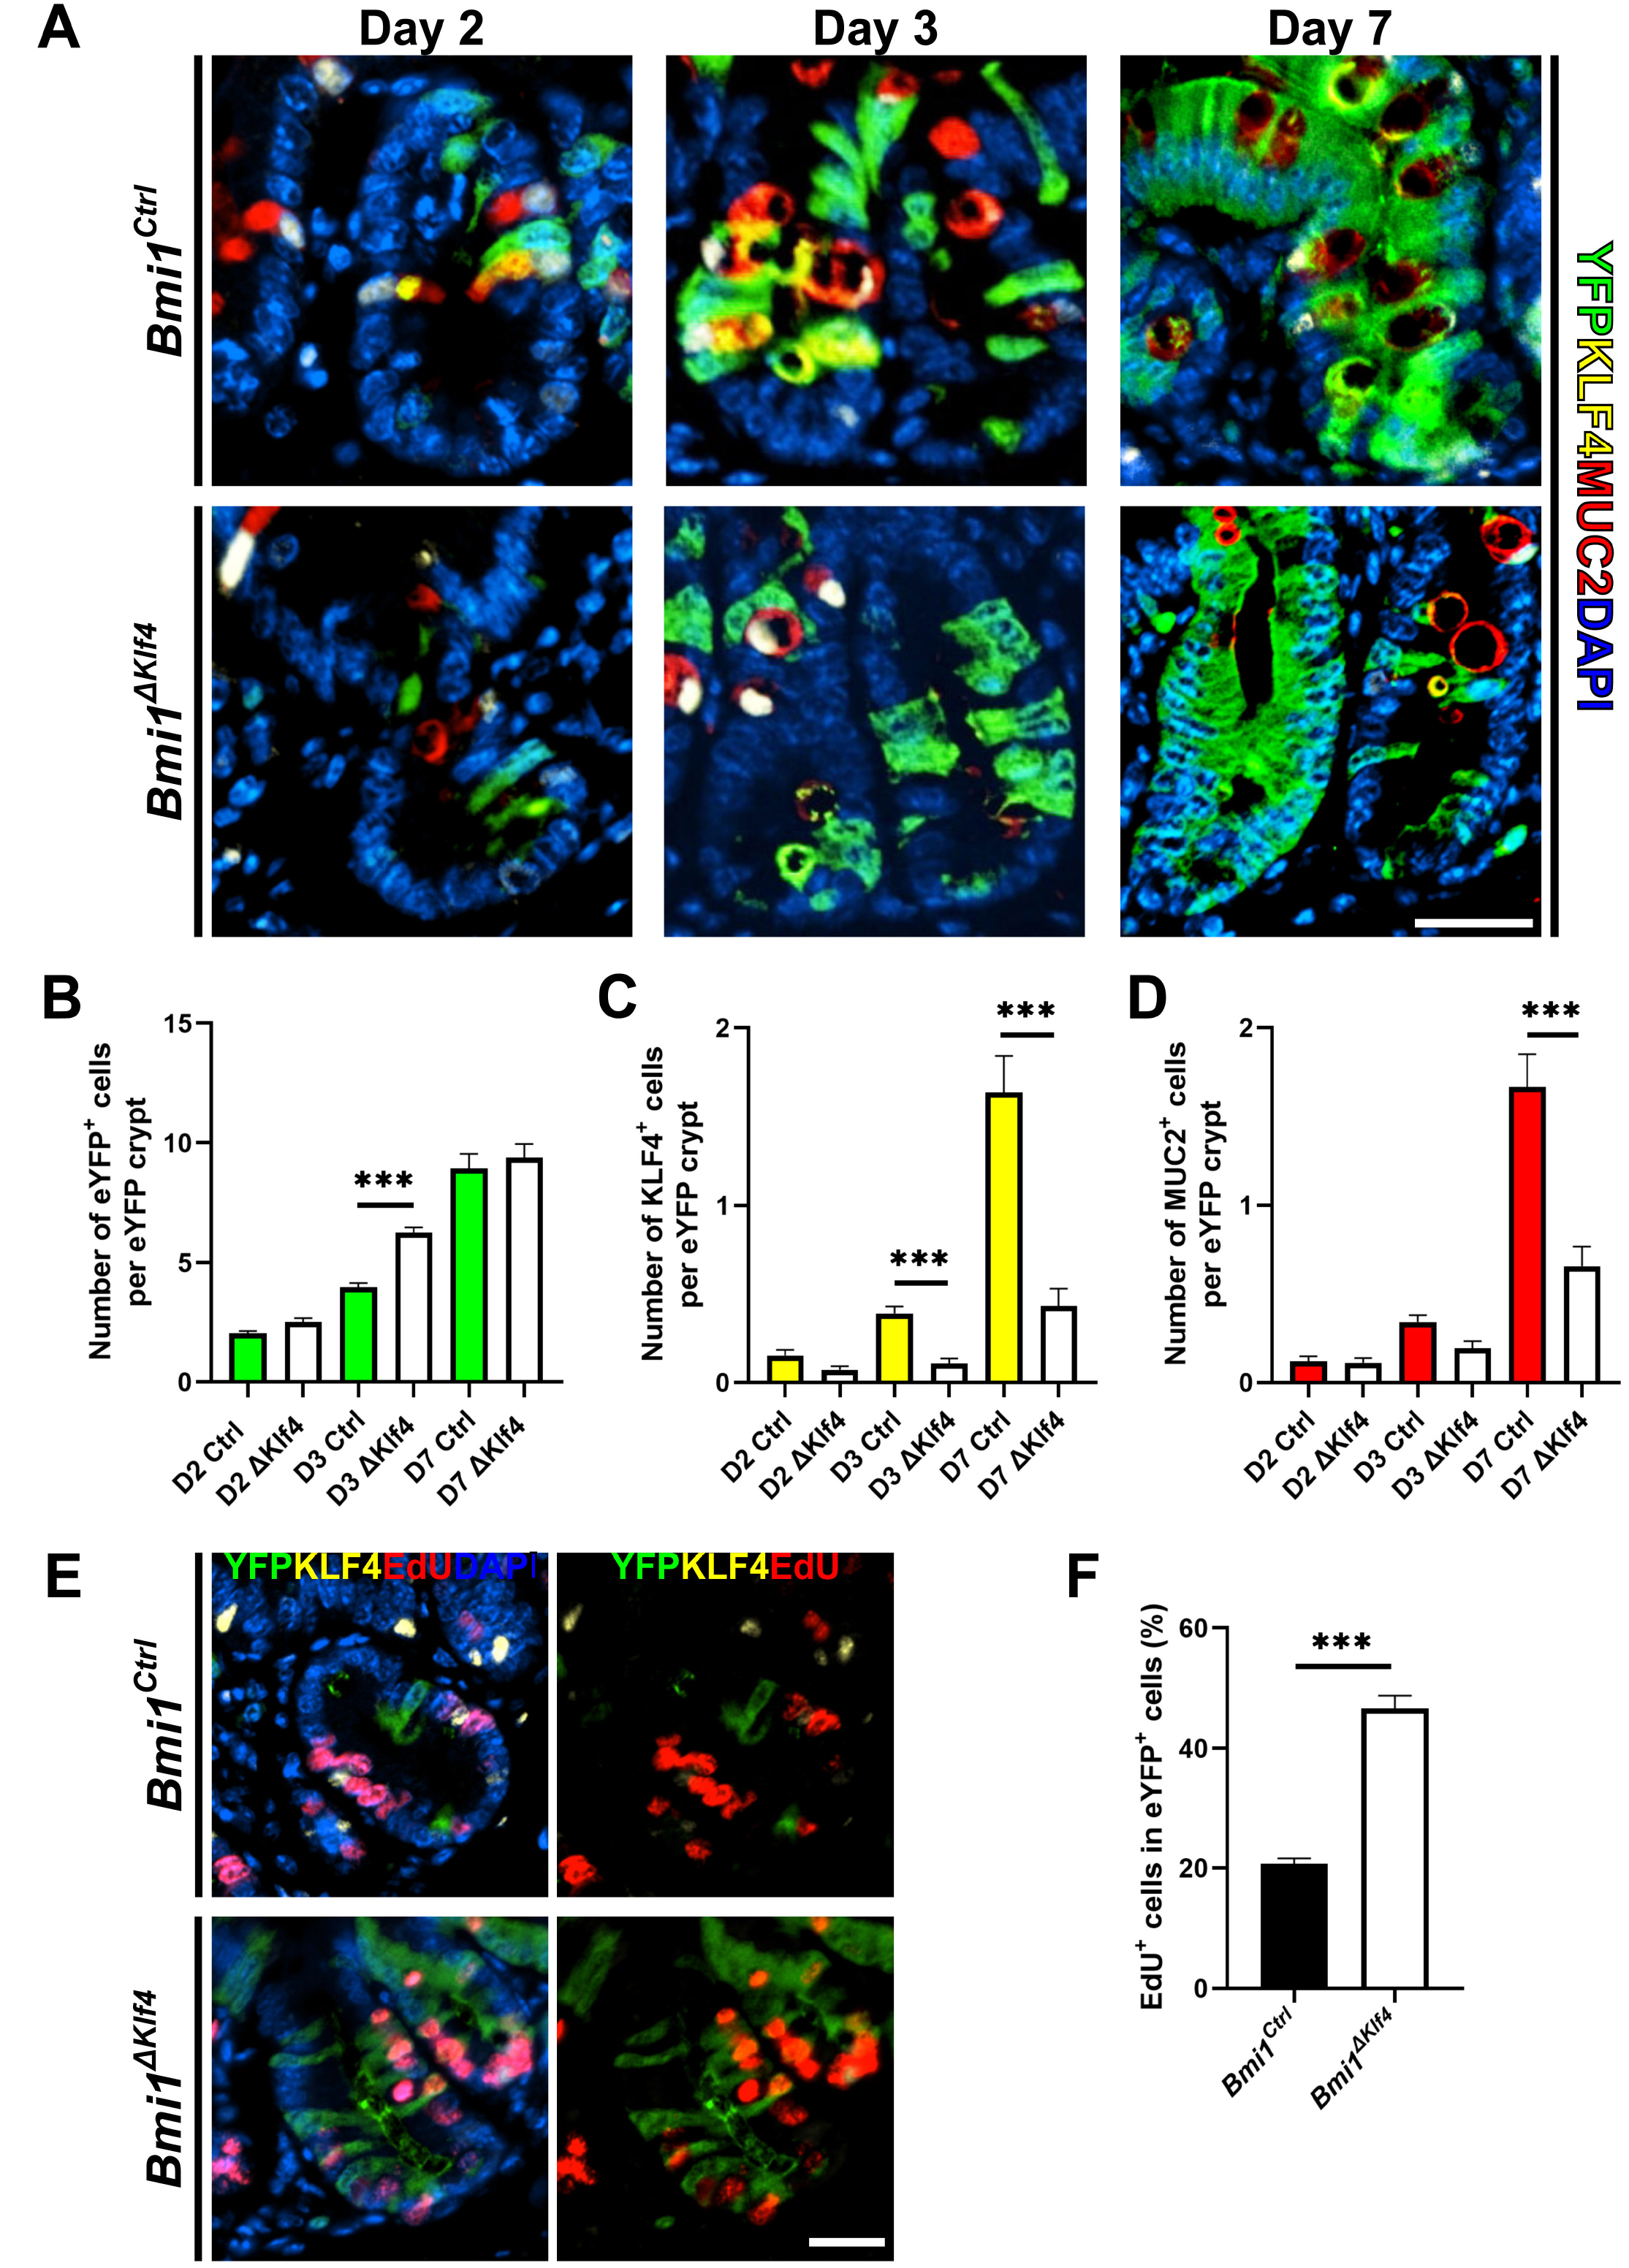 | Fig. 2KLF4 modulates goblet cell differentiation in Bmi1 cell lineage during homeostasis. (A) Immunostaining for eYFP (green), MUC2 (red) and KLF4 (yellow). Representative image of proximal small intestinal crypt at day 2, 3 and 7 following tamoxifen injection. Goblet cell differentiation is involved in Bmi1-eYFP cell lineage. Scale bar, 25 μm. (B), (C) and (D) The number of eYFP, MUC2 and KLF4 positive cells per eYFP+ including crypt increased as the time following tamoxifen administration in both groups. Data were collected from at least 20 crypts per mouse (n=3 each group). Dunn’s multiple comparisons test with Kruskal-Wallis test. (B) The number of eYFP+ cells was significantly higher in Bmi1ΔKlf4 than in Bmi1Ctrl at day 3 following tamoxifen administration. (C) The number of KLF4+ cells was significantly higher in Bmi1Ctrl than in Bmi1ΔKlf4 at day 7 following tamoxifen administration (p<0.001). (D) The number of MUC2+ cells was significantly lower in Bmi1ΔKlf4 than in Bmi1Ctrl at day 3 and 7 following tamoxifen administration (p<0.001). (E) Immunostaining for eYFP (green), KLF4 (yellow) and EdU (red) for the proximal small intestinal crypts at day 3 following tamoxifen administration. Scale bar, 25 μm. (F) At day 3 after tamoxifen injection, EdU positivity in eYFP+ cells of Bmi1ΔKlf4 was significantly higher than Bmi1Ctrl (46.7±2.1% and 20.7±0.9%, respectively). Student t test. EYFP+ cells were collected from 50 crypts per mouse (n=3 each group). ***p<0.001.
|
KLF4 is positively correlated with goblet cell differentiation
To confirm relationship between KLF4 expression and goblet cell differentiation, we counted BMI1-eYFP positive cells from proximal small intestinal crypts of Bmi1Ctrl and Bmi1ΔKlf4 mice 7 days after tamoxifen injection. In Bmi1Ctrl mice 18.0±2.4% of eYFP+ cells co-expressed MUC2 while in Bmi1ΔKlf4 mice only 9.2±1.9% (Fig. 3A). Additionally, in Bmi1Ctrl mice, 60∼70% of MUC2 positive cells co-expressed KLF4. The Spearman correlations analysis showed that KLF4 and MUC2 are significantly positively correlated (Spearman correlation=0.9429, p<0.01) (Fig. 3B).
 | Fig. 3KLF4 is positively correlated with goblet cell differentiation. (A) The pie chart shows the subpopula-tions of eYFP+ cells distinguished by co-staining with KLF4 and/or MUC2. A total of at 150∼260 eYFP+ cells were counted from each mouse at day 7 after tamoxifen administration (n=3 each group). (B) KLF4 and MUC2 were significantly positively correlated (Spearman correlation= 0.9429, p<0.01).
|
Goblet cell differentiation from single sorted Bmi1-eYFP+ cell is regulated by KLF4
To determine the effect of Klf4 deletion from BMI1+ cells on tissue regenerative process, we used organoids derived from fluorescence-activated cell sorting-isolated eYFP+ cells. Cultured organoids obtained from Bmi1Ctrl and Bmi1ΔKlf4 mice showed budding formation around culture day 5 (Fig. 4A and 4B) with no significant difference between these two groups. However, on day 7 organoids obtained from Bmi1ΔKlf4 mice showed increased in the proliferation in comparison to organoids from Bmi1Ctrl mice. This is in accordance with our previous in vivo observation that demonstrated that Klf4 deletion in BMI1+ cells led to their increased proliferation (10). Immunostai-ning of cultured organoids demonstrated that MUC2+ cells are found in organoids derived from Bmi1Ctrl mice, and 73.9% of MUC2+ cells co-expressed KLF4 (Fig. 4C). Organoids derived from Bmi1ΔKlf4 showed decreased number of MUC2+ and KLF4+ cells (Bmi1Ctrl vs. Bmi1ΔKlf4, 11.2±1.1% vs. 1.4±0.5% and 13.4±1.6% vs 2.1±0.8% for KLF4+ and MUC2+ cells, respectively) (Fig. 4D and 4E). Thus, these data demonstrate that KLF4 regulates goblet cell differentiation from BMI1+ ISC.
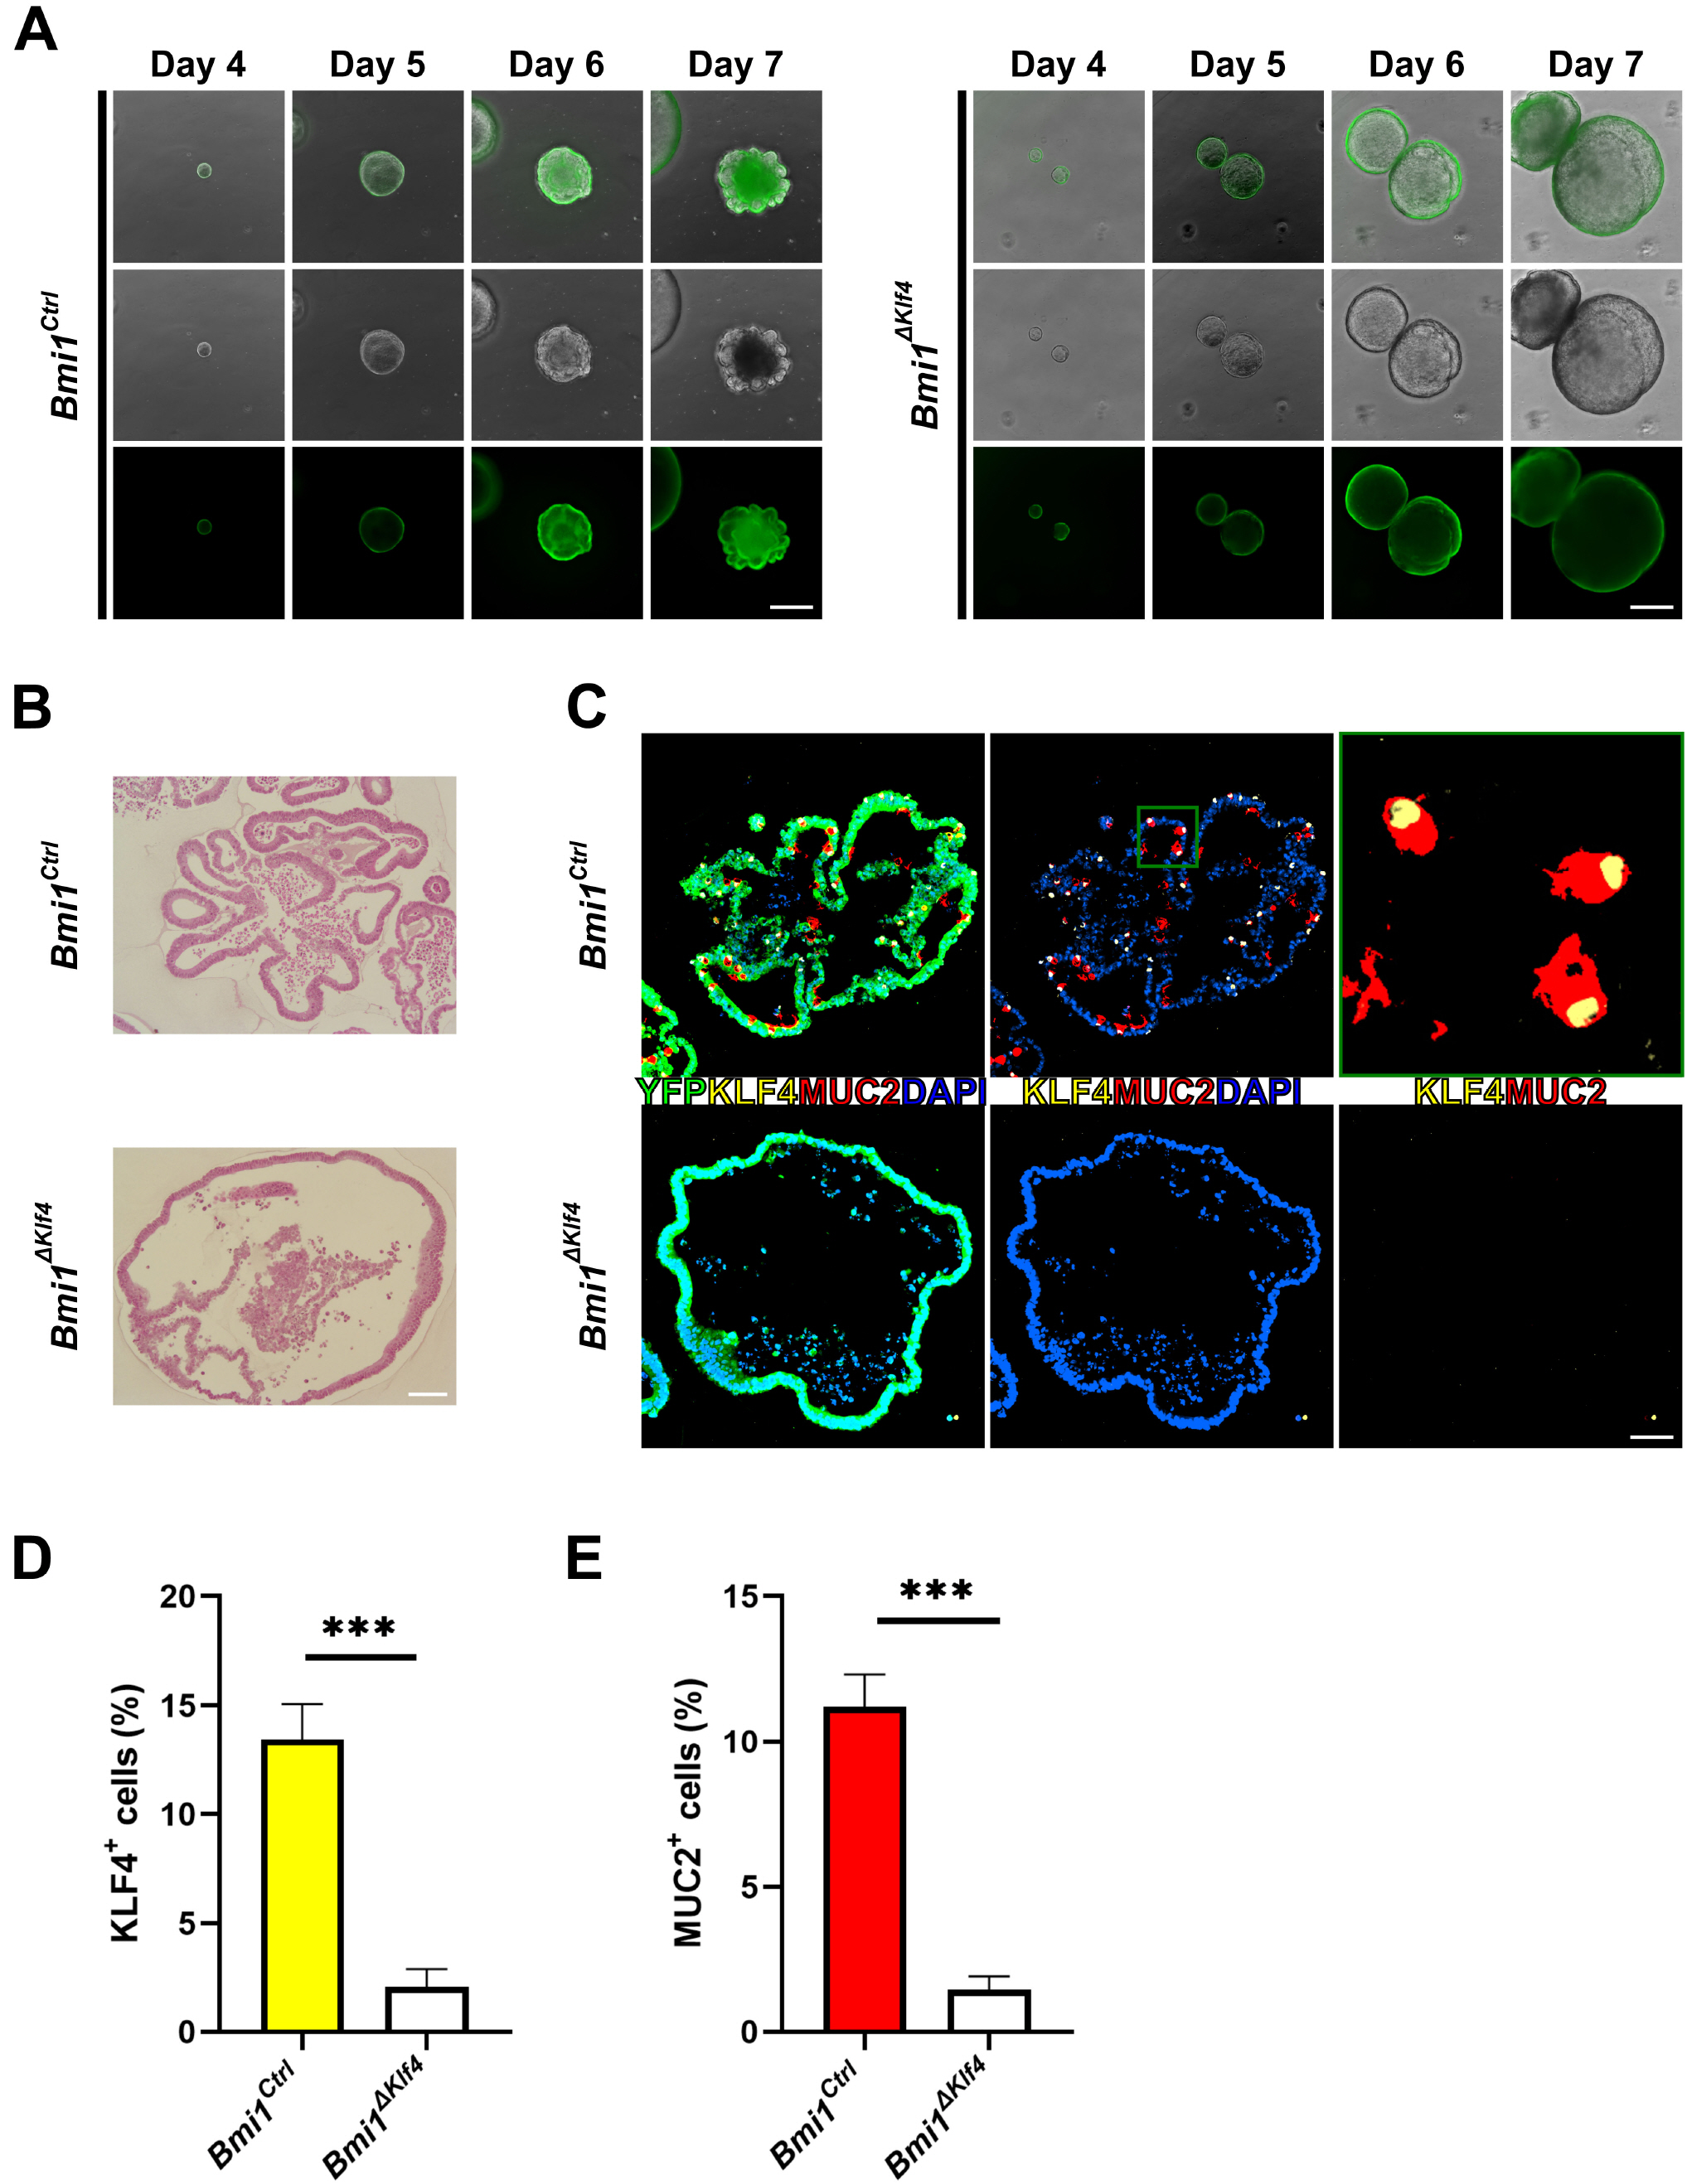 | Fig. 4Organoids derived from single FACS sorted eYFP+ cells of Bmi1Ctrl and Bmi1ΔKlf4 mice. (A) Representative time course images of cultured organoids derived from Bmi1Ctrl and Bmi1ΔKlf4 mice. Upper panels, merged image of bright-field and fluorescent image; middle panel, bright field image; lower panel, fluorescent image. Scale bars, 500 μm. (B) Hematoxylin and eosin staining at culture day 7. Scale bars, 100 μm. (C) Cultured organoids were collected at day 7. Immunostaining for eYFP (green), MUC2 (red), KLF4 (yellow). Left panel merged image for eYFP, MUC2, KLF4 and DAPI (blue); middle panel, merged image for MUC2, KLF4 and DAPI; right panel merged image for MUC2 and KLF4. Upper right panel is magnified image of green square in upper middle panel. In Bmi1Ctrl mice derived organoids, 73.9% of MUC2+ cells were co-expressed with KLF4. Scale bars, 50 μm. (D) and (E) Percentage of KLF4+ and MUC2+ cells were significantly higher in Bmi1Ctrl organoid than Bmi1ΔKlf4 at culture day 7 (Bmi1Ctrl vs. Bmi1ΔKlf4, 11.2±1.1% vs. 1.4±0.5% and 13.4±1.6% vs 2.1±0.8% for KLF4 and MUC2, respectively). Cells were analyzed from 10 sections for each group and 10∼200 cells were collected from each section. Organoids were pooled from 3 mice for each group. ***p<0.001.
|
In this study, we have shown that goblet cell differentiation is regulated by KLF4 in BMI1+ ISC lineage during homeostasis. Initially, BMI1+ ISC was identified as quiescent and radiation-resistant cell located around +4 position in the proximal small intestinal crypt (4, 6). Afterward, several studies observed controversial results that Bmi1 was expressed throughout the crypt using mRNA in situ hybridization and BMI1 expressing cells were located in crypt cells, including goblet, enteroendocrine, Paneth and Lgr5+ cells (8, 17, 18). These data and our results suggest that BMI1+ ISCs are partially responsible for the intestinal homeostasis not only in injury state but also under homeostasic condition.
Goblet cells are the most abundant intestinal secretory lineage, comprising ∼15% of the small intestinal epithelial cells (2, 19). Although turnover time of MUC2+ goblet cells is slower in the crypt compared to goblet cells along the villi, newly produced MUC2 expressing goblet cell will disappear within 24 h (2, 19). In this study, MUC2 positive cells were detected in BMI1+ cell lineage at 7 days after tamoxifen injection. Thus, BMI1+ cells act as not only rISC but also active intestinal stem cells (aISC) with self-renewal and multipotency during homeo-stasis. Previous studies indicated that KLF4 had a critical role in the development of goblet cells and thefunction was regulated by the Notch pathway (11, 12, 20, 21). Another study suggested that KLF4 cooperated with Hippo signaling effectors, YAP and TAZ in promoting differentiation into goblet cells (13). In these studies, the effect of Klf4 deletion was included in both differentiated cells and ISC. Here, we have investigated the direct effect of BMI1+ ISC specific Klf4 deletion using lineage tracing mouse model from Bmi1 locus and ex vivo organoid model.
In conclusion, we have shown that KLF4 regulates goblet cell differentiation in BMI1+ intestinal stem cell lineage during homeostasis.
Go to :
 XML Download