

 PDF
PDF Citation
 Print
Print


Introduction
Cirrhosis, caused by chronic liver injury, presents with hepatocyte cell death and formation of regenerative nodules and fibrous septa, leading to loss of liver function and might progress to hepatocellular carcinoma in up to 5% of patients. With progression, complications such as variceal bleeding, ascites, and hepatic encephalopathy reduce the quality of life and increase mortality (1, 2). Although liver transplantation is a treatment option for advanced cirrhosis (3), it is limited by lack of donors, surgical complications, immune rejection, and high medical costs. Therefore, as an alternative therapy for cirrhosis, cell therapy using primary hepatocytes, bone marrow mononuclear cells, hematopoietic stem cells, and mesenchymal stem cells (MSCs) have been studied at preclinical and clinical levels and shown to improve liver function (4-9). MSCs have several advantages such as easy isolation and culture in various tissues and organs, including the liver, bone marrow, and fat; in vitro expansion; and viability after cryopreservation (10-12). To date, more than 1000 clinical trials using MSCs have been conducted or are in progress, and more than 87 of them are intended to treat liver disease (https://clinicaltrials.gov). MSCs can migrate to damaged liver tissues (13, 14), differentiate into hepatocytes (15), ameliorate inflammatory responses (16), reduce liver fibrosis (17), and act as antioxidants (18). MSC transplantation into patients with liver diseases is safe, has no side effects, and improves liver function (19).
Autologous or allogeneic MSCs derived from adipose tissue, bone marrow, and umbilical cord have been applied to clinical trials for liver diseases, and both MSCs have been shown to improve liver function (20). Given that the therapeutic effects of autologous or allogeneic MSCs are the same, optimal preparation at the time of transplantation can be an important criterion for selecting one of them. Generally, it takes approximately 1 month to isolate and culture autologous stem cells from cirrhosis patients, but in the case of allogeneic transplantation, the MSC preparation period can be significantly shortened. Additionally, few studies have been conducted to determine whether the characteristics of proliferation, differentiation, and expression of cell surface antigens of MSCs isolated from patients differ from those of normal MSCs. Here, we compared and analyzed the surface antigen expression, proliferation, aging, differentiation and mitochondrial activities of BMSCs (BCs or BPs, respectively) isolated from the bone marrow of six healthy volunteers or six patients with cirrhosis to verify the efficacy of autologous transplantation.
Go to : 
Materials and Methods
Cell culture
This study was approved by the Institutional Review Board of Yonsei University Wonju College of Medicine (CR 319009). BMSCs at P1 or P2 from six cirrhosis patients (Korean, mean age 45.8±8.8 years) were obtained with informed consent from Pharmicell Co., Ltd. (Sungnam, Korea). Bone marrow mononuclear cells from six healthy volunteers (Caucasian, mean age 43.2±8.7 years) were purchased from the American Type Culture Collection (Manassas, VA, USA) and plated in 100 mm dishes (2×10⁵ cells/cm2) with low-glucose Dulbecco’s modified Eagle’s medium (LG-DMEM, Gibco BRL, Rockville, MD, USA) containing 10% fetal bovine serum (FBS, Gibco BRL) and penicillin/streptomycin. After 2 days, the medium was changed to remove non-adherent cells, and then the cell culture medium was changed twice weekly. When the cells reached 90% confluence (P0), the BMSCs were trypsinized and passaged at a density of 5×10³ cells/cm2. Population doubling time (PDT) was determined by dividing the total number of hours in culture by the number of doublings. To calculate the cumulative cell numbers, BMSCs were serial passaged until the PDT of each BMSC reached 150 h. BC or BP represents BMSCs from healthy volunteer or patient. The number after BC or BP represents each individual in the volunteers’ or the patients’ group.
Colony forming unit–fibroblast (CFU-F) assay from bone marrow of SD rat
All animal experimental protocols and procedures were approved by the Institutional Animal Care and Use Committee of Yonsei University Wonju College of Medicine (YWC-180724-1). Male Sprague-Dawley (SD) rats (7 weeks old) were purchased from Orient Bio Inc. (Seongnam, Korea). Cirrhosis was induced by intraperitoneal injection of thioacetamide (TAA, Sigma-Aldrich, St. Louis, MO, USA; 200 mg/kg body weight) twice a week for 12 weeks. After administration of TAA for 12 weeks, rats were sacrificed with isoflurane anesthesia (Ifran, Hana Pham, Hwaseong, Korea). Femora were aseptically removed and washed 3 times with PBS. Thereafter, the bone marrows were flushed out using LG-DMEM onto 24-well plates. The culture medium was changed twice weekly for two weeks. For direct visualization of the colonies, the cells were washed with PBS and fixed in 95% ethanol for 5 min, and then the cells were incubated for 30 min at room temperature in 0.5% crystal violet in 95% ethanol. Excess stain was removed by washing with distilled H2O. The plates were dried and the number of CFU-F was counted. We defined a CFU-F unit as consisting of more than 100 cells using a microscope.
Surface antigen expression
A total of 5×10⁵ BMSCs were stained with antibodies conjugated with phycoerythrin (PE) against CD73, CD90, and CD105 (BD Biosciences, San Jose, CA, USA) for 20 min at room temperature. PE-conjugated mouse IgGs were used as the control isotype. The fluorescence intensity of the cells was evaluated by flow cytometry (FACS Aria III; BD Biosciences).
Real-time polymerase chain reaction (qPCR)
Total RNA was extracted using TRIzol Reagent (Gibco BRL). The reverse transcription reaction was conducted using RT RreMix Kit (iNtRON Biotechnology, Sungnam, Korea) to detect stemness genes (Nanog, OCT4, and Sox2), differentiation genes [leptin, peroxisome proliferator-acti-vated receptor γ (PPARγ), and CCAAT-enhancer-binding protein α (C/EBPα)], and parameters of mitochondrial activities [cytochrome c oxidase subunit I (MT-CO1), transcription factor A, mitochondrial (Tfam), succinate dehydrogenase complex iron sulfur subunit B (SDHB), catalase (Cat), glutathione peroxidase 1 (GPX1), and manganese superoxide dismutase (MnSOD)] using gene-specific primers (Table 1). The reagents in 10 μl reaction mixture included cDNA, primer pairs, and the SYBR Green PCR Master Mix (Applied Biosystems, Dublin, Ireland). All qPCR reactions were performed in duplicate. Peptidylprolyl Isomerase A was used for normalization. The 2−(ΔΔCt) method was used to calculate the relative fold change of mRNA expression.
Table 1
Primers used for studies
![]()
Senescence-associated β-galactosidase (SA-β-gal) staining
BMSCs in P3 were stained for β-gal activity as described by Dimri et al. (21). Briefly, 4×10⁴ cells were seeded in 12-well plates and cultured for 2 days. The β-gal activity was assessed with a senescence β-gal staining kit (Cell Signaling Technology) according to the manufacturer’s instructions. The percentage of senescent cells was represented by the number of stained cells in the total population.
Immunoblotting assay
Proteins were extracted, separated by 10% Tris-glycine on SDS-PAGE, transferred to an Immobilon membrane (Millipore), and then incubated with primary antibodies against p53, p21, and GAPDH (1:1000, Santa Cruz Biotech, Santa Cruz, CA, USA), followed by incubation with peroxidase-conjugated secondary antibody (1:2000, Santa Cruz Biotech). The membrane was then treated with EZ-Western Lumi Pico (DOGEN, Seoul, Korea) and visualized using ChemiDoc XRS+ system (Bio-Rad, Hercules, CA, USA).
Adipogenic differentiation
BMSCs (2×10⁴ cells/cm2) were seeded in 6-well plates and cultured for 1 week. The medium was then changed to an adipogenic medium [10% FBS, 1 μM dexame-thasone, 0.5 mM 3-isobutyl-1-methylxanthine, 10 μg/ml insulin, and 100 μM indomethacin in high glucose (HG)-DMEM] for an additional 3 weeks. Cells were fixed in 4% paraformaldehyde for 10 min, stained with fresh Oil Red O solution to stain the lipid droplets, and photographed. Oil Red O was then eluted with isopropanol, and the extracted Oil Red O was quantitated by measuring the absorbance at 540 nm.
Mitochondria DNA (mtDNA) assay
Total genomic DNA of BMSCs were isolated using QIAamp DNA Mini Kit (Qiagen, Germantown, MD, USA), and mtDNA was analyzed using Absolute Human Mitochondrial DNA Copy Number qPCR kit (Sciencell Research Laboratories, Carlsbad, CA, USA), according to the manufacturer’s instructions.
Mitochondrial membrane potential (MMP) assay
MMP was measured using the lipophilic cationic dye 5,5’,6,6’-tetrachloro-1,1’,3,3’-tetraethylbenzimidazolylcar-bocyanine iodide (JC-1, Molecular Probes, Thermo Fisher Scientific). BMSCs were seeded and treated for 4 h with carbonyl cyanide-4-(trifluoromethoxy)phenylhydrazone (FC CP) or vehicle control (dimethyl sulfoxide). The fluorescence intensity for both aggregates and monomer of JC-1 was measured with a fluorescence microplate reader (Flexstation II, Molecular Devices, San Jose, CA, USA; JC-1 aggregates: excitation/emission=540/590; JC-1 monomer: excitation/emission=490/535).
ATP assay
BMSCs were lysed with the cell lysis reagent supplied in ATP Bioluminescence assay kit HS II (Roche Diag-nostic GmbH), and the lysates were centrifuged to recover the supernatant. After the reaction, ATP levels were measured with a microplate luminometer (Synergy 2, Bio-Tek Ins-trument, Winooski, VT, USA) and normalized to the protein concentration.
Oxygen consumption rate measurement
BMSCs were plated on Seahorse 96 well plate (Agilent Technologies, Cedar Creek, TX, USA). After 24 h, cells were changed to XF DMEM medium containing 1 M glucose, 100 mM pyruvate, and 200 mM L-glutamate (pH 7.4, Agilent Technologies) and were maintained at 37℃ without CO2 for 1 h. Oxygen consumption rate (OCR) was evaluated by Seahorse XF kit and Seahorse XFe96 Analyzer (Agilent Technologies), and normalized by protein concentration. The cycles (three times for 3 min) were run for every measurement, and the Mitostress kit (Agilent Technologies) was used that contained 2 μM oligomycin (ATP synthase inhibitor), 2 μM FCCP (mitochondrial uncoupler), 0.5 μM rotenone (respiratory chain complex I inhibitor), and antimycin A (complex III inhibitor).
Reactive oxygen species (ROS) quantification
ROS generation was evaluated using 5-(-6)-chloro-methyl-2’,7’-dichlorodihydrofluorescein diacetate, acetyl ester (CM-H2DCFDA; Invitrogen, Eugene, OR, USA). After CM-H2DCFDA incubation, fluorescence was measured at the excitation and emission wavelengths of 485 and 538 nm, respectively, by using a fluorescence microplate reader (Flexstation II, Molecular devices).
Statistical analysis
Data are presented as the mean±standard error of the mean. To compare group means, Student’s t-test and one-way analysis of variance were used, followed by the Scheffe’s test. Any difference was considered statistically significant at *p<0.05, **p<0.005, and ***p<0.0001.
Go to :
Results
Cell surface antigen expression
Representative positive cell surface antigens of MSCs are CD73, CD90, and CD105 (22), and approximately 99% of positive cells in both BCs and BPs at passage 3 (P3) expressed all these antigen (Fig. 1A). Furthermore, there was no statistically significant difference in mean fluorescence intensities (MFI) of CD73, CD90, and CD105 in BCs and BPs, suggesting comparable expression of cell surface antigens on these BMSCs (Fig. 1B).
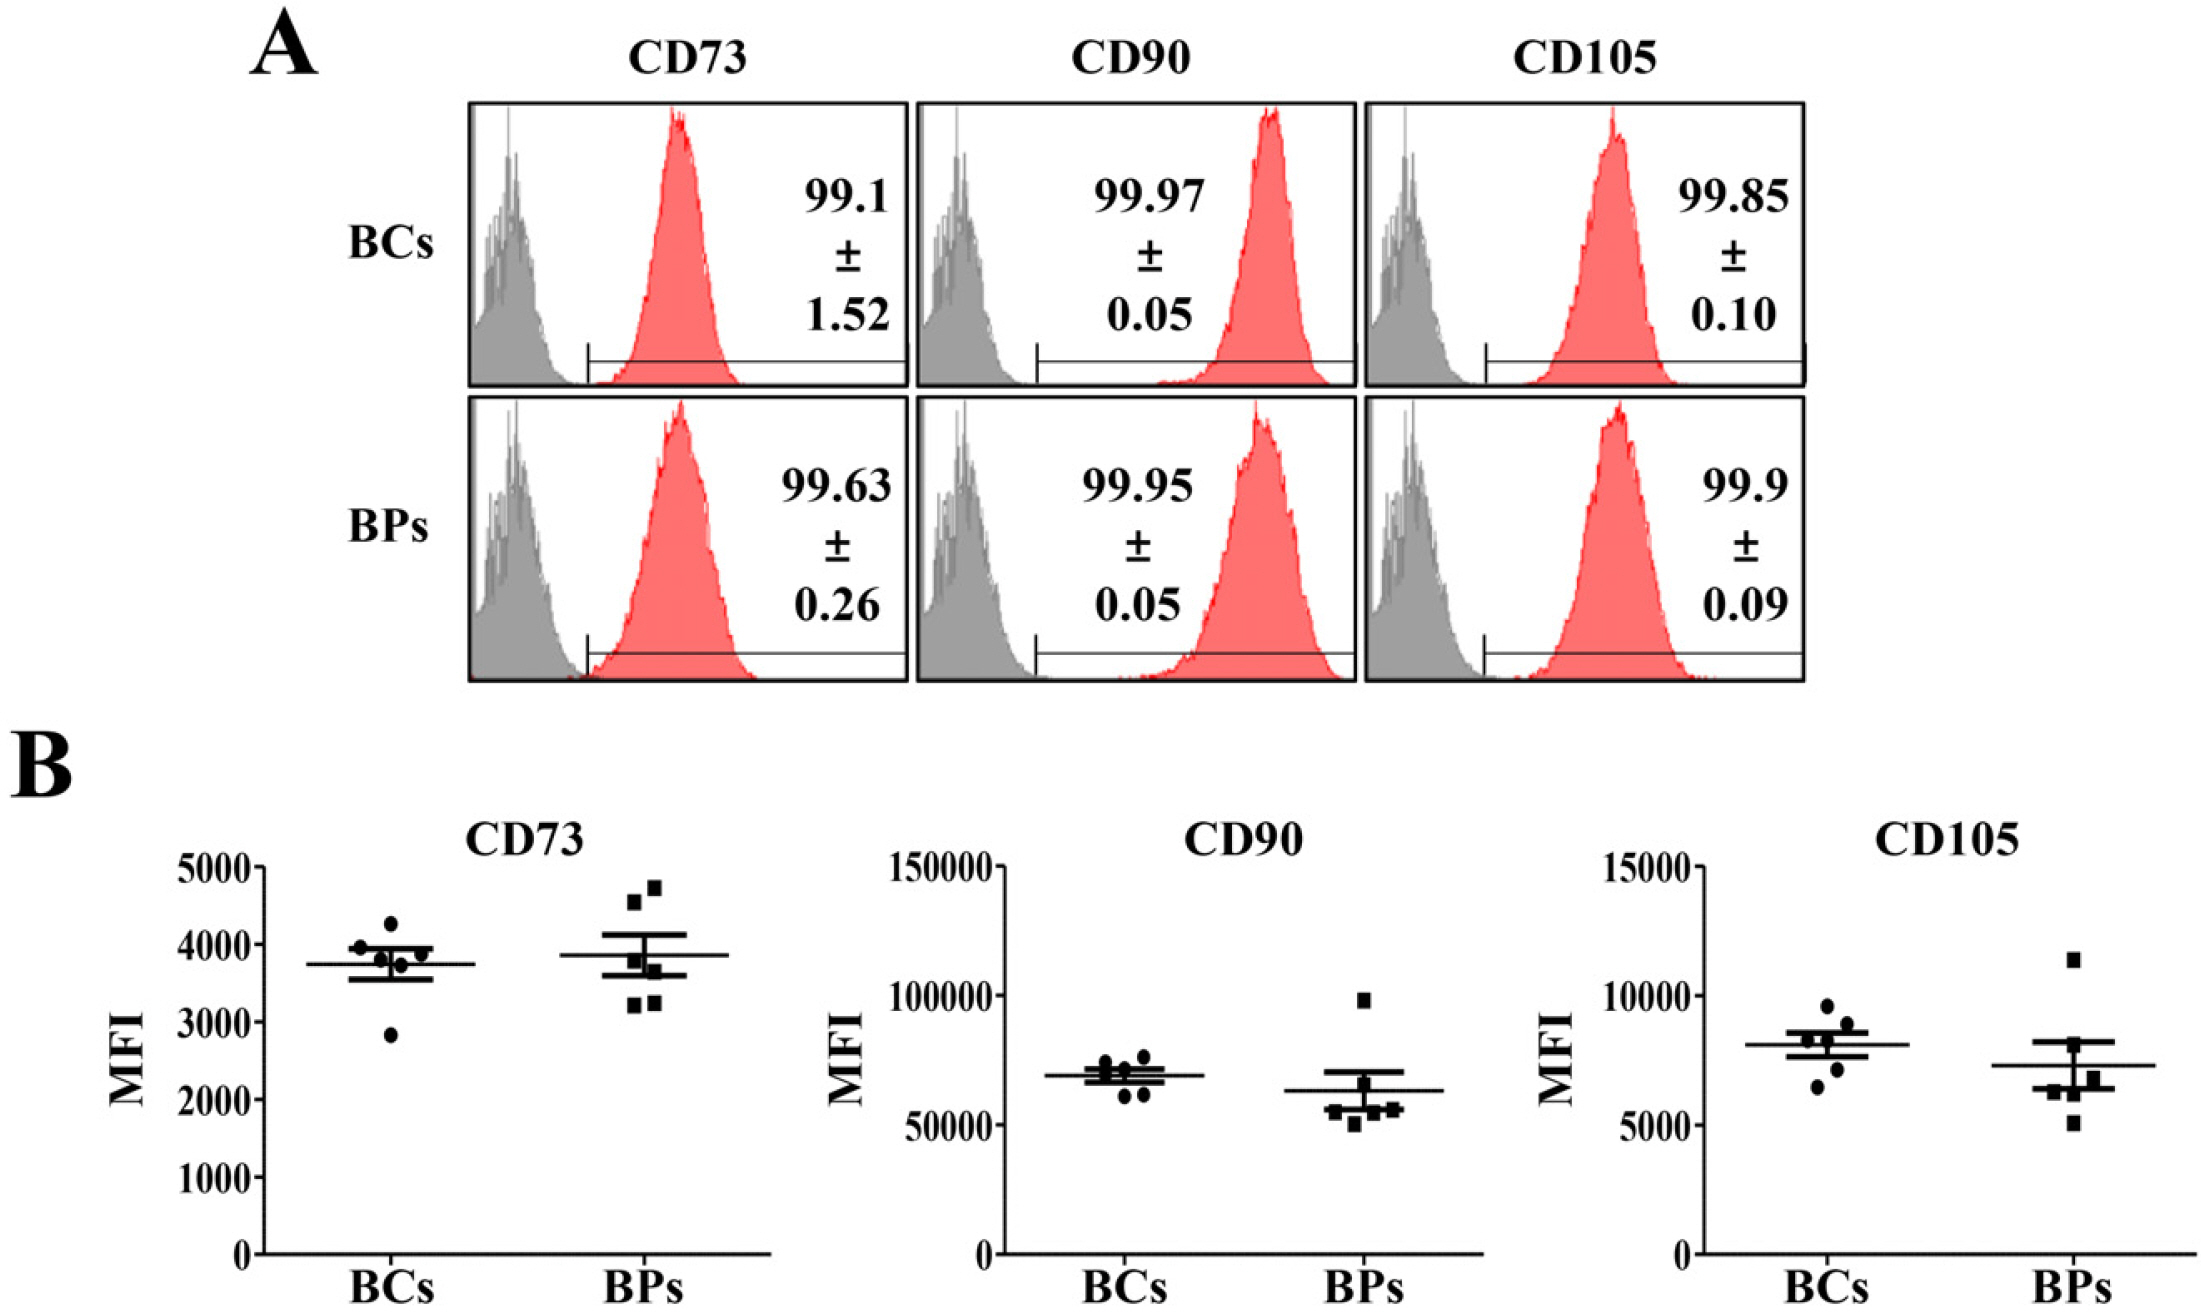 | Fig. 1Positive cell surface markers of BCs and BPs. Positive cell surface markers (CD73, CD90, and CD105) in passage 3 of BCs and BPs were analyzed by flow cytometry, and mean fluorescence intensity (MFI) was compared in BCs and BPs. (A) Positive expression of BMSC markers. (B) MFI of positive cell surface mar-kers. All data are shown as the mean± SE, n=6.
|
Proliferation potentials of BCs and BPs
To compare the proliferation potential of BCs and BPs, we analyzed the average PDT at P3, P4, and P5, the early passages, and calculated the total cumulative cell number obtained after serial passage until the PDT of each BMSC reached 150 h. Besides, we analyzed the mean expression levels of Nanog, Oct4, and Sox2, stemness regulators in P3, P4, and P5. The mean PDT of BPs (65.3±11.1 h) at the early passage was significantly shorter than that of BCs (83.7±9.2 h), but the average total cumulative number of cells was higher in BCs (5.97×10⁷ cells) than in BPs (4.90±107 cells); however, the difference was not significant (Fig. 2A∼C). Furthermore, no differences in expressions of stemness regulators between BCs and BPs were observed in the early passage (Fig. 2D∼F). To evaluate whether the lower PDT in BPs is a common phenomenon in cirrhosis disease, we investigated the colony forming unit–fibroblast (CFU-F) in normal and cirrhotic SD rat. Interestingly, much more colony formation was observed in the bone marrow of thioacetamide-induced cirrhotic rats than normal rats, and colony size was larger in cirrhotic rats than in normal rats (Fig. 2G). These results suggest that pathologic conditions with fibrosis and inflammation, such as cirrhotic changes, may promote the proliferation of stem cells.
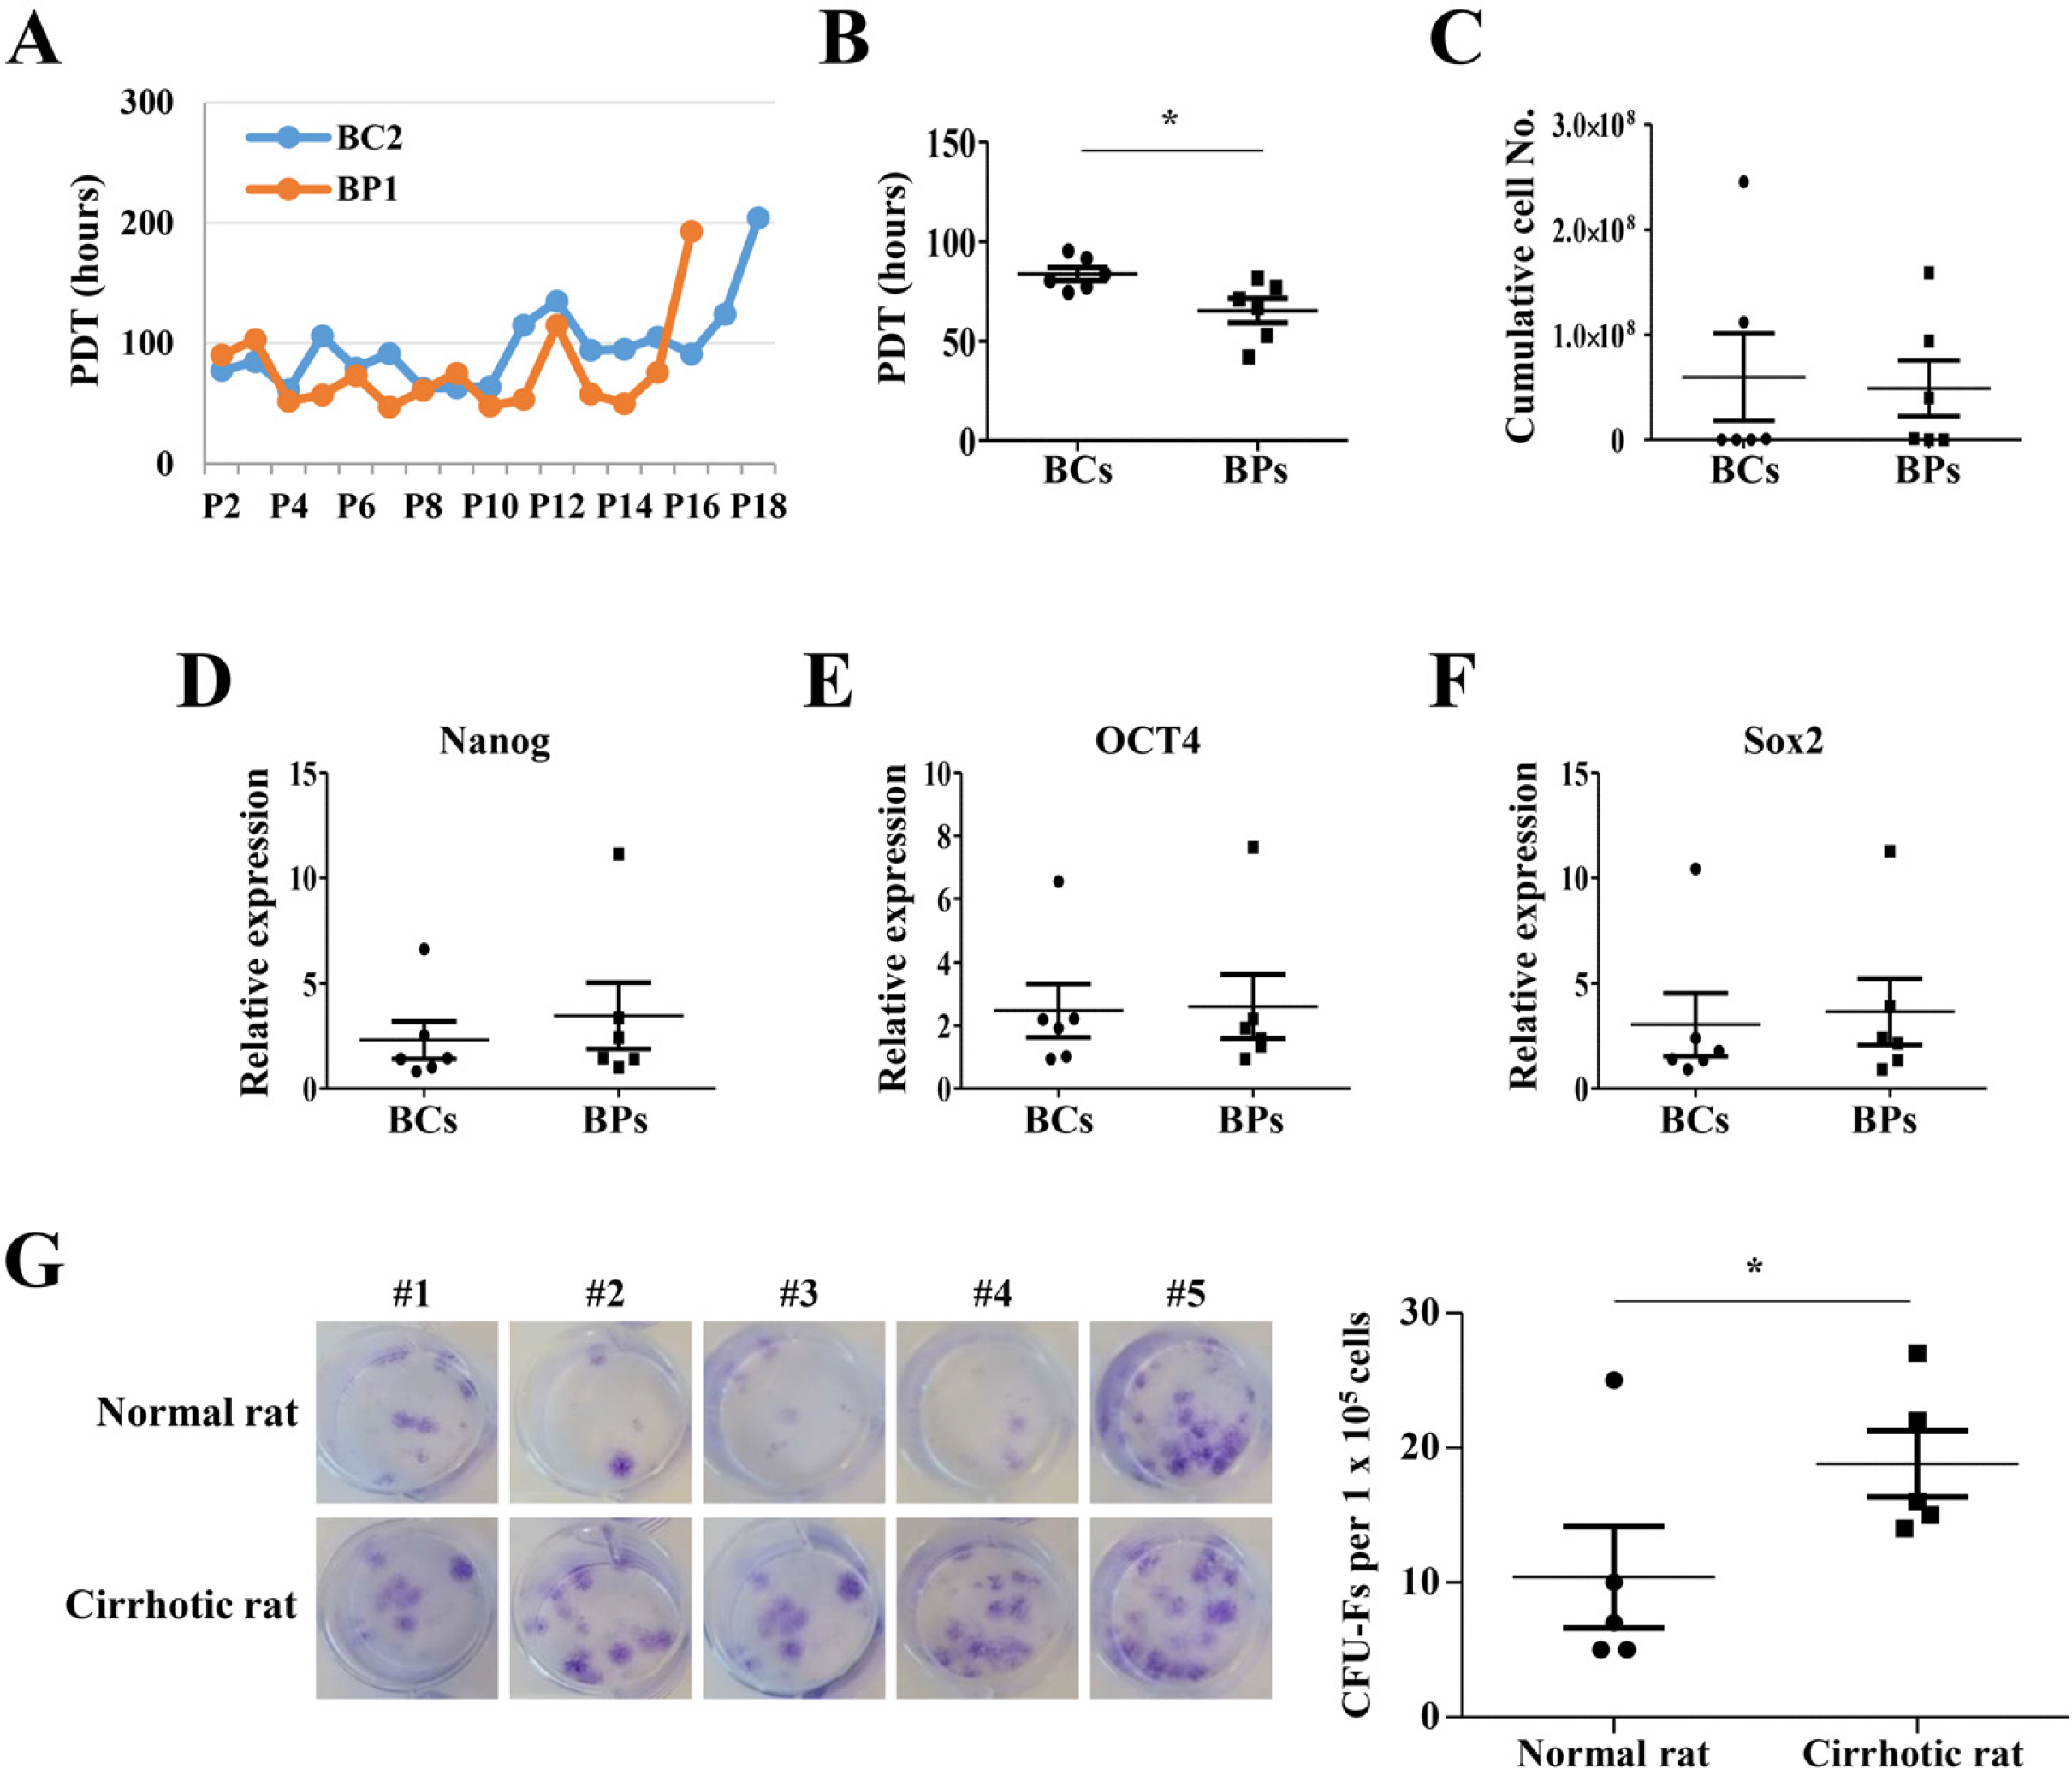 | Fig. 2Proliferation potentials of BCs and BPs. (A) Representative PDT changes in BC2 and BP1 during serial passages. (B) Mean PDT of P3, P4, and P5. *p<0.05 (n=6). (C) Cumu-lative cell number, (D∼F) Expression of transcription factors (Nanog, OCT4, Sox2) regulating proliferation. Expre-ssion level was evaluated by qPCR. n=6. (G) Colony forming unit–fibroblast (CFU-F) in normal and cirrhotic SD rat. The CFU-F units counted using a microscope. *p<0.05 (n=5). We defined a CFU-F unit as a colony consisting of more than 100 cells. All data are shown as the mean±SE.
|
Cellular senescence of BCs and BPs
At P3, senescent cells formed 11.22±7.03% and 19.06±3.55% in BCs and BPs, respectively (Fig. 3A). Consistently, p21 and p53 expression was significantly higher in BPs than in BCs (Fig. 3B). Despite the shorter PDT in the early passage, there were 1.7 times more aging cells in the BP group.
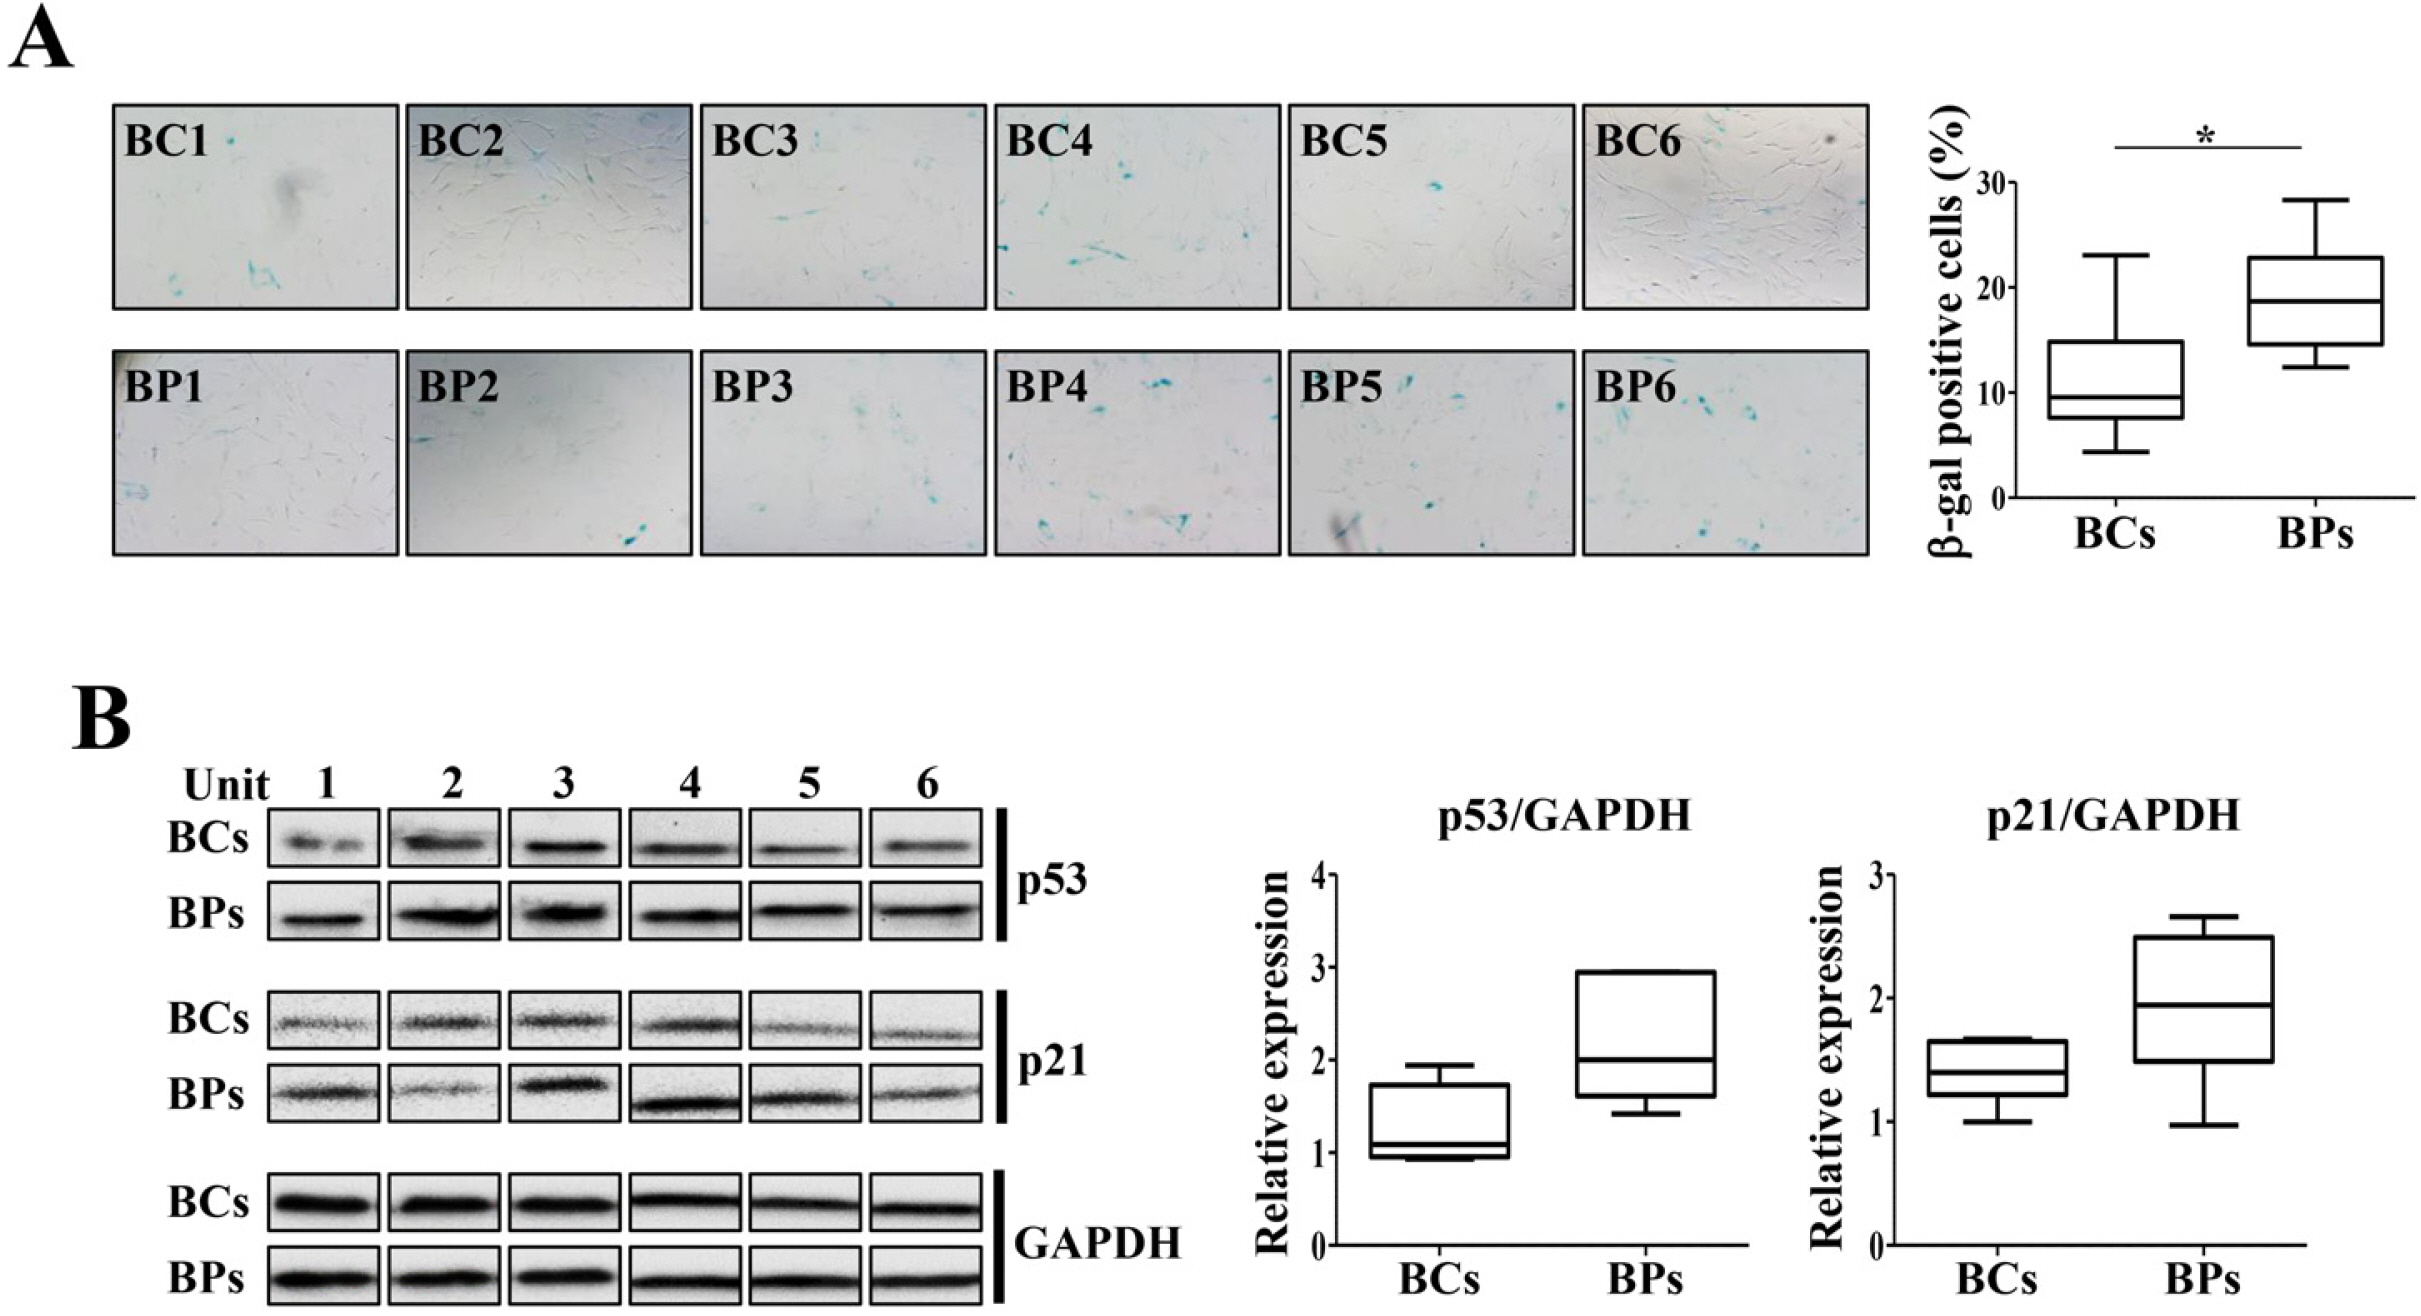 | Fig. 3Cellular senescence of BCs and BPs. BCs and BPs of passage 3 were used to detect the cellular senescence and expression of its markers, p21 and p53. (A) SA-β-gal activity in P3 of BCs and BPs. SA-β-gal-positive cells were photographed (100× magnification) with a phase - contrast microscope and enumerated. At least 200 cells were counted from six different fields, and the percentage of positive cells is shown. *p< 0.05 (n=6). (B) Expression of senescence regulators, p21 and p53. All data are shown as the mean±SE (n=6).
|
Adipogenic differentiation potentials of BCs and BPs
As the passage of MSCs progressed, the differentiation ability of adipocytes decreases gradually (23). We compared the differentiation capability of BCs and BPs in the early passage into adipocytes. More lipid droplets following differentiation were microscopically observed in BCs than in BPs (Fig. 4A). On measuring the degree of differentiation by the absorbance of Oil Red O extracted with isopropanol, the absorbance of BCs was significantly higher than that of BPs. When leptin, PPARγ, and C/EBPα expressed in adipocytes were identified by qPCR, the expression level of adipocyte-related genes in both groups was not significant (Fig. 4B).
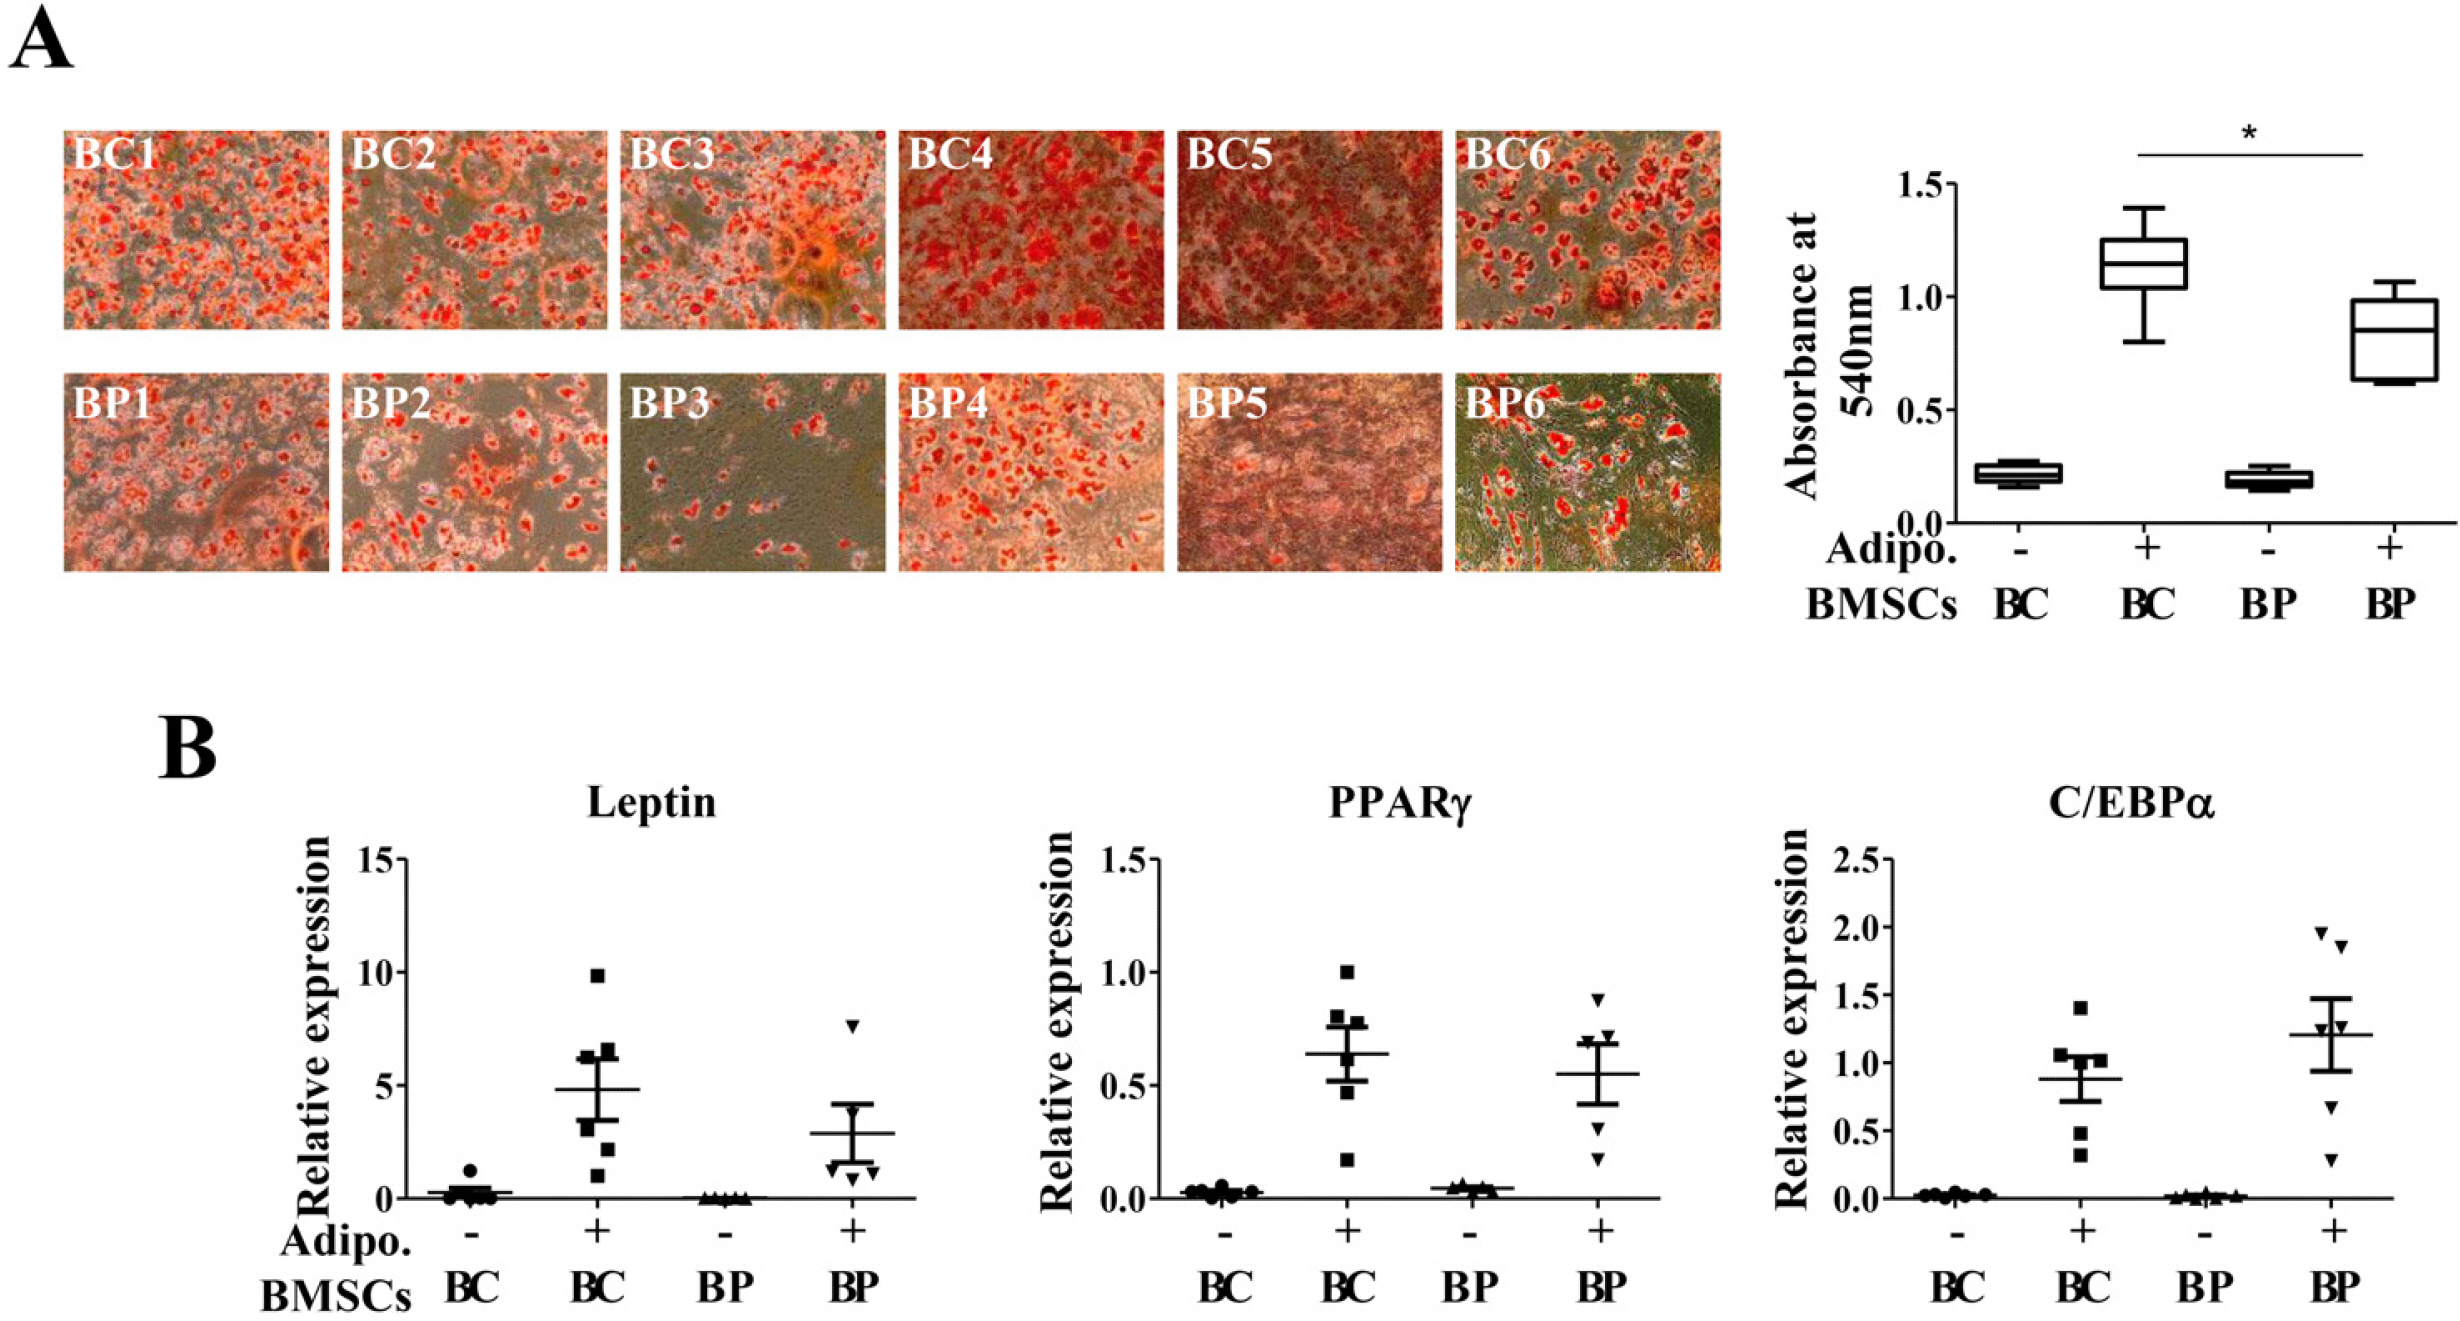 | Fig. 4Adipogenic differentiation potentials of BCs and BPs. BCs and BPs at passage 3 were differentiated into adipocytes and stained with Oil Red O stain. *p<0.05. Adipogenesis was also evaluated by qPCR to detect adipogenic markers, Leptin, PPARγ, and C/EBPα. (A) Oil Red O staining. (B) qPCR for Leptin, PPARγ, and C/EBPα. All data are shown as the mean±SE (n=6). Adipo.: adipogene-sis.
|
Parameters for mitochondrial function in BCs and BPs
Mitochondria is bioenergetically important for ATP production (24) and also generates ROS and activates apoptosis (25, 26). To compare the mitochondrial activities of BCs and BPs, we analyzed mtDNA copy number, MMP, OCR, and ROS generation. There was no significant difference between mtDNA copy numbers in BCs and BPs, and in fact increased variations were observed in individual BPs (Fig. 5A). The JC-1 fluorescence ratio of J-aggregates and monomer reflects the MMP, which was slightly lower in BPs (1.99±0.28) than in BCs (2.24±0.18) but not significant (Fig. 5B). FCCP-induced depolarization was similar between BCs (0.69±0.10) and BPs (0.68±0.11). ATP production was significantly higher in BCs (43.72±5.95 nmol/mg protein) than in BPs (30.70±8.45 nmol/mg protein) (Fig. 5C). The expression levels of mitochondrial proteins including MT-CO1, Tfam, and SDHB were not different between BCs and BPs (Fig. 5D∼F). As a sensitive indicator of mitochondrial activity, we measured mitochondrial OCRs in the basal state and maximal stimulation. Mitochondrial respiratory activities were not significantly different between BCs and BPs (Fig. 5G∼I). Additionally, although not significant, the expression of antioxidant genes, CAT, GPX1, and MnSOD, were slightly higher in BPs than in BCs (Fig. 5J∼L). Unlike the expression of antioxidants, ROS generation in the basal state and after H2O2 treatment was lower in BPs than in BCs, implying less oxidative stress in BPs (Fig. 5M).
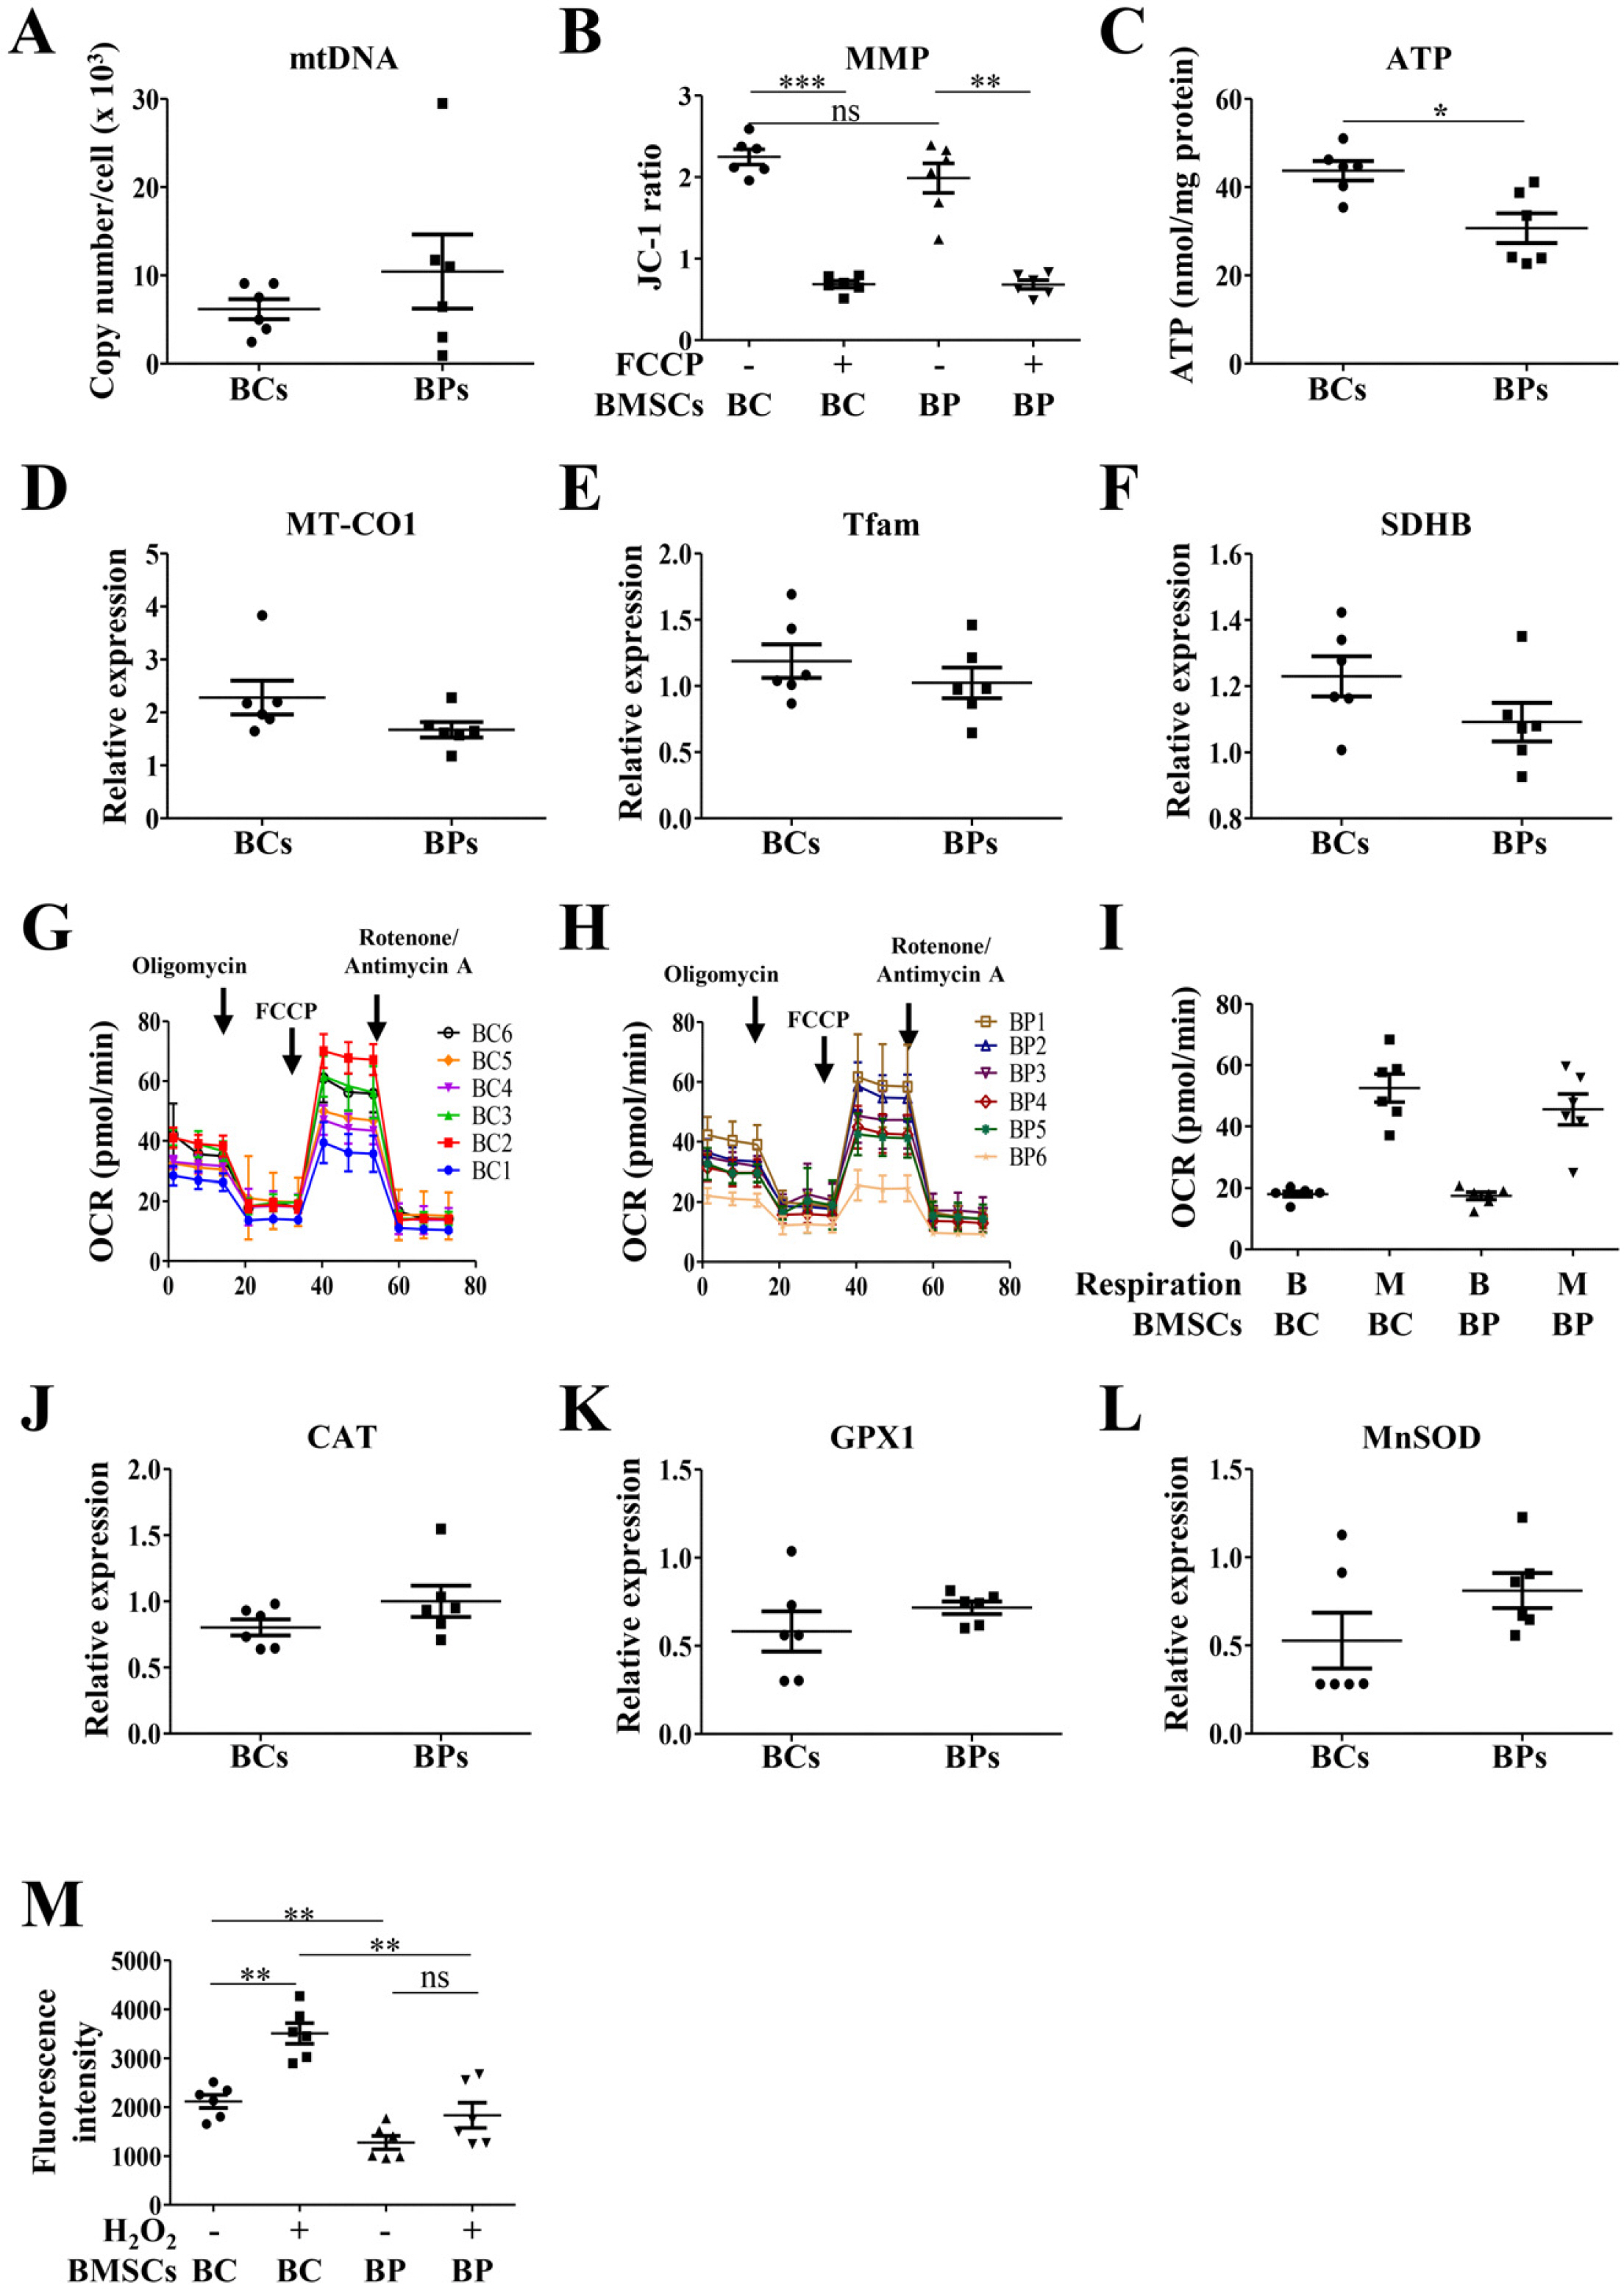 | Fig. 5Parameters for mitochondrial activities of BCs and BPs. To analyze parameters for mitochondrial activities, BCs and BPs at passage 3 were used. (A) Mitochondrial DNA (mtD NA) copy number. (B) Mitochondrial membrane potential (MMP), **p< 0.01 and ***p<0.001. (C) ATP ge-neration. (D∼F) Mitochondrial biogenesis related-gene expression. (G) OCR of BCs. (H) OCR of BPs. (I) Relative OCR in BCs and BPs. (J∼L) ROS-regulating gene expression. (M) ROS generation. **p<0.01. All data are shown as the mean±SE (n=6).
|
Go to :
Discussion
We report that the PDTs at early passages (P3, P4, and P5) were shorter in BPs than in BCs, but cellular senescence was slightly higher in BPs. The differentiation potential into adipocytes and ATP synthesis were higher in BCs than in BPs. Although the PDT in BPs at early passage was shorter than that in BCs by approximately 18.4 h, there was no difference in the total cumulative mean cell numbers in BCs and BPs. To our knowledge, a comparison of the proliferation and differentiation characteristics between BMSCs from patients with cirrhosis and healthy volunteers has not been performed yet. Furthermore, for the first time, we have investigated different aspects of mitochondrial activities of MSCs related to stem cell functions derived from patients with chronic cirrhosis.
It is known that senescent cells have high SA-β-gal activity, reduced autophagy, increased G1 cell cycle arrest, augmented ROS production, and expression of p53 and p21 (27). The mitochondrial electron transport chain is an important source of ROS (28) and helps to induce cellular senescence (29-32). We observed that antioxidant expression was higher and total ROS levels in the resting state and upon H2O2 exposure were lower in BPs than in BCs. However, cell senescence was slightly accelerated in BPs, notwithstanding attenuated oxidative stress. BPs had shortened PDT, meaning increased proliferation rate. We infer that BPs may have a heterogeneous population composed of fast-growing and rapidly aging cells. However, their proliferation and differentiation properties were not markedly affected, thus, maintaining regenerative capabi-lities.
Because of heterogeneity, the proliferative capacity of BPs might be underestimated. Indeed, much more colony formation was observed in the bone marrow of thioacetamide-induced cirrhotic rats than normal rats, and colony size was larger in cirrhotic rats than in normal rats. These results suggest that pathologic conditions with fibrosis and inflammation, such as cirrhotic changes, may promote the proliferation of stem cells. Consistent with our observation, Yu et al. (33) reported that macrophages could induce survival and proliferation of MSCs through ERK and AKT signaling pathways via a CD44-dependent mechanism.
No significant differences were observed in MMP, OCR, and mitochondrial biogenesis (i.e., MT-CO1, Tfam, and SDHB) between BCs and BPs, but the cellular ATP levels were marginally reduced in BPs. There is accumulating evidence that ATP content affects stem cell differentiation and proliferation (34-37). Buravkova et al. (34) reported that reduced ATP levels of MSCs in hypoxic conditions increased proliferation. They concluded that even lowered ATP production via glycolysis could be sufficient for the maintenance of MSCs in an uncommitted state. In addition, MSCs in the early passages can release ATP, which can modulate the proliferating property of MSCs that likely acts as one of the early factors determining stem cell fate (35). To understand the functional consequences of ATP reduction in stem cells, further investigation is required.
In summary, firstly, doubling times of BPs were shorter than those of BCs, implying better proliferating ability. Secondly, mitochondrial biogenesis and functions such as MMP, OCR, and mitochondrial biogenesis (i.e., MT-CO1, Tfam, and SDHB) were not significantly altered in BPs. Lastly, there is no evidence that autologous MSCs have lower stem cell function than that of allogenic MSCs in clinical studies. Therefore, we concluded that BMSCs from patients with cirrhosis did not show marked impairment of stem cell functions in regard to proliferation and differentiation. Thus, autologous BMSC transplantation in patients with liver cirrhosis may not have limitations for the quality of stem cells. However, many of our results showed variations among individuals in the BPs as well as the BCs. Therefore, it is necessary to repeat the experiment using additional units of BMSCs. More importantly, further studies need to compare and analyze the characteristics of MSCs with high or low regenerative therapeutic effects. Through these studies, optimal criteria for proliferation, differentiation, and mitochondrial activity of MSCs for clinical application should be established.
Go to :
 XML Download