

 PDF
PDF Citation
 Print
Print


Introduction
Impairment of energy metabolism, muscle weakness, attenuated proliferation and differentiation of skeletal muscle stem cells (SCs) were reported in type 1 diabetes (T1D). Diabetic myopathy, a less studied complication of diabetes, exhibits the clinical observations characterized by a less muscle mass, muscle weakness and a reduced physical functional capacity (1).
Altered cellular Ca2+ handling is evident and a fundamental disorder in streptozotocin (STZ) induced diabetes. Sarco/endoplasmic reticulum Ca2+-ATPase (SERCA) defective homeostasis was proved in STZ-diabetic rats (2). SERCAs are 110 kDa integral membrane proteins responsible for maintaining cytosolic Ca2+ and initiating muscular relaxation through the adenosine triphosphate (ATP)-dependent translocation of Ca2+ into the sarcoplasmic lumen against a concentration gradient thus regulating muscle contraction (3). SERCA1a was recorded to be concerned with regulation of contraction in the skeletal muscle (4).
In diabetes, accumulation of reactive oxygen species (ROS) interferes with normal tissue and organ function. Antioxidants as ascorbic acid (AA) may shift the balance back to antioxidant defense that may protect diabetic tissues from stress by affecting oxidant and antioxidant biomarkers that can be useful in the management of diabetic complications (5). Oyarce et al. (6) assumed induction of SCs differentiation by AA.
Bone-marrow-derived mesenchymal stem cells (BMMSCs) are currently considered among the best candidates in the field of regenerative medicine. The recent advances in the genetic modification of these cells have created new prospects for cell-based therapies. The therapeutic potential of engineered stem cells should ideally be validated in animals due to practical and ethical restrictions (7).
The present study aimed at investigating the hypothesis of possible therapeutic effect of SERCA1a gene transfected BMMSCs on induced type 1 diabetic myopathy in male albino rat and comparing it to that of non-transfected BMMSCs individually or combined with AA.
Go to : 
Materials and Methods
Drugs
Streptozotocin (STZ): was supplied by Sigma Company (St. Louis, Mo, USA) in a powder form as 1 g vial. The required dose was weighed using a digital scale and dissolved in citrate buffer.
Ascorbic acid (AA): was supplied by Development of Chemical Industries (Giza, Egypt) in a 1 g Vitacid C effervescent tablet form. The required doses were weighed using a digital scale and dissolved in water.
Experimental design
This study was conducted on 54 adult male albino rats with average body weight 200 grams, housed according to the ethical guidelines of treatment of animals and were divided into the following.
Donor group
It included 6 rats used for BMMSCs isolation, culture, phenotyping and labeling. In addition, a part of Gastrocnemius muscle was homogenized for SERCA1a preparation.
Group I (control group): It included 8 rats that corresponded to and were sacrificed with the experimental groups II, III, IV and V respectively. The first 2 rats received a single intraperitoneal (IP) injection of 0.5 ml citrate buffer and left for 8 weeks without therapy. The second 2 rats received a single IP injection of 0.5 ml citrate buffer. 4 weeks later, it was given 0.5 ml of phosphate buffered saline (PBS) intravenously via the tail vein twice with 24 hours interval and left for another 4 weeks without therapy. The third 2 rats received citrate buffer and PBS as for the second rat together with daily oral AA dissolved in 0.5 ml water using a syringe without a needle for 4 weeks. The fourth 2 rats received citrate buffer and PBS as for the 2nd and 3rd rats, in addition to 1.5 μl lipofectamine (used for lipid-mediated transfection) (8) via the tail vein twice with 24 hours interval.
Group II (diabetic group): It included 10 rats. Diabetes was induced by a single IP injection of STZ at a dose of 50 mg/kg body weight (9) dissolved in 0.5 ml citrate buffer for each rat. Three days following STZ injection, diabetes was confirmed by measuring the blood glucose level. The animals were considered diabetic if their blood glucose level was higher than 200 mg/dl (10). The rats were left for 8 weeks without therapy.
Group III (BMMSCs group): It included 10 rats, diabetes was induced and confirmed as in group II. Four weeks following STZ injection, 0.5 ml (1/2×106 cells) of cultured and labeled BMMSCs (11) suspended in PBS were injected in the tail vein twice with 24 hours interval (12). The rats were left for another 4 weeks without therapy.
Group IV (BMMSCs and ascorbic acid group): It included 10 rats, diabetes was induced and confirmed as in group II. Four weeks following STZ injection, 0.5 ml of cultured and labeled BMMSCs were suspended and injected as in group III. Combined daily oral administration of 500 mg/kg of AA (13) dissolved in 0.5 ml of water was performed for each rat for another 4 weeks using a syringe without a needle.
Group V (SERCA1a transfected BMMSCs): It included 10 rats, diabetes was induced and confirmed as in group II. Four weeks following STZ injection, 0.5 ml of cultured, labeled and SERCA1a transfected BMMSCs were isolated, suspended and injected as in group III. Lipofectamine 3000 transfection (8) of cultured and labeled BMMSCs by SERCA1a (4) was performed. The rats were left for another 4 weeks without therapy.
In vitro studies
Isolation and propagation of BMMSCs from rats (14): Under sterile conditions, the femur and tibia of rats were excised, and all connective tissue attached to bones was removed with special attention. Bone marrow was harvested by flushing the tibiae and femurs with Dulbecco’s modified Eagle’s medium (DMEM), (GIBCO/BRL) supplemented with 10% fetal bovine serum (FBS) (GIBCO/BRL). Nucleated cells were isolated with a density gradient [Ficoll/Paque (Pharmacia)] and resuspended in complete culture medium supplemented with 1% penicillin-streptomycin (GIBCO/BRL). Cells were incubated at 37℃ in 5% humidified CO2 for 12∼14 days as primary culture or upon formation of large colonies. When large colonies developed (80∼90% confluence), cultures were washed twice with PBS and cells were trypsinized with 0.25% trypsin in 1 millimolar EDTA (GIBCO/BRL) for 5 minutes at 37℃. After centrifugation (at 2400 rpm for 20 minutes), cells were resuspended with serum-supplemented medium and incubated in 50 cm2 culture flask Falcon). The resulting cultures were referred to as first-passage cultures. On day 14, the adherent colonies of cells were trypsinized, and counted.
Characterization of BMMSCs: Adherent cells (at the end of 3rd passage) were trypsinized and adjusted to 1×10⁶ cells/ml determined by hemocytometer and incubated with 10 μl of monoclonal antibodies: CD34 and CD105 (Beckman coulter, USA) at 4℃ in the dark. After 20 minutes incubation, 2 ml of PBS containing 2% fraction crystallizable solution (FCS) were added to each tube of monoclonal treated cells. The mixtures were then centrifuged for 5 minutes at 2500 rpm followed by discarding the supernatant and resuspending cells in 500 μl PBS containing 2% FCS. Cell analysis was performed using CYTOMICS FC 500 Flow Cytometer (Beckman coulter, FL, USA) and analyzed using CXP Software version 2.2 (12). Immunohistochemical characterization was performed by using streptavidin immunoperoxidase technique for CD105 and CD34 (15).
Labeling of BMMSCs with PKH26 dye (16): Non-transfected BMMSCs cells were harvested during the 4th passage and were labeled with PKH26 fluorescent linker dye to be examined by fluorescent microscope.
SERCA1a preparation: Gastrocnemius tissues were homogenized in a solution containing (mM) 250 sucrose, 5 hydroxyethylpiperazine-N’-2-ethanesulfonic acid (HEPES) and 0.2 phenylmethanesulfonyl fluoride (PMSF), using a Polytron homogenizer. Ca2+-dependent Ca2+-ATPase activity in homogenates was measured at 37℃. The data were analyzed by nonlinear regression with computer software (GraphPad Software). Processing for ribonucleic acid (RNA) extraction was followed by using reverse transcriptase (for complementary DNA (cDNA) synthesis of SERCA1a (17).
Lipofectamine3000 transfection (8) and characterization of transfected cells (18): The cells were plated at a confluency of 50% (500,000 cells/plate) one day prior to transfection. 1.5 μl Lipofectamine 3000 reagent (Invitrogen) was used for transfection of 1.5 μg SERCA1a gene labeled with green fluorescent protein (GFP) using serum-free DMEM. GFP directly fuses to selected locations on SERCA1a. Culture media were changed 4 hours after transfection and replaced with DMEM/10% FBS without antibiotics. To assess transfection efficiency, cells labeled with GFP are first visualized via fluorescence microscopy for qualitative assessment of protein expression, morphology and viability. Cells were then prepared for flow cytometry by aspirating the medium and replacing it with 250 μl of a 7:3 mixture of TrypLE reagent: 1× DPBS. Cells were incubated at 37℃ for 10 min and then pipetted up and down to ensure single cells for flow cytometry analysis. The cells were then allowed to proliferate and differentiate in DMEM/2% FBS.
Labeling of transfected cells with feridex (19): Transfected BMMSCs cells were harvested during the 4th passage and were labeled with Feridex (25 microgram Fe/ml, Feridex, Berlex Laboratories) in culture medium for 24 hours with 375 nanogram/ml polylysine added 1 hour before cell incubation (evidence of long term overexpression).
Animal studies
Serological study: Before sacrifice tail vein blood samples were collected at the end of the 8th week for blood glucose level estimation.
The animals were sacrificed by cervical dislocation (20). Gastrocnemius specimens were obtained from the hindlimbs and subjected to:
Biochemical study: Half the specimens were kept in the deep freezer for homogenization. 1 gm of muscle was homogenized in 10 ml normal saline by using homogenizer (Ortoalresa, Spain). The homogenates were centrifuged at 1000 ×g for 15 minutes. The supernatant was collected in epindorff tubes that were kept in the deep freezer (at −20℃). DNA fragmentation (21), reduced glutathione (GSH), catalase and malondialdehyde (MDA) (22) were measured in tissue homogenates by using biodiagnostic colorimetric assay kits (Biodiagnostic, Cairo, Egypt). The calcium ion (Ca2+) concentration was assessed after treatment by colorimetric methods according to the kit instructions. The analytical kits were supplied by Quimica Clinica Aplicada SA (Amposta, Spain) (23).
Histological study
The 2nd half of the specimens were fixed in 10% formol saline for 24 hours. Paraffin blocks were prepared and 5 μm thick sections were stained with Hematoxylin and eosin (H&E) (12) and Prussian blue (Pb) stain to demonstrate the injected transfected cells labeled with iron oxide (10). CD105 (559286 Ab, BD Biosciences, San Jose, California, USA) immunostaining, was used for detecting endogenous and exogenous undifferentiated MSCs (24) and CD34 (SAB4300690 Ab, Sigma-Aldrich Chemie Corporation laboratories, Taufkirchen, Germany) immunostaining, for detecting progenitor cells (25) 0.1 ml diluted goat polyclonal 1ry antibodies were applied to sections for 60 minutes. Tonsil sections were considered +ve control and the reaction is membranous.
Morphometric study
Using Leica Qwin 500 LTD (Cambridge, UK) computer assisted image analysis system, assessment of the area (μ2) of pale nuclei of muscle fibers was performed in H&E stained sections using interactive measurements menu. The area percent (%) of CD105 +ve and CD34 +ve cells was measured using binary mode. The measurements were done in 10 high power fields.
Western blot analysis (26): Gastrocnemius tissue was homogenized with a Polytron Homogenizer. Protein content in the samples was measured and adjusted for equal loading. Next, 20 g protein was resolved on a 4∼20% Tris-glycine polyacrylamide gel (Novex, San Diego, CA). After the gel was electrotransferred to a nitrocellulose membrane, the blot was cut in two pieces at a 70-kd marker band. The upper part of the blot was incubated with a polyclonal antibody directed against SERCA1a and the lower part with a mouse monoclonal actin antibody (Affinity BioReagents, Golden, CO). The two parts of the blot were exposed to secondary antibodies carrying horseradish peroxidase (Amersham, Arlington Heights, IL) to drive a chemiluminescence reaction (Amersham, Little Chalfont, U.K.), which was captured on film. Signals on the films were digitized on a 600-dots per inch scanner. Band densities were quantified with the Scion Image Software for PC (Scion, Frederick, MD). The SERCA1a signals were normalized to actin. SERCA1a protein levels were compared in control, diabetic and treated groups.
Quantitative polymerase chain reaction (qPCR): Evaluation of formalin-fixed paraffin-embedded (FFPE) skeletal muscle specimens by qPCR was performed (27). Reverse Transcription is carried out with the SuperScript First-Strand Synthesis System for reverse transcriptase (RT)-PCR. The following procedure is based on Invitrogen’s protocol. The following ribonucleic acid (RNA)/primer (5’-CCT CCA CTT CCT CAT CCT CTA-3’) (3’-A GCC TTG ATG GAC CTC CCT CCA CCA GTG GTG GTG GTG GTG GTG ATT CTC GAG TGA C-5’) (mixture was prepared in each tube: 5 μg total RNA and 3 μl random hexamers). The samples were incubated at 65℃ for 5 min and then on ice for at least 1 min. Reaction master mixture was prepared for each reaction then added to the RNA/primer mixture, mix briefly, and then placed at room temperature for 2 minutes. 1 μl (50 units) of SuperScript II RT was added to each tube, mixed and incubated at 25℃ for 10 min. The tubes were incubated at 42℃ for 50 min, heat inactivated at 70℃ for 15 min, and then chilled on ice. 1 μl RNAase H was added and incubated at 37℃ for 20 min. The 1st strand complementary deoxyribonucleic acid (cDNA) was stored at −20℃ until use for real-time PCR. The primer concentrations were normalized, gene-specific and reverse primer pair were mixed. Each primer (forward or reverse) concentration in the mixture is 5 pmol/μl. The PCR program was set up on ABI Prism standard deviation score (SDS) 7000. A copy of the setup file was saved and all PCR cycles were deleted (used for later dissociation curve analysis). 50℃ 2 min, 1 cycle, 95℃ 10 min, 1 cycle, 95℃ 15 seconds → 60℃ 30 seconds → 72℃ 30 seconds, 40 cycles and 72℃ 10 min, 1 cycle. A real-time PCR reaction mixture can be either 50 μl or 25 μl. After PCR is finished, the tubes were removed from the machine. The PCR specificity was examined by 3% agarose gel using 5 μl from each reaction. The setup file was saved and the real-time PCR result was analyzed with the SDS 7000 software.
Statistical analysis
Any significant ANOVA was followed by Bonferroni post-hoc test to detect which pairs of groups caused the significant difference. The p-values <0.05 were considered statistically significant. Calculations were made on Statistical Package for the Social Sciences (SPSS) version 16.
Go to :
Results
General observations included lethargy and polyurea noticed in diabetic rats that improved in treated groups. Death of 3 diabetic rats was recorded which were compensated.
In vitro data
Characterization of BMMSCs and transfected BMMSCs: BMMSCs appeared mostly spindle in shape, immunostaining showed +ve membranous brownish reaction for CD105 (Fig. 1a) and −ve for CD34 (Fig. 1b). Immunophenotyping of BMMSCs by flow cytometry showed high number of cells +ve for CD105 (Fig. 1c). Transfected cells appeared mostly as spindle fluroscent labeled cells (Fig. 1d). Immunophenotyping of transfected BMMSCs by flow cytometry showed high number of GFP labeled cells (Fig. 1e).
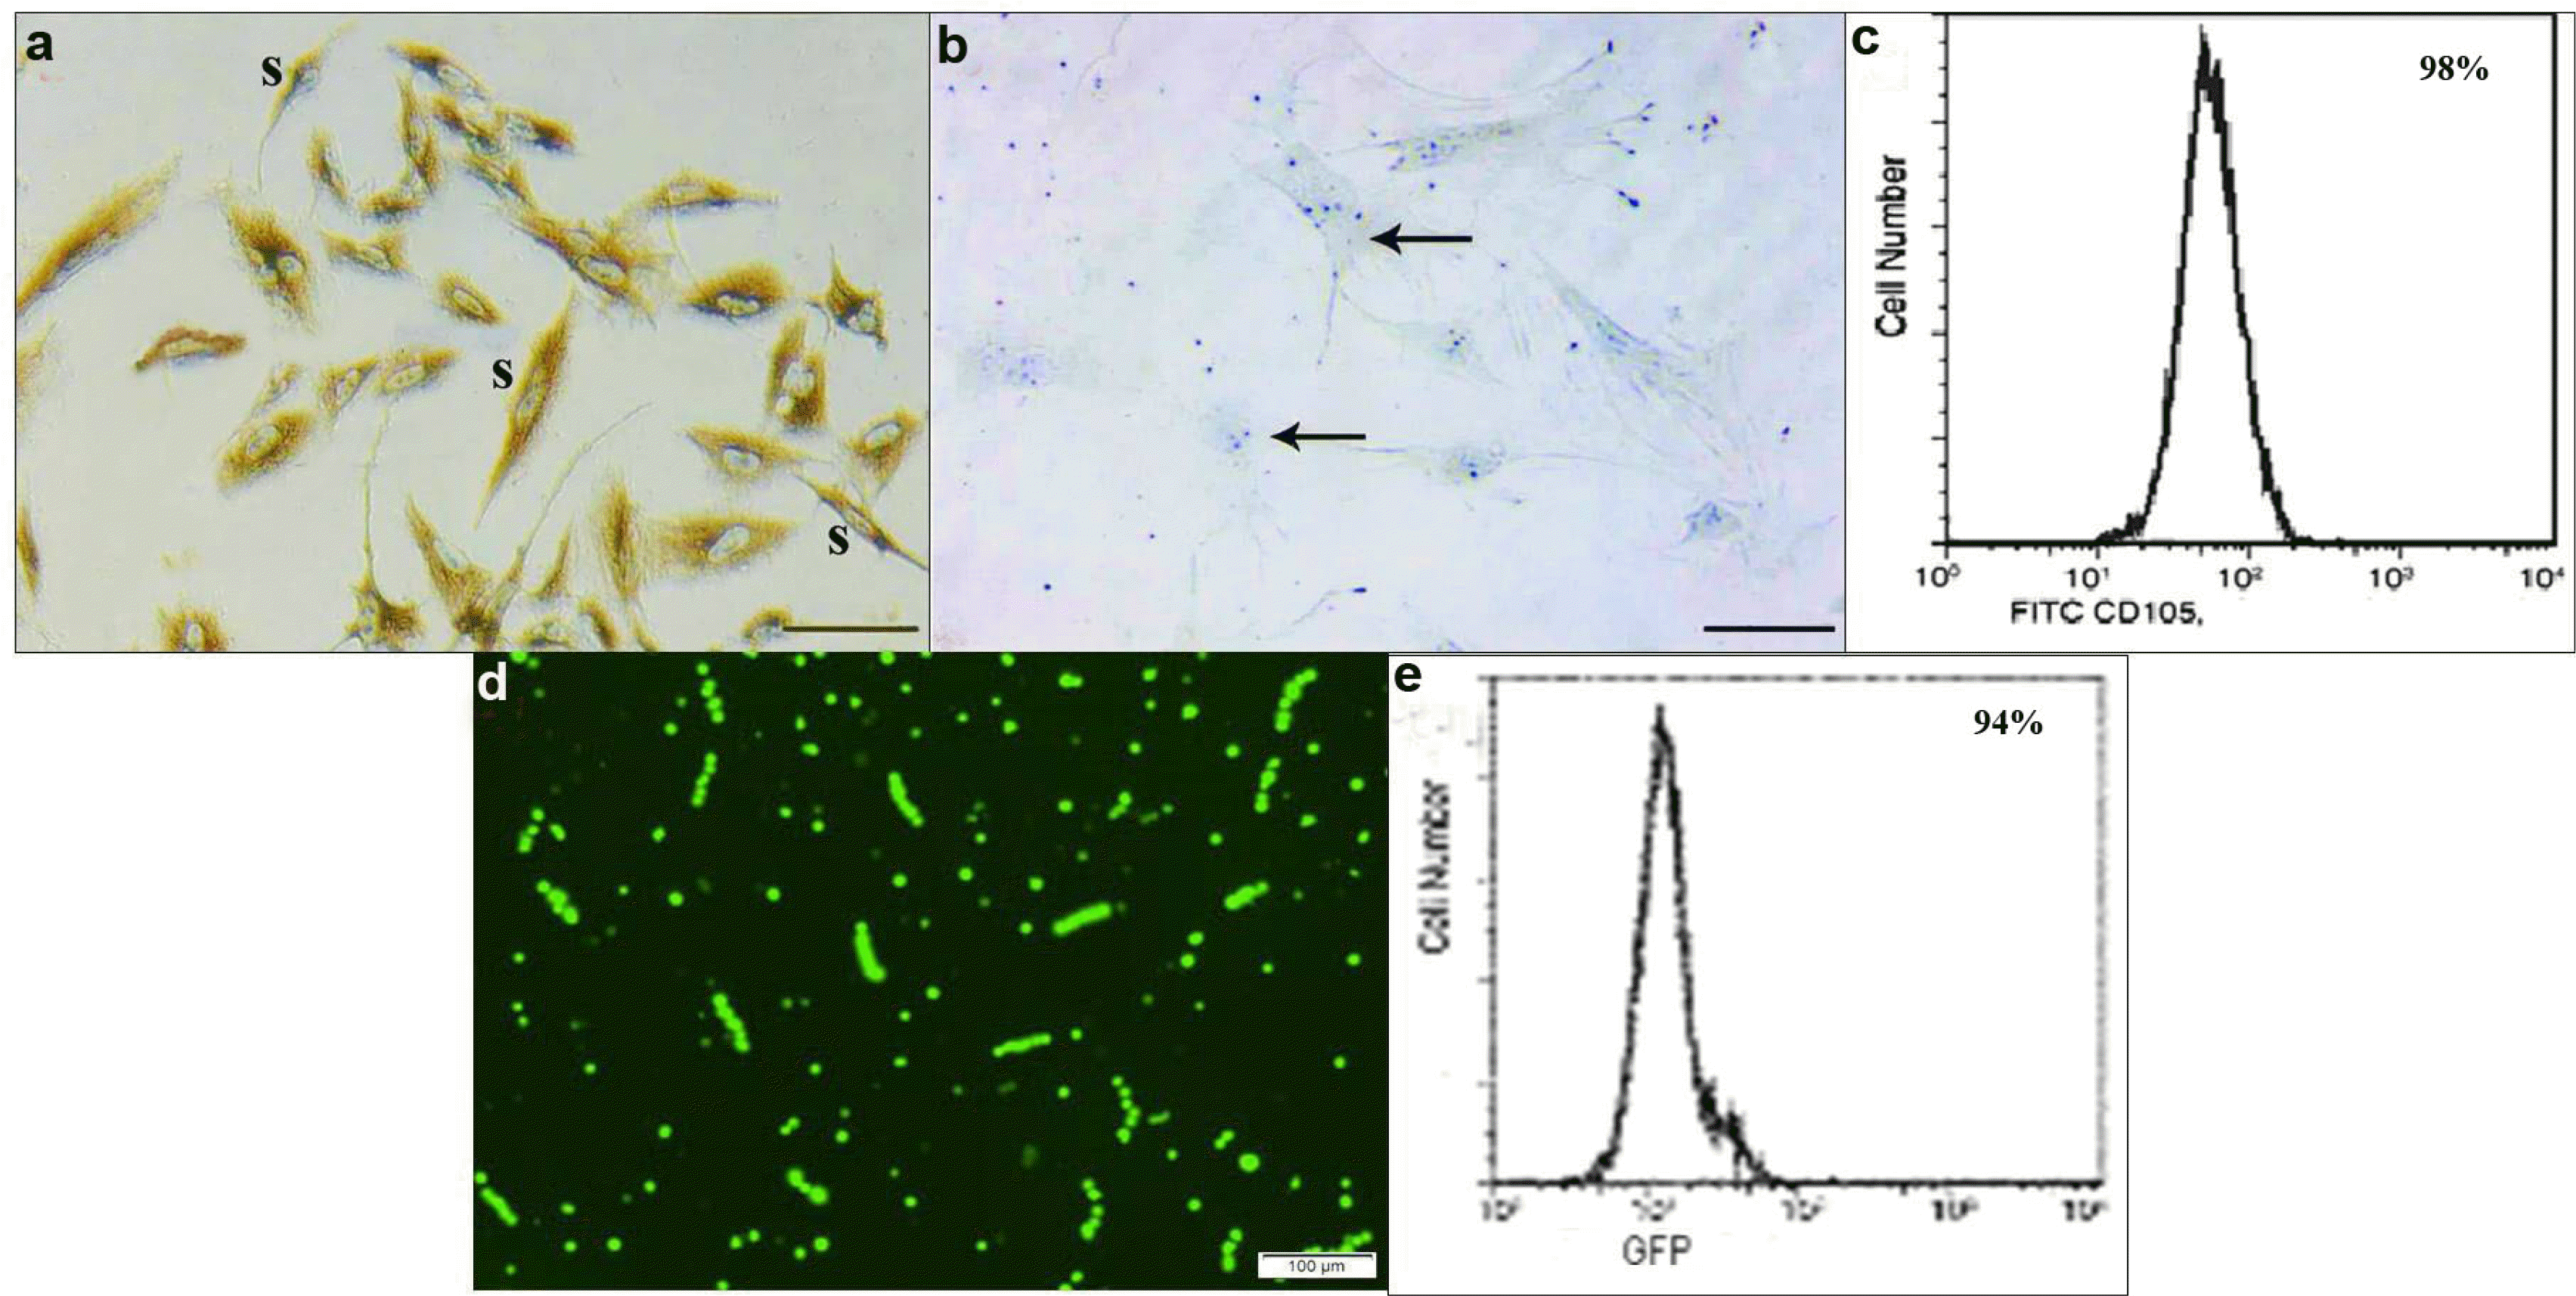 | Fig. 1Showing: (a) CD105 +ve spindle (s) cells. (b) CD34 −ve immunoreactivity (arrows), (Phase contrast microscopy ×100). (c) Immunophenotyping of BMMSCs 98% are +ve for CD105 (Flow Cytometry). (d) Transfected cells appearing mostly as spindle fluroscent labeled cells (GFP ×100). (e) Immunophenotyping of transfected BMMSCs 94% are GFP labeled (Flow Cytometry).
|
Animal data
Mean blood glucose level values were (120±6.48) in the control group, (320±10.30) in the diabetic group, (190±11.05) in BMMSCs group, (165±20.13) in BMMSCs and AA group, (135±8.96) in SERCA1a transfected BMMSCs group, indicating a significant increase (p≤0.05) in the diabetic group before sacrifice compared to the other groups.
Biochemical parameters of oxidative stress (Table 1a): Mean DNA fragmentation and mean MDA values revealed a significant (p≤0.05) increase in the diabetic group compared to all other groups, in BMMSCs group versus control and the other treated groups, in BMMSCs and AA group versus control and SERCA1a group. On the other hand, mean GSH and catalase values recorded a significant (p≤0.05) decrease in the diabetic group compared to all other groups, in BMMSCs group versus control and the other treated groups, in BMMSCs and AA group versus control and SERCA1a group.
Table 1a
Mean±standard deviation (SD) DNA fragmentation (fr)%, MDA, GSH, catalase and calcium concentration (conc) values in control and experimental groups
| Group | DNA fr% | MDA (nM/gm) | GSH (mg/gm) | Catalase (U/gm) | Ca2+ conc (nM/gm) |
|---|---|---|---|---|---|
| Group I | 10.24±0.53 | 29.24±3.22 | 68.76±8.04 | 34.42±3.93 | 89.89±5.90 |
| Group II | 63.88±4.02* | 79.32±4.50* | 19.41±3.22* | 10.97±1.57* | 247.39±10.86* |
| Group III | 38.02±3.91# | 58.56±6.03# | 33.93±5.58# | 20.57±2.03# | 196.94±13.00# |
| Group IV | 22.33±2.83@ | 45.08±5.08@ | 52.77±7.03@ | 26.31±5.01@ | 143.81±15.03@ |
| Group V | 11.38±0.14 | 31.93±3.66 | 66.90±5.99 | 29.81±4.83 | 98.40±8.51 |
![]()
Skeletal muscle Ca2+ concentration (Table 1a): Mean calcium concentration values indicated a significant (p≤0.05) increase in the diabetic group compared to all other groups, in BMMSCs group versus control and the other treated groups, in BMMSCs and AA group versus control and SERCA1a group.
Histological phenotyping: Sections in the skeletal muscle of all control rats showed fibers exhibiting peripheral nuclei and acidophilic sarcoplasm (Fig. 2a), regular transverse striations, pale nuclei and flat satellite cells close to the sarcolemma (Fig. 2b). Sections of diabetic rats revealed multiple atypical widely separated fibers, few disrupted fibers, dark nuclei and few central nuclei (Fig. 2c). Multiple disrupted widely separated atypical fibers with no obvious striations, few central pale nuclei and multiple macrophages in between were evident in other fields (Fig. 2d).
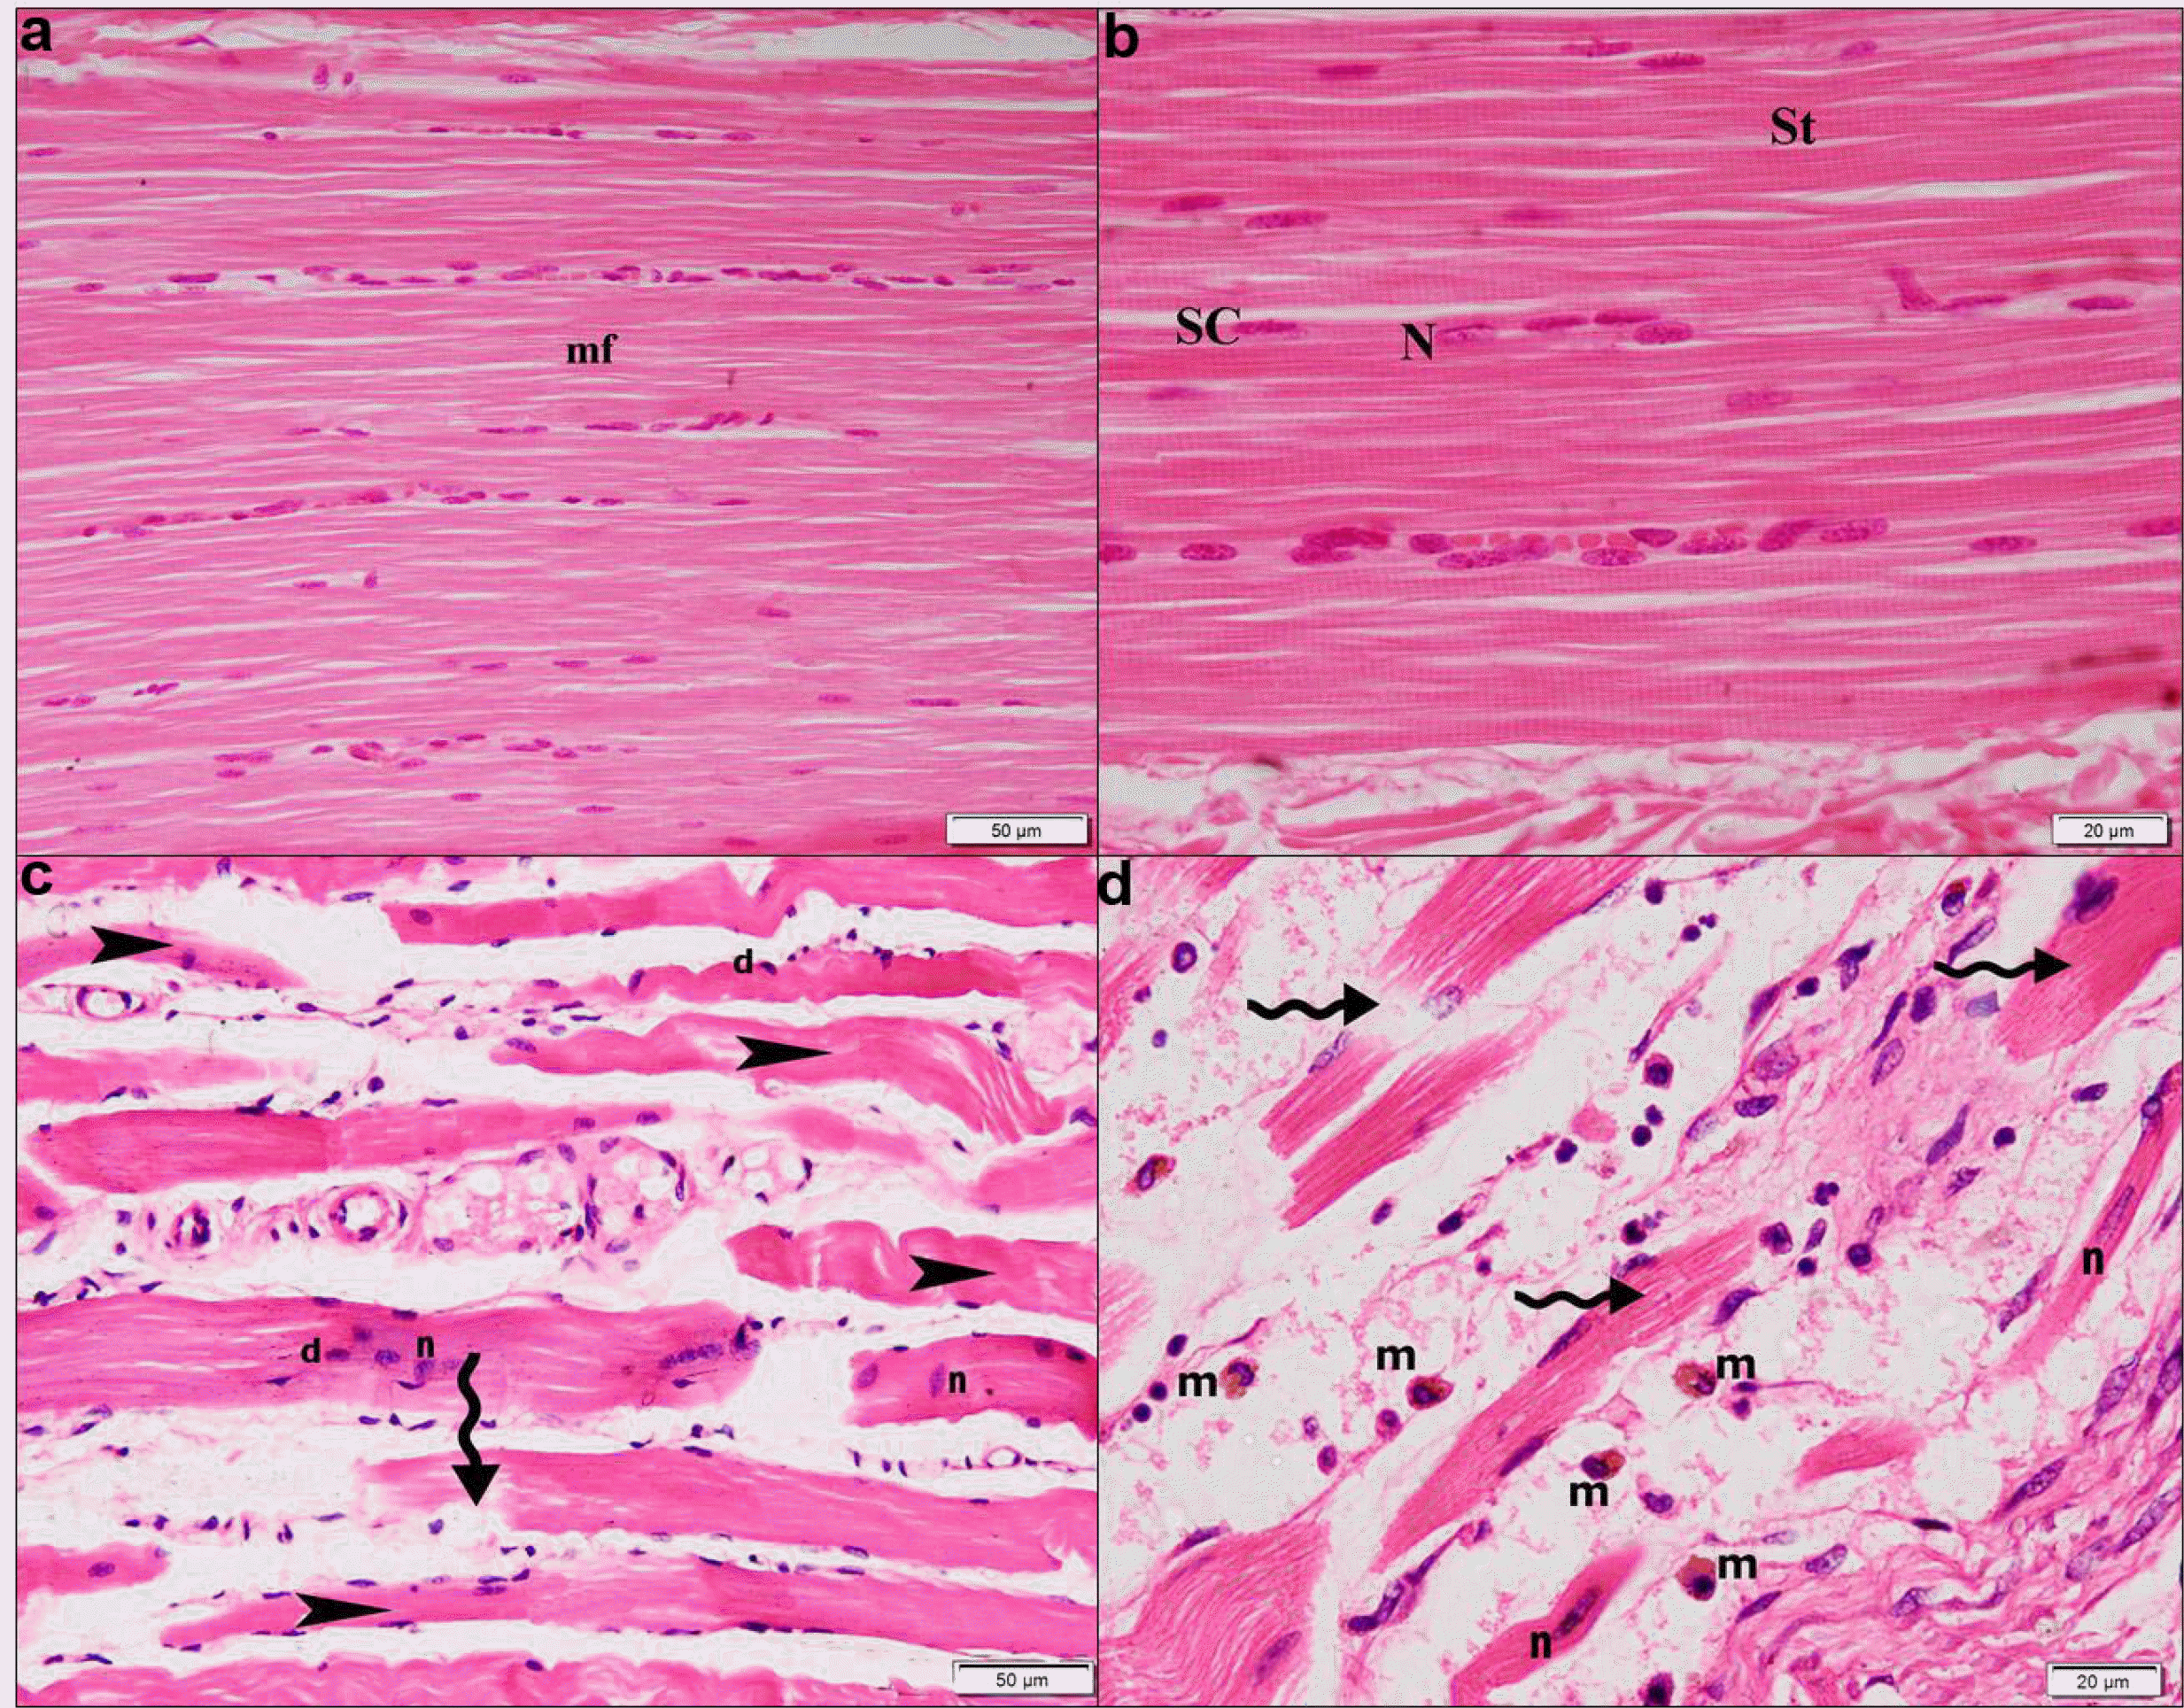 | Fig. 2H&E stain. Group I showing (a) fibers (mf) exhibiting peripheral nuclei and acidophilic sarcoplasm, (×200). (b) Fibers exhibiting regular transverse striations (St), pale nuclei (N) and satellite cells (SC), (×400). Group II showing (c) multiple atypical widely separated fibers (arrowheads), few disrupted fibers (wavy arrow), some dark (d) and few central nuclei (n), (×200). (d) Multiple disrupted widely separated atypical fibers (wavy arrows), few central pale nuclei (n) and multiple macrophages (m) in between (×400).
|
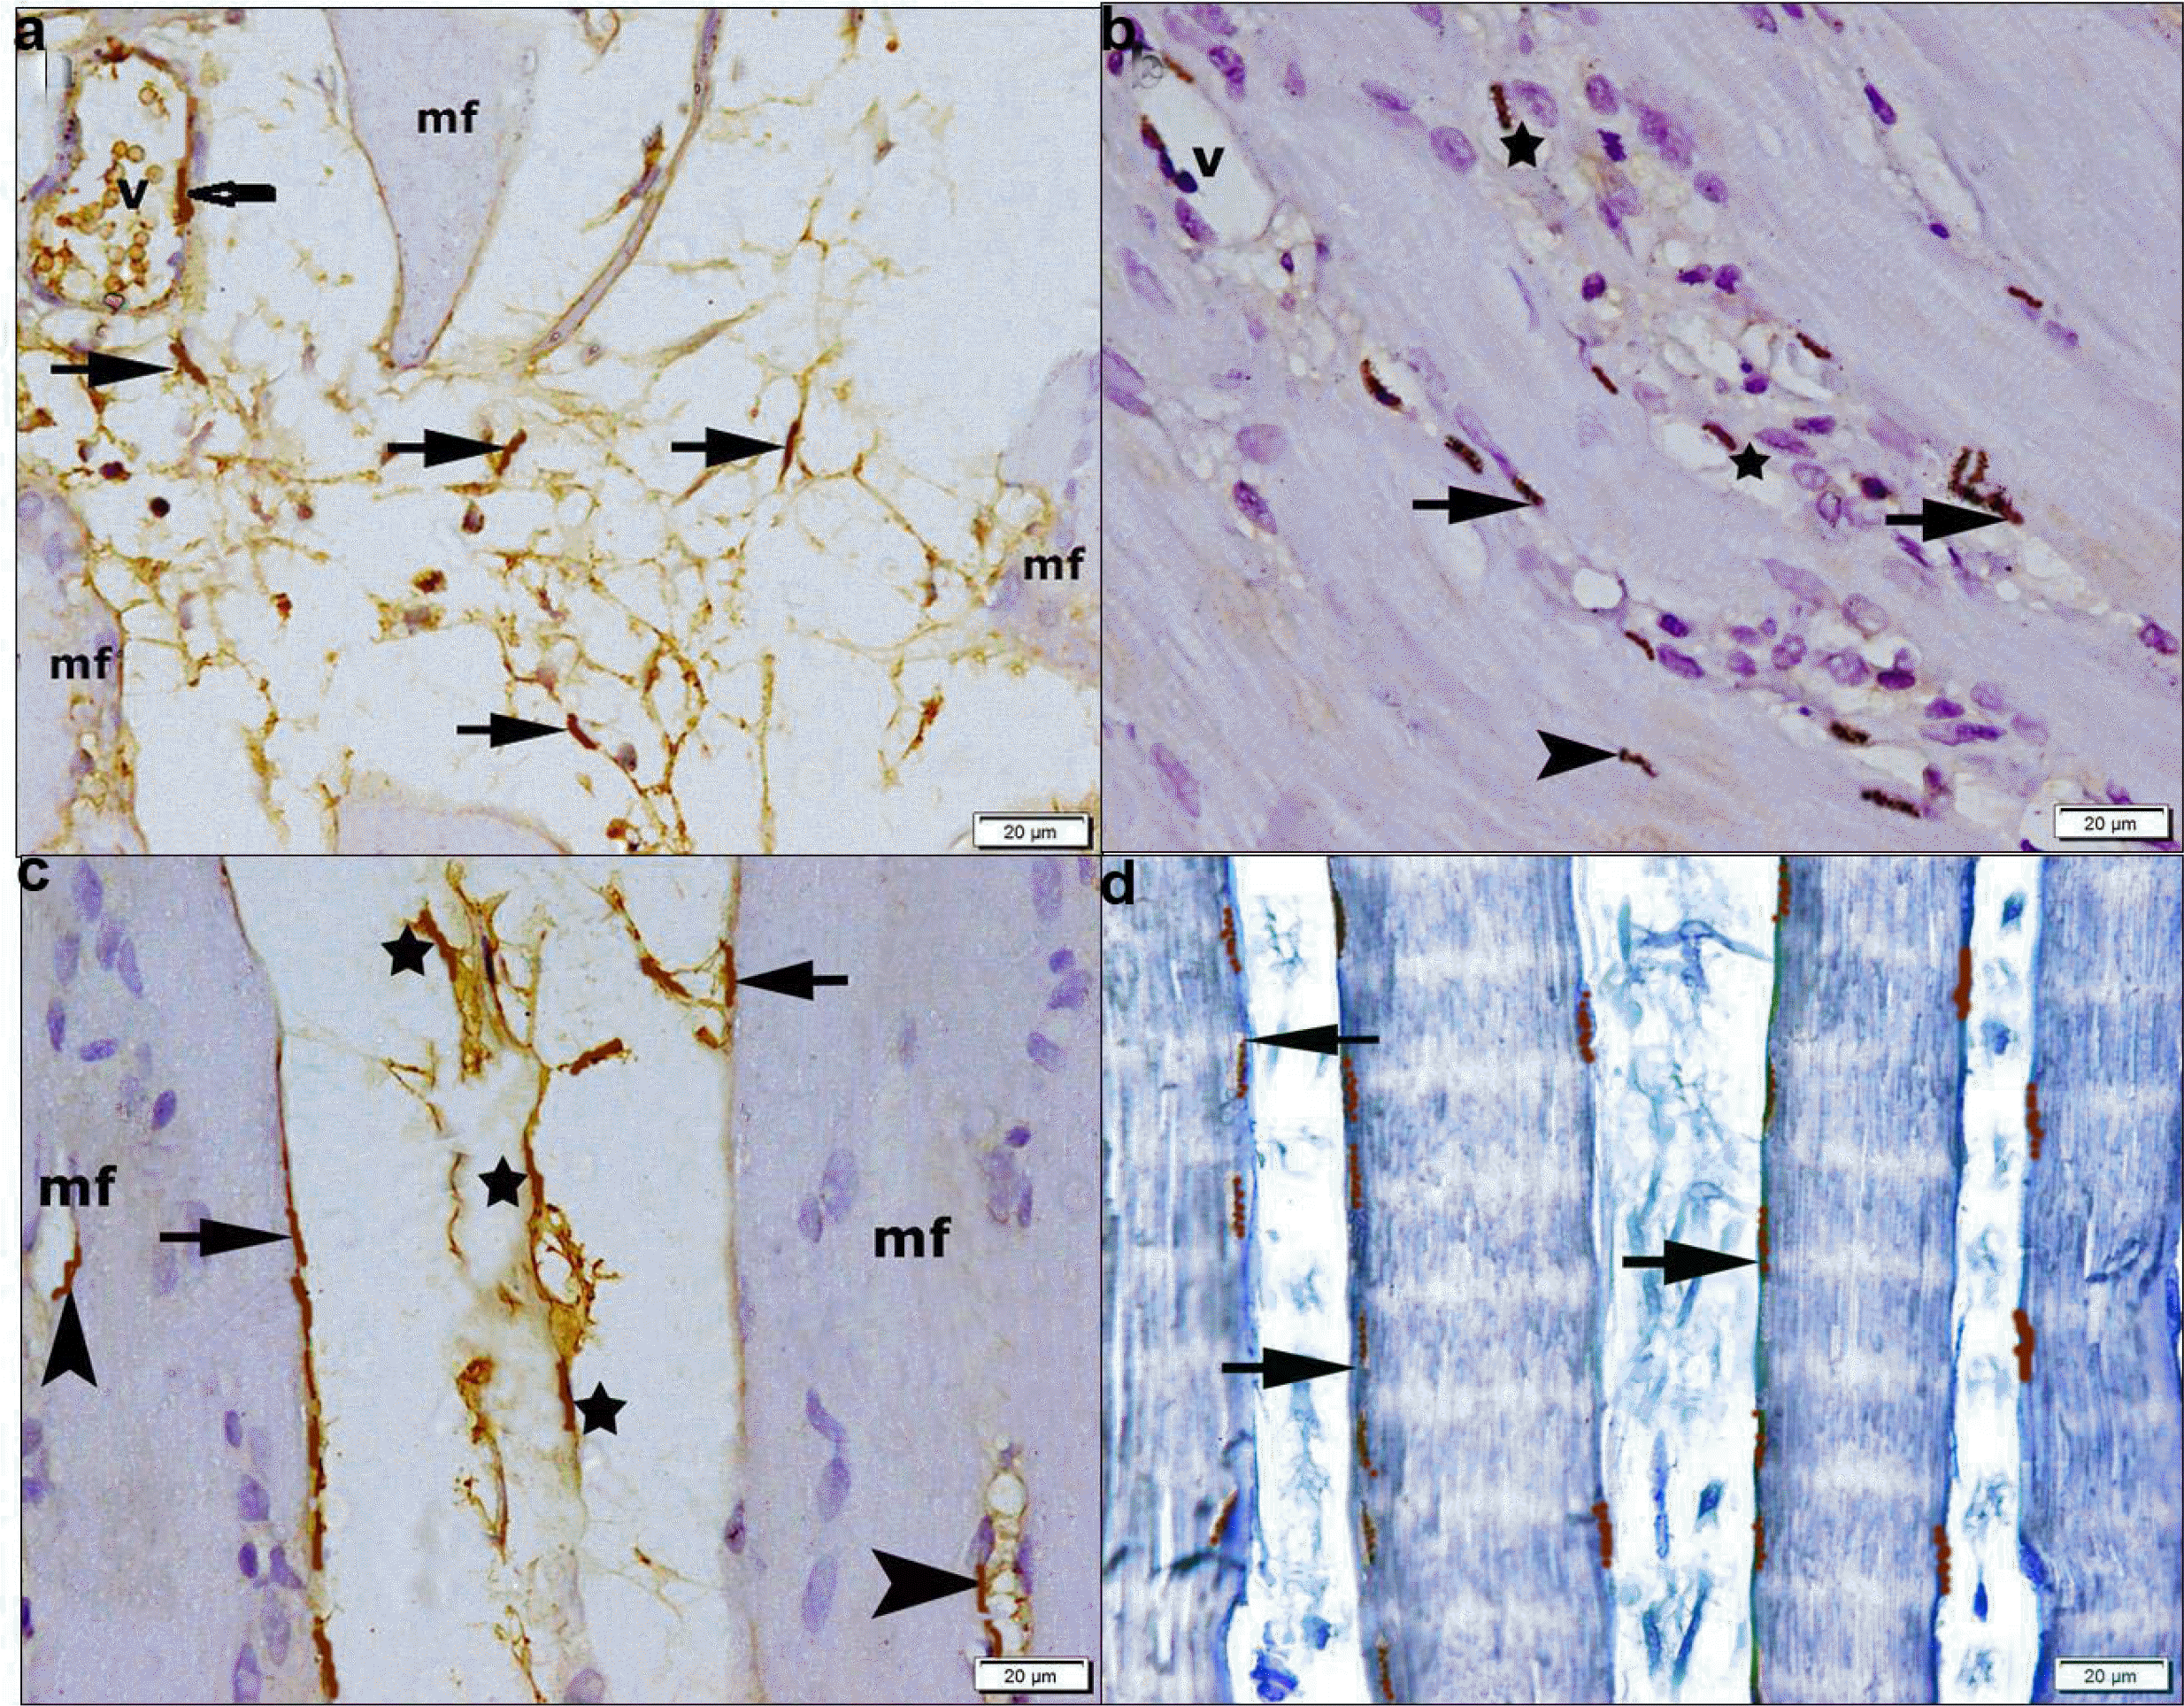
Sections of rats injected by BMMSCs recruited flat cells among organized fibers, some separated fibers and congested vessels (Fig. 3a). Few pale peripheral nuclei, few pale central nuclei and striations in some parts of the sarcoplasm were evident (Fig. 3b). Sections of rats injected by BMMSCs and received oral AA showed some fibers with rows of central oval nuclei, multiple flat cells and some mononuclear cells between the fibers (Fig. 3c). Fibers appeared with rows of central pale nuclei, minimal separation of myofibrils, striations in multiple areas of the sarcoplasm by close observation (Fig. 3d). Sections in group V showed regular fibers with rows of central nuclei, other fibers with peripheral nuclei and congested vessels (Fig. 3e). Obvious striations, central pale nuclei, few flat dark cells at the center of some fibers and focal separation of myofibrils were noticed by close observation (Fig. 3f).
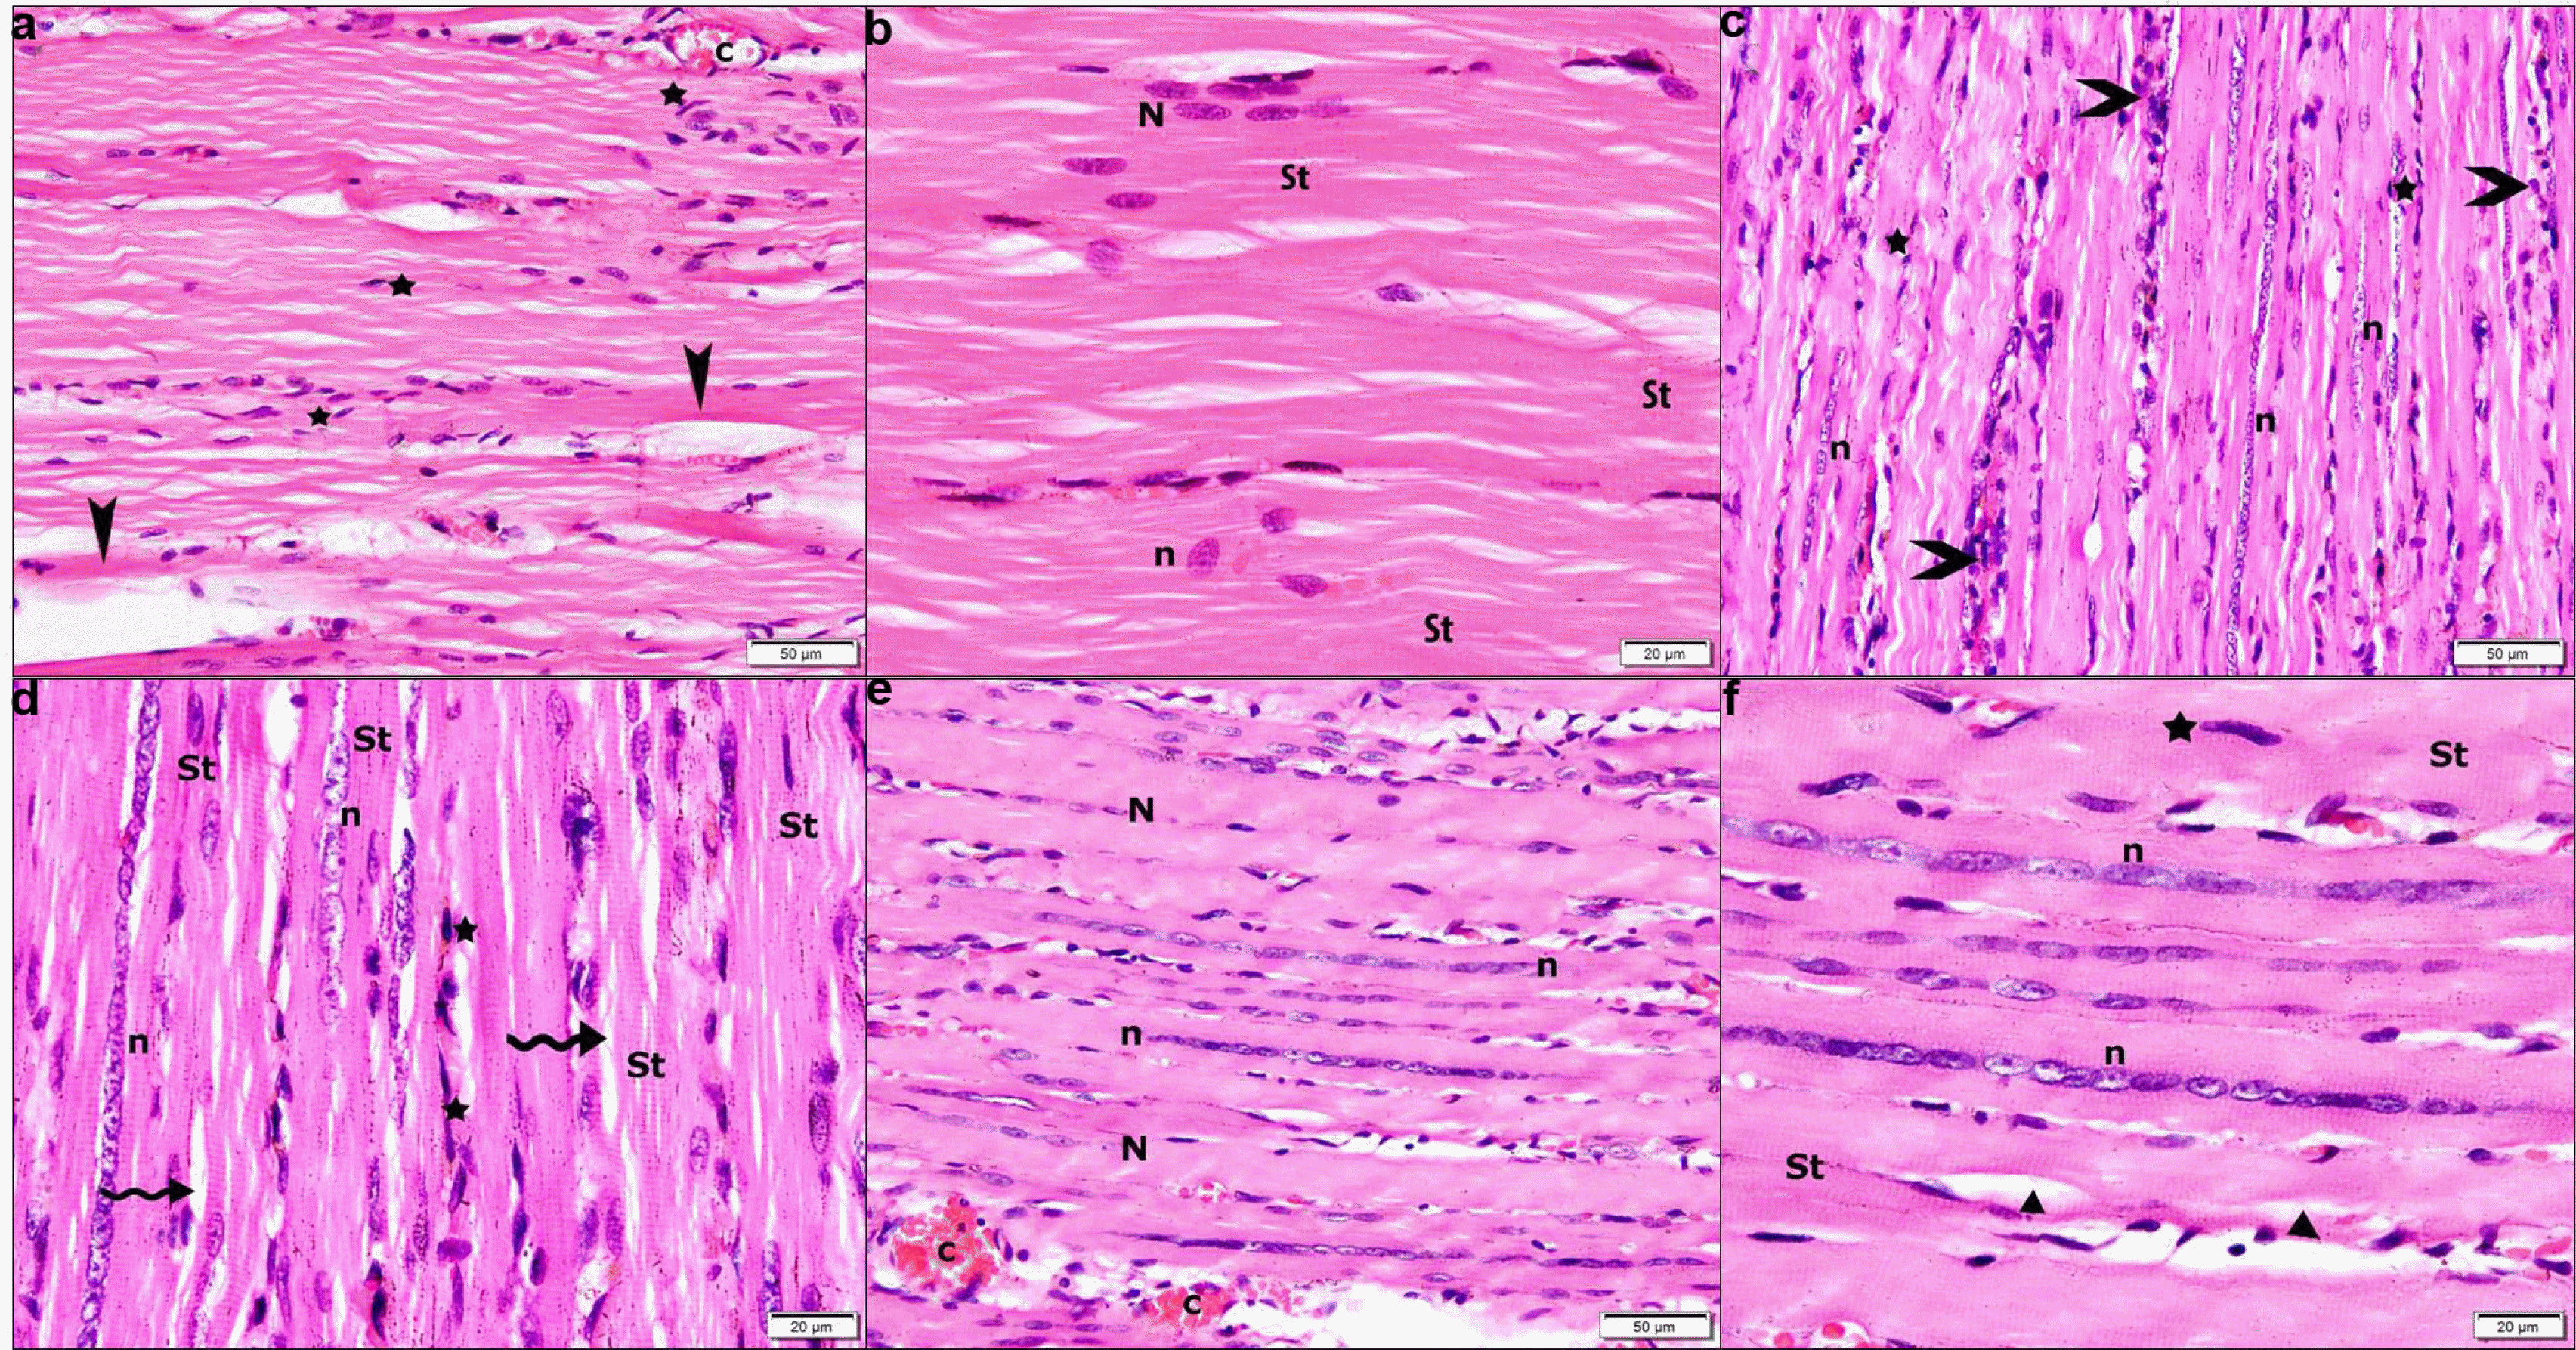 | Fig. 3H&E stain. Group III showing (a) organized fibers with flat nuclei (stars), some separated fibers (arrowheads) and a congested vessel (c) (×200). (b) Fibers with few pale peripheral nuclei (N), few pale central nuclei (n) and striations (St) in some parts of the sarcoplasm (2400). Group IV showing (c) some fibers with rows of central oval nuclei (n), multiple flat nuclei (stars) and some mononuclear cells (arrowheads) (2200). (d) Some fibers with rows of central pale nuclei (n), others with minimal separation of myofibrils (wavy arrows), striations (St) in multiple areas of the sarcoplasm and flat dark nuclei (stars) (2400). Group V showing (e) some regular fibers with rows of central nuclei (n), other fibers with peripheral nuclei (N) and two congested vessels (c) (2200). (f) Rows of pale central nuclei (n), obvious striations (St), a central flat dark nucleus (star) and focal separation of myofibrils (arrowheads) (2400).
|
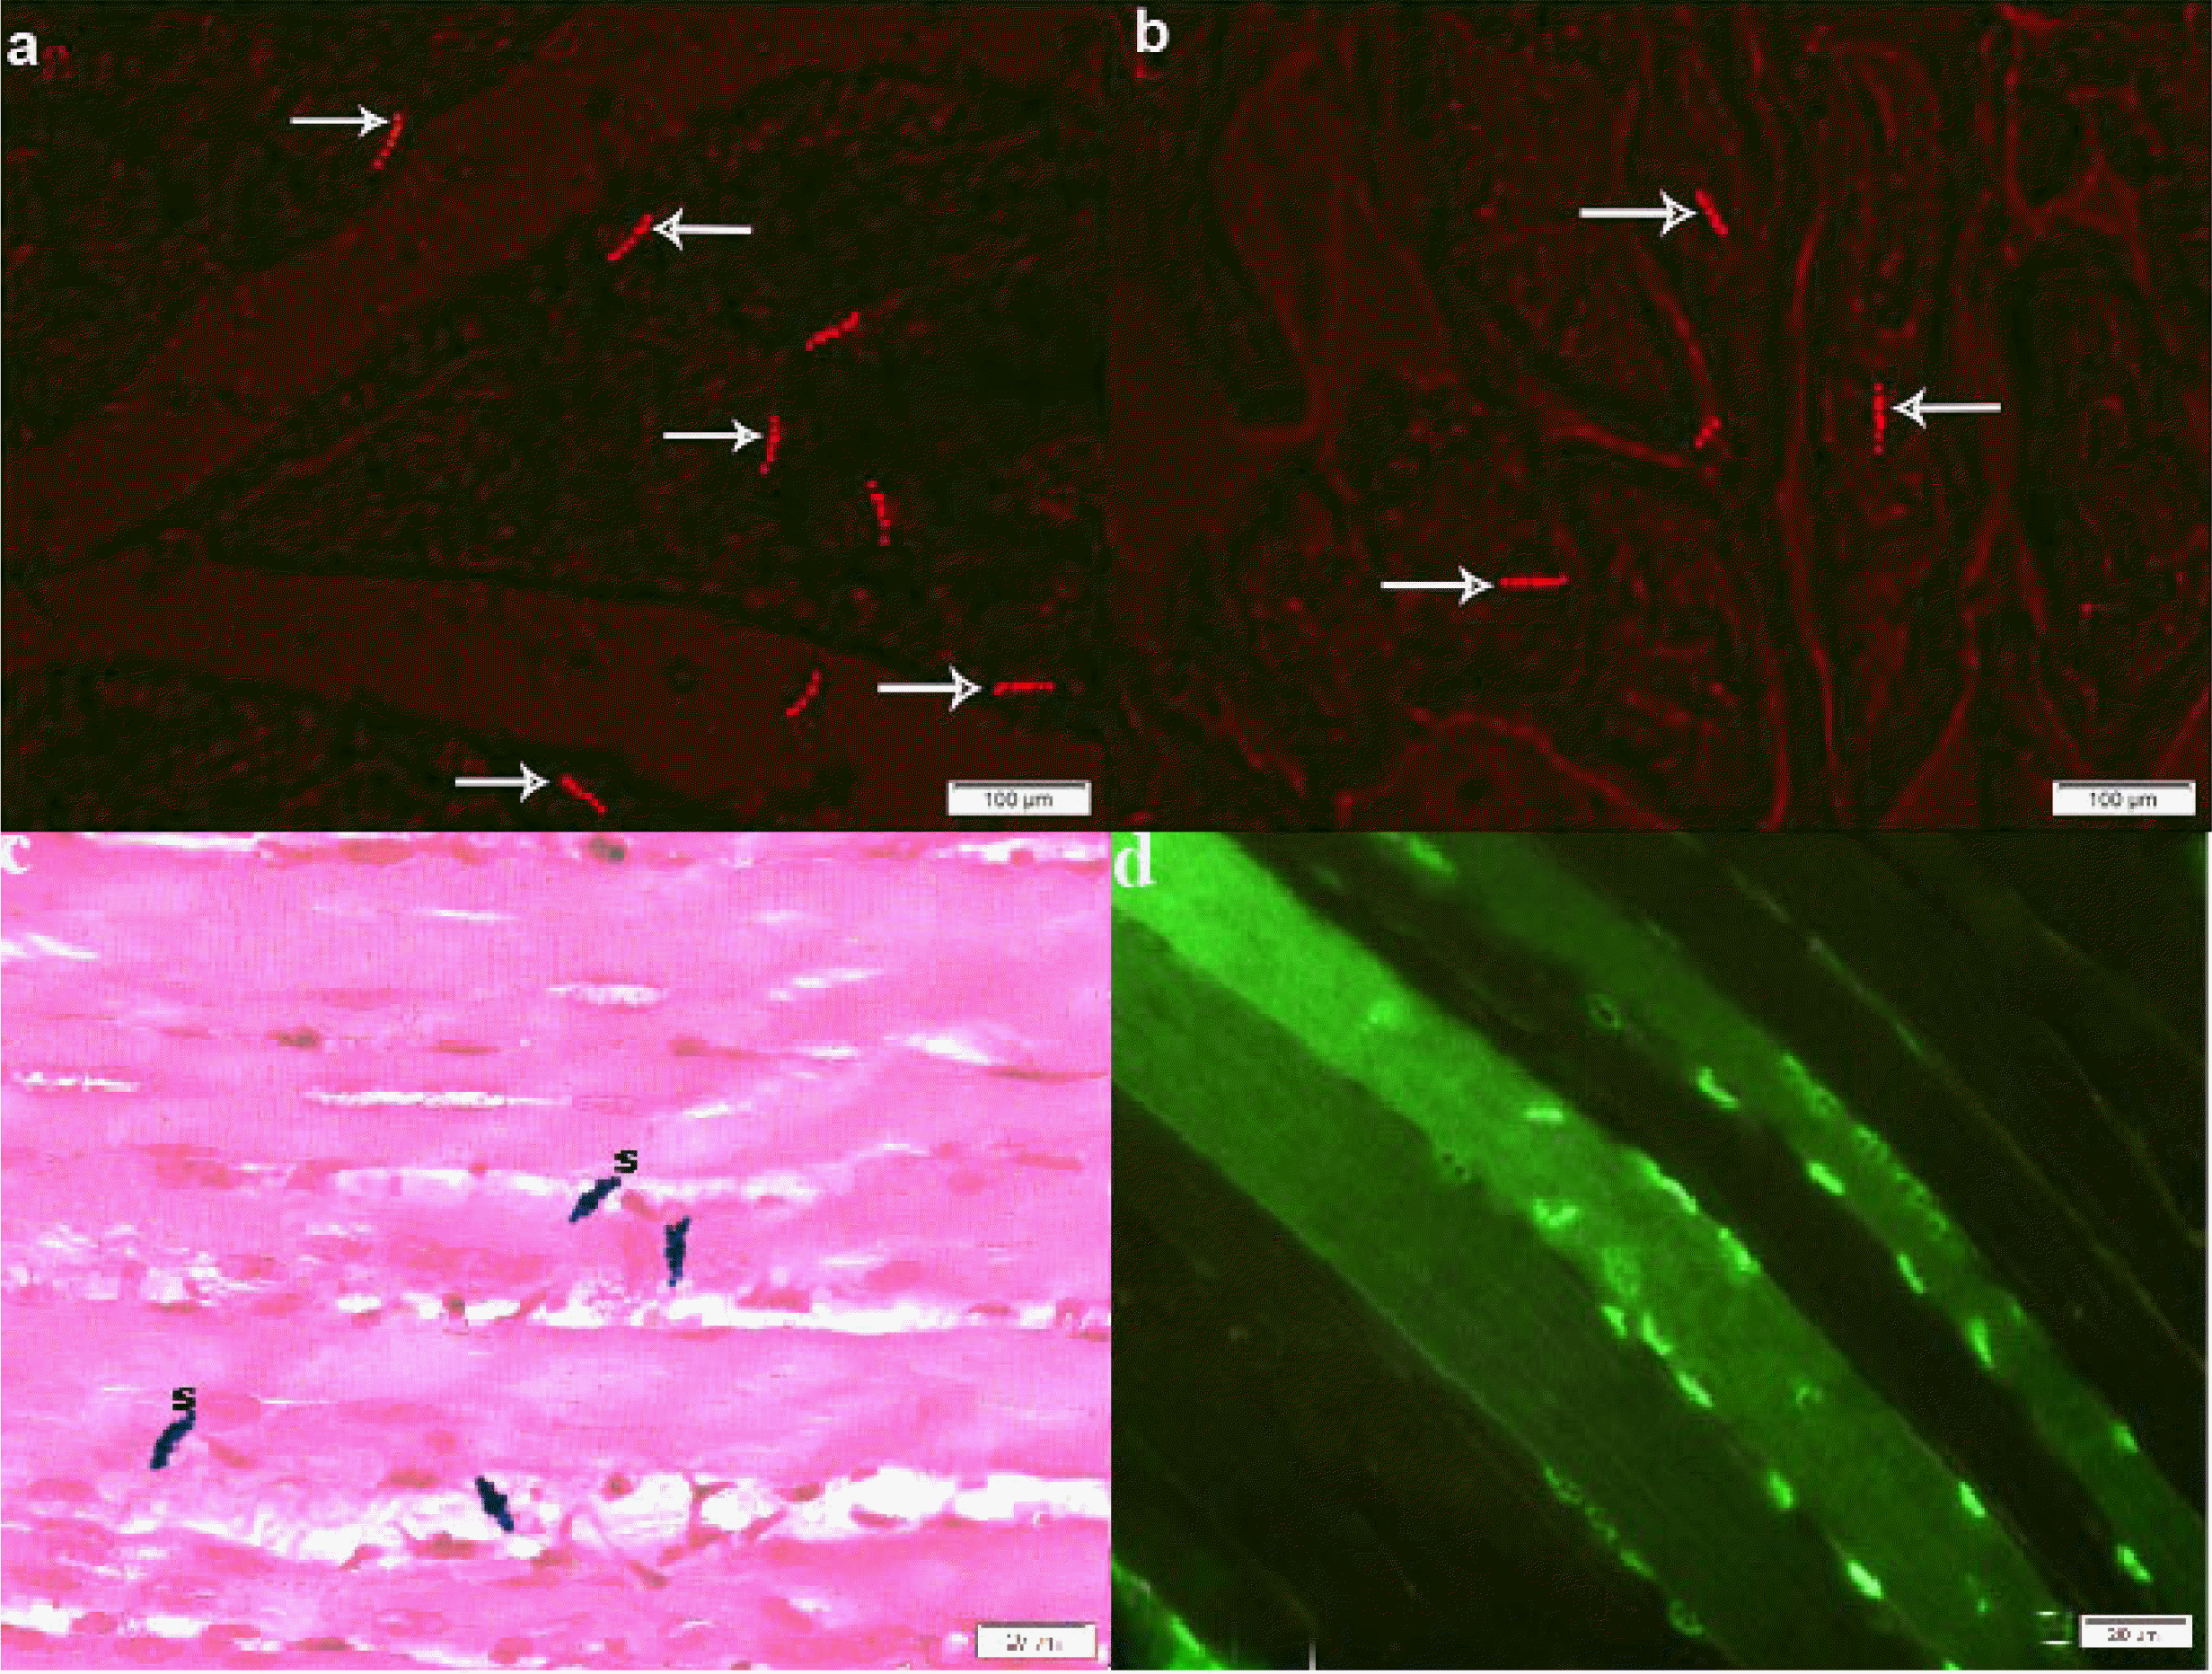
In fluorescent labeled sections belonging to group III multiple PKH26 fluorescent labeled cells were evident among the fibers (Fig. 4a), while in group IV labeled cells were fewer (Fig. 4b). In group V feridex labeled transfected cells appeared as few Pb +ve spindle cells among the fibers (Fig. 4c) and few GFP fluorescent labelled cells were evident among the muscle fibers (Fig. 4d), and. The count was 8/field in group III, 5/field in group IV and 4/field in group V.
In CD105 immunostained sections, −ve immunostaining was found among the fibers and in vessels in group I (Fig. 5a). In group II some +ve spindle cells were seen in the CT near vessels and near obviously vacuolated fibers in few fields (Fig. 5b). Group III demonstrated multiple +ve cells among the fibers and few in the CT in multiple fields (Fig. 5c). Group IV showed multiple +ve cells in the CT and few on the fibers in some fields (Fig. 5d). Group V showed some +ve cells in vessels and few on fibers in some fields (Fig. 5e).
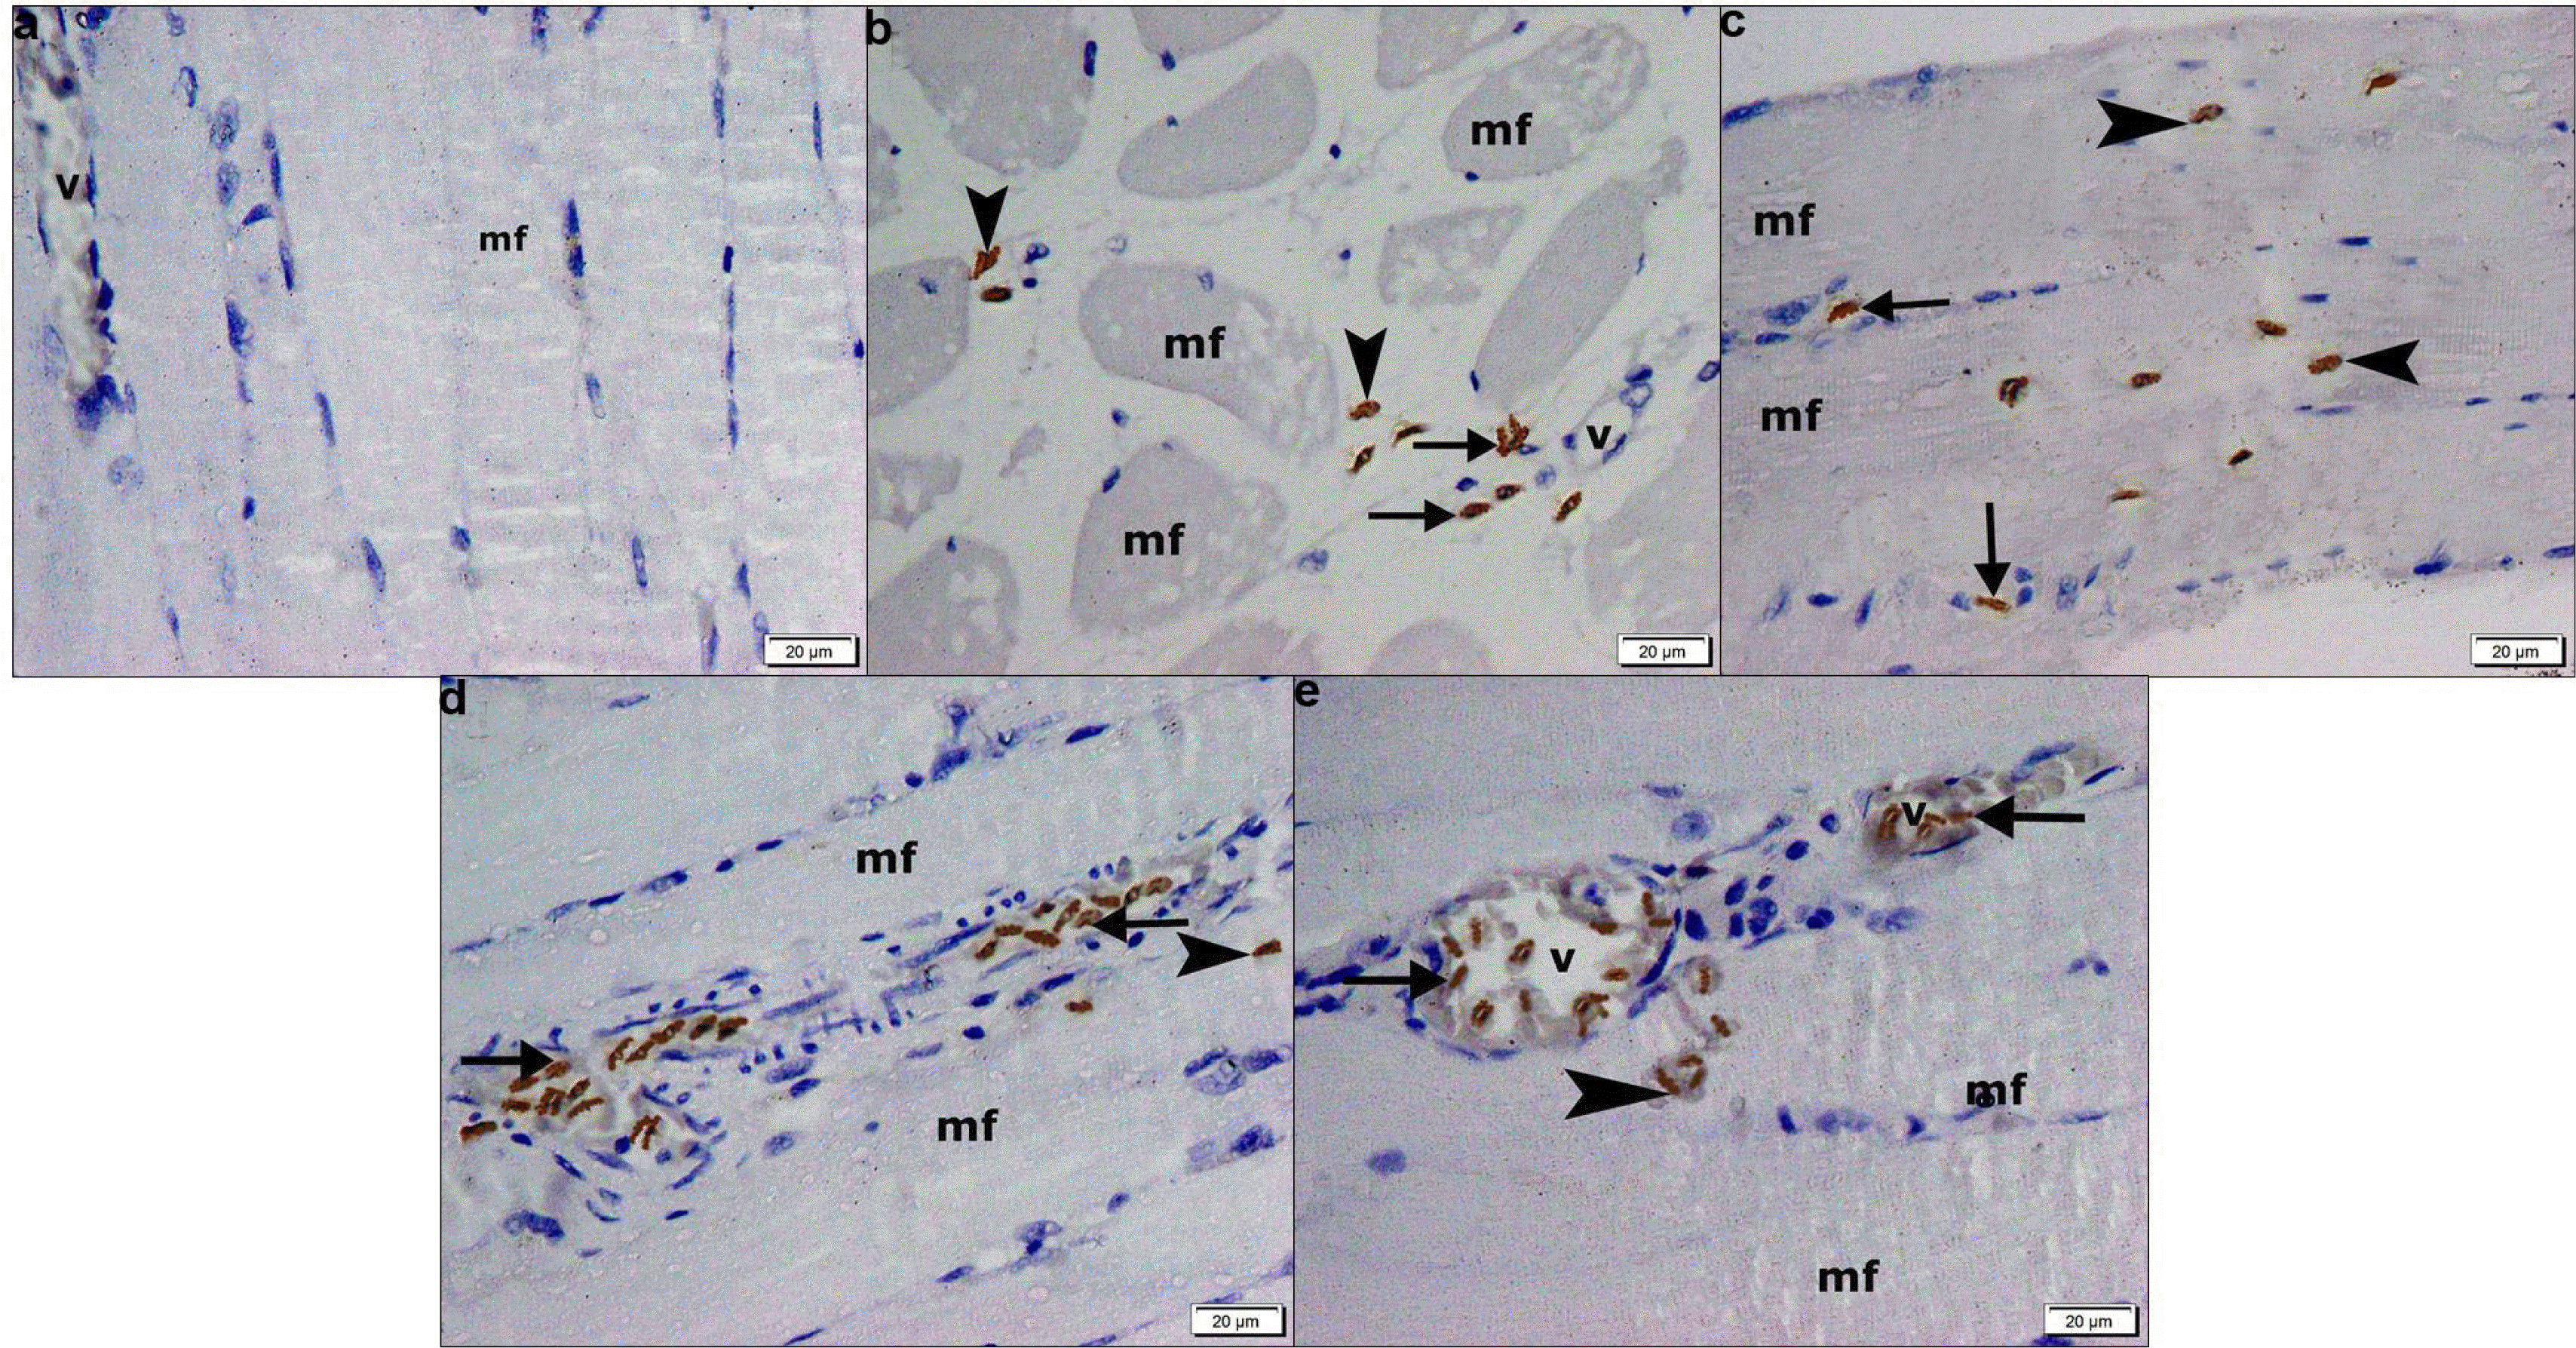 | Fig. 5CD105 immunostaining, (×400) showing in (a) group I −ve immunoexpression among the fibers (mf) and in a vessel (v). (b) Group II some +ve spindle cells in the CT near a vessel (v) (arrows) and near obviously vacuolated fibers (mf) (arrowheads). (c) Group III multiple +ve cells among the fibers (mf) (arrowheads) and few in the CT (arrows). (d) Group IV multiple +ve cells in the CT between the fibers (mf) (arrows) and few on a fiber (arrowhead). (e) Group V some +ve cells in two vessels (v) (arrows) and few on a fiber (mf) (arrowhead).
|
In CD34 immunostained sections, −ve immunostaining was seen among the fibers and in vessels. Group II demonstrated few +ve flat cells in the CT and in the lining of few vessels (Fig. 6a). Group III showed some +ve cells at the periphery and at the center of fibers (Fig. 6b). Group IV recruited multiple +ve cells at the periphery and at the center of some fibers, in the CT and in the lining of vessels (Fig. 6c). Group V demonstrated numerous +ve cells at the periphery of some fibers (Fig. 6d).
 | Fig. 6CD34 immunostaining, (×400) showing in (a) group II few +ve flat cells in the CT between some fibers (mf) (arrows) and in the lining of a vessel (v). (b) Group III some +ve flat cells at the periphery (arrows) and at the center (arrowhead) of some fibers. (c) Group IV multiple +ve flat cells at the periphery (arrows), at the center (arrowheads) of some fibers, in the CT (stars) and in the lining of a vessel (v). (d) Group V numerous +ve flat cells (arrows) at the periphery of fibers.
|
Morphometric results (Table 1b): As regards the mean area of pale nuclei a significant (p≤0.05) decrease was detected in group II compared to control and treated groups and in group III versus control and the other treated groups. Concerning mean area% of CD105 +ve cells a significant (p≤0.05) increase was found in group III compared to diabetic and other treated groups, in group IV versus diabetic and SERCA1a transfected BMMSCs groups and in the latter group compared to diabetic group. While mean area% of CD34 +ve cells was significantly (p≤0.05) increased in SERCA1a transfected BMMSCs group compared to diabetic and other treated groups, in BMMSCs and AA group versus BMMSCs and diabetic groups and in BMMSCs group versus diabetic group.
Table 1b
Mean±SD area of pale nuclei, area% of CD105+ve cells, area% of CD34 immunoexpression in control and experimental groups±SD
| Group | Area of pale nuclei | Area % of CD105 +ve cells | Area % of CD34 +ve cells |
|---|---|---|---|
| Group I | 9.1±1.5 | - | - |
| Group II | 2.6±0.5* | 0.16±0.03 | 0.13±0.04 |
| Group III | 4.2±0.7• | 1.08±0.33# | 0.28±0.04ⓒ |
| Group IV | 7.3±1.11 | 0.60±0.11 | ^0.54±0.07Ω |
| Group V | 8.7±1.68 | 0.33±0.08ⓒ | 1.10±0.12# |
* Significant (p≤0.05) decrease versus other groups. •Significant (p≤0.05) decrease versus control, groups IV and V. #Significant (p≤0.05) increase versus other groups. ^Significant (p≤0.05) increase versus groups II and V. ⓒSignificant (p≤0.05) increase versus group II. ΩSignificant (p≤0.05) increase versus groups II and III.
![]()
Western blot values (Fig. 7a and 7b): The mean SERCA1a protein values±SD were (1.91±0.32) in group I, (0.31±0.05) in group II, (0.55±0.03) in group III, (0.72±0.09) in group IV and (1.51±0.24) in group V. The previous values indicated a significant (p≤0.05) increase in groups I and V compared to the other groups and in groups III and IV compared to group II.
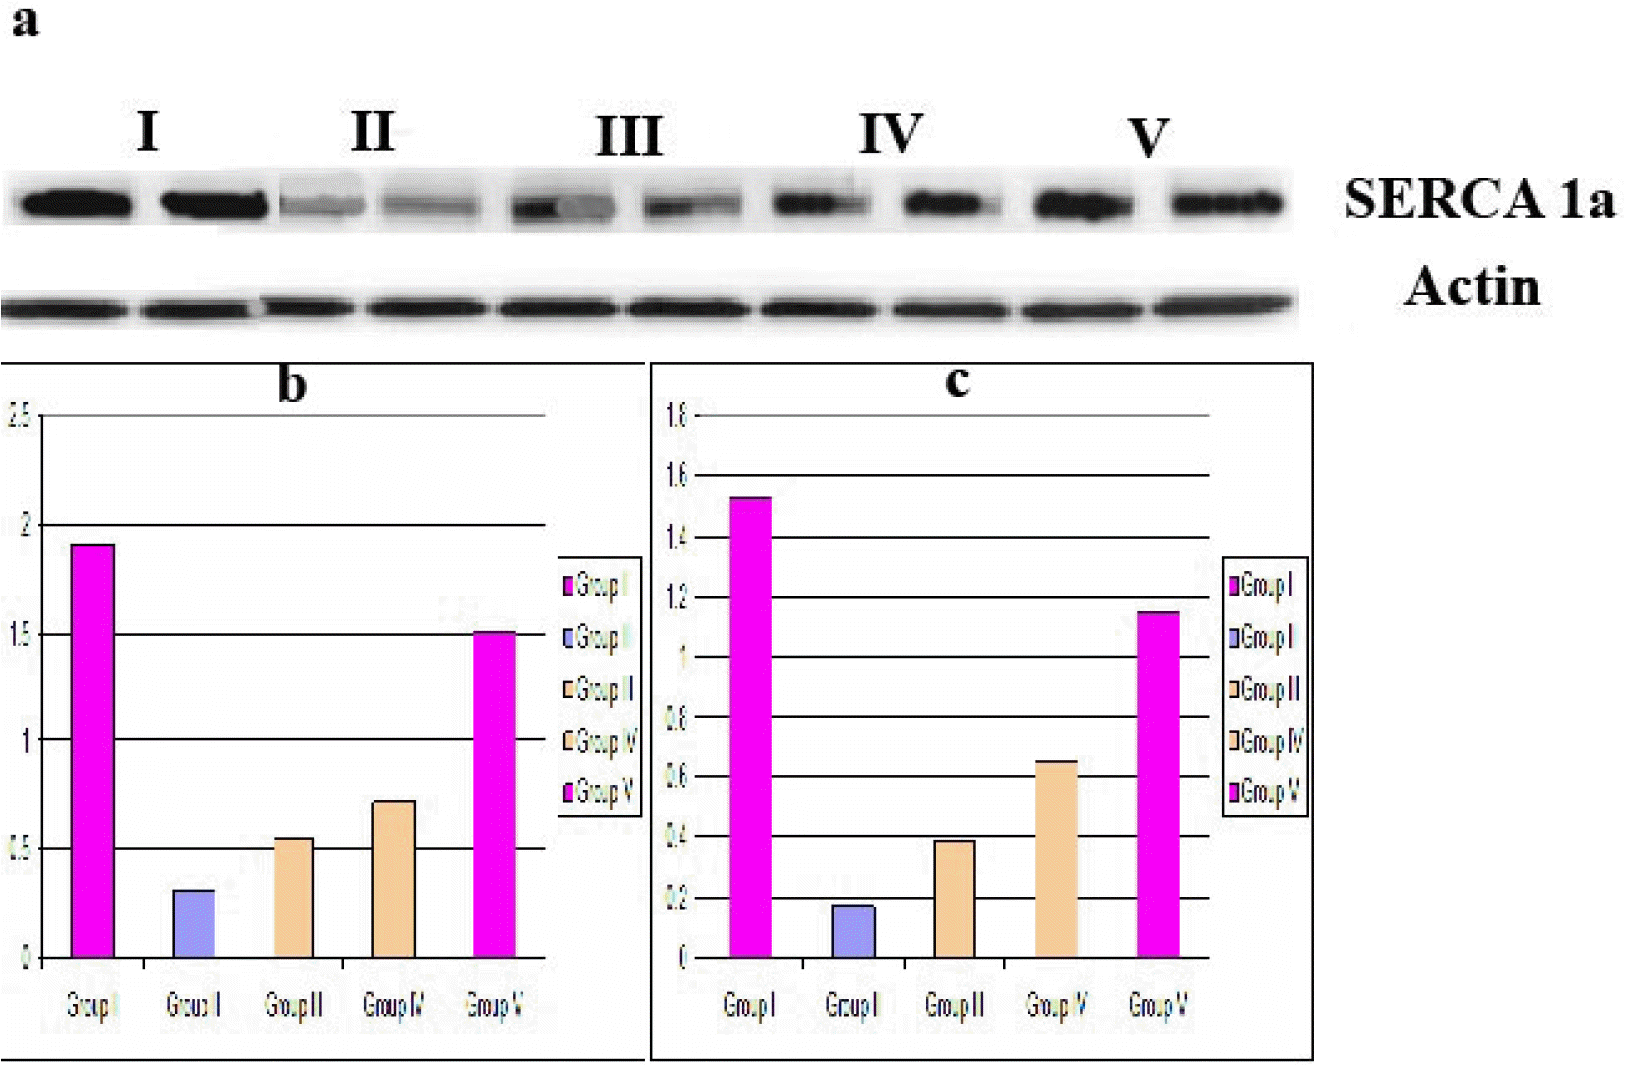 | Fig. 7(a) Western blot showing SERCA1a protein detected and analyzed (normalized to actin) in gastrocnemius tissue from groups I to V (b) mean density of SERCA1a (c) mean PCR values of SERCA1a gene, (a) and (c) denoted significant increase in groups I and V versus other groups and in groups III and IV versus group II.
|
Mean qPCR values (Fig. 7c): The mean SERCA1a gene values in μg±SD were (1.53±0.30) in group I, (0.17±0.02) in group II, (0.39±0.05) in group III, (0.65±0.13) in group IV and (1.15±0.14) in group V. The previous values indicated a significant (p≤0.05) increase in groups I and V compared to the other groups and in groups III and IV compared to group II.
Go to :
Discussion
The findings of the present study pointed to improvement of the skeletal muscle morphological changes that were induced by T1D, confirmed by morphometric quantitative data. In addition, amelioration of the biochemical parameters of oxidative stress, skeletal muscle calcium concentration, and the values of PCR concerning SERCA1a gene content was recorded. These findings denoted therapeutic effects of the transfected SCs and the non-transfected SCs together with AA that are going to be compared and discussed.
In the present study single dose of STZ has been administered to rats followed by 8 weeks interval before sacrifice, to evoke a model of diabetic myopathy. The aim was to establish a progressive myopathy, in order to provide the optimal time course and interrelationships between the serological and morphological events underlying diabetic myopathy in rat. A significant increase was reported in the mean blood glucose values in group II compared to the control and treated groups. In agreement, it was reported that blood glucose fluctuations have higher risk in diabetic chronic complications. This was confirmed by Li et al. (28).
Mean DNA fragmentation and mean MDA values revealed a significant increase in the diabetic group compared to all other groups. On the other hand, mean GSH and catalase values recorded a significant decrease, indicating oxidative stress. Going with, it was proved that oxidative stress facilitates increased cellular stress levels and initiates DNA fragmentation to induce apoptosis (29).
Group II recruited multiple atypical widely separated fibers with dark nuclei, multiple macrophages between and disrupted fibers. The previously mentioned results denoted inflammatory changes progressing to degenerative changes. In accordance, it was stated that inflammation plays a considerable role in the progression of genetic diseases affecting the skeletal muscle and in defective muscle regeneration with atrophy and wasting (30).
In group II, few CD105 +ve cells were seen near obviously vaculated fibers confirmed by a significant decrease in the mean area% of CD105 +ve cells. It was stated that CD105 is the marker of stromal cells and it was added that diabetes negatively impacts on functional properties of tissue resident SCs (31).
In group II, few CD34 +ve cells were seen between some fibers and in the lining of few vessels, confirmed by a significant decrease in the mean area% of CD34 +ve cells. In support, it was recorded that interstitial progenitor cells are CD34 +ve (25). It was added that skeletal muscle progenitor cells are multipotent and give rise to myoblasts and myotubes. Unfortunately, advanced glycation end products exert negative regulation on myogenesis by skeletal muscle progenitor cells (2).
As regards PCR values, a significant decrease in SERCA1a gene was recorded in group II, which can be related to oxidative stress. In agreement, it was confirmed that SERCA1a expression decreased in a mouse model of diabetes (32).
Group III (BMMSCs Group) recorded significant decrease in DNA fragmentation and MDA, significant increase in GSH and catalase versus diabetic group. Concomitantly, phenotyping showed flat cells among organized and some separated fibers, congested vessels, few peripheral pale nuclei, few central pale nuclei and striations in some parts of the sarcoplasm A significant increase in the mean area of pale nuclei versus diabetic group was proved. The above mentioned results denoted regression of induced diabetic inflammatory and degenerative changes by BMMSCs therapy. In addition, it can be proposed that the flat cells found on fibers are stem/progenitor cells. In accordance, the homing of transplanted MSCs was found to be associated with anti-inflammatory effect on cytokines and regenerative potency (33).
Multiple fluorescent labeled cells were found among the fibers. The multiplicity of labeled cells in group III can be referred to some residual tissue changes. While, the significant increase in the mean area % of CD105 +ve cells recorded due to BMMSCs therapy can be explained by that, culture expanded MSCs enhance the efficacy of endogenous SCs. A significant increase in the mean area% of CD34 was reported in group III compared to the diabetic group. This outcome was concomitant with the record of powerful chemoattraction of stem/progenitor cells during organ damage. In support Souidi et al. (34) reported that the stromal cells act as guardians for endothelial progenitors by reducing their immunogenicity.
Diabetic rats injected by BMMSCs and administrated AA (Group IV) recorded significant decrease in DNA fragmentation and MDA, significant increase in GSH and catalase versus diabetic and BMMSCs groups. Histological phenotyping demonstrated fibers with rows of central pale nuclei, minimal separation of myofibrils, striations in multiple areas of the sarcoplasm and multiple flat cells. A significant increase in the mean area of pale nuclei versus diabetic and BMMSCs groups was reported. These results indicated regression of degenerative changes and obvious regeneration versus diabetic and BMMSCs groups, that can be referred to AA antioxidant effect, in agreement with Masola et al. (5).
Characterization of the cultured cells used in groups III and IV by immunohistochemistry and immunophenotyping proved that a large number of the cells were CD105 +ve. Fluorescent labeled cells were fewer than group III, indicating less resident tissue changes. Few CD105 +ve cells were seen on the fibers, suggesting more pronounced transdifferentiation of SCs. While multiple CD34 +ve cells were evident at the periphery and at the center of some fibers, confirmed by a significant increase in mean area% of CD34 +ve cells versus BMMSCs group. In support, it was documented that supplementation of AA profoundly rescued muscle resident and nonresident MSCs stemness that is usually altered by oxidative stress with consequent better muscle regeneration (35).
A significant increase in the PCR value of SERCA1a gene was reported in groups III and IV compared to group II, concomitantly it was stated that antioxidants, increased expression of myogenic specification genes in muscle progenitors (36).
In group V (SERCA1a transfected BMMSCs group), a significant decrease in DNA fragmentation and MDA, a significant increase in GSH and catalase were found versus diabetic and the other treated groups. Histological phenotyping revealed regular fibers with rows of central pale nuclei, other fibers with peripheral pale nuclei, obvious striations, focal separation of myofibrils few flat dark cells and congested vessels. These findings indicated minimal residual inflammatory changes compared to the other treated groups. De Jesus et al. (37) related reduced muscle inflammation to increased expression of SERCA and functional improvements.
Characterization of the cultured gene transfected BMMSCs by GFP and immunophenotyping proved transfection of a large number of cells. Few GFP labeled, few Pb +ve and few CD105 +ve undifferentiated cells were detected on the muscle fibers. While, the area % of CD34 +ve cells recorded a significant increase compared to the other groups, which may indicate the predominance of progenitors in this group versus CD105 undifferentiated MSCs. These changes can be explained by more pronounced differentiation of MSCs in SERCA group. Going with, it was confirmed that intracellular Ca++ homeostasis is cruicial for cell proliferation, migration, differentiation and consequently for regeneration, repair and function of skeletal muscle (38).
In all SCs treated groups a significant decrease was reported in the mean blood glucose values compared to group II, this effect can be related to that MSCs improve diabetic glycemic control. Additionally, in support to SERCA1a transfected BMMSCs therapy, it was proved that SERCA activation in diabetes resulted in lowered blood glucose level (39).
Concerning the mean calcium concentration values, a significant increase was found in the diabetic group compared to all other groups, indicating defective Ca homeostasis, in BMMSCs group versus control and the other treated groups, in BMMSCs and AA group versus control and SERCA1a group, indicating re-establishment of Ca homeostasis. In addition, PCR proved a mean value of SERCA1a gene in group V comparable to the control group. In agreement, it was documented that excitation-contraction coupling and initiation of contraction of skeletal muscle fiber is fired by an increase in cytosolic Ca2+. Mutations in genes encoding SERCA, lead to clinical disorders that manifest as myotonia, muscle weakness, paralysis or muscle wasting. Consequently, established homeostasis keeps histophysiology (40).
It can be concluded that T1D induced skeletal muscle injury in the form of inflammatory changes that progressed into degenerative changes. SERCA1a transfected BMMSCs proved a definite therapeutic effect on diabetic myopathy, more remarkable than BMMSCs combined with AA. This effect was evidenced by regression of induced inflammatory and degenerative changes. The latter changes, in addition to the therapeutic effect were confirmed by significant changes in the blood glucose level, the biochemical tests indicating oxidative stress, muscle calcium concentration, morphometric parameters and PCR values of SERCA1a.
Go to :
 XML Download