Introduction
Materials and Methods
Cell culture and treatment
Cell transfection
qRT-PCR assay
Cell viability
Transwell assay
Oil red O staining
Griess reaction
Double-luciferase reporter analysis
Western blot (WB) analysis
Statistical analysis
Results
Over-expressed miR-450a-5p inhibited viability, migration, and lipid formation of MGO-induced HUVECs
 | Fig. 1Methylglyoxal (MGO) down-regulated the expression of miR-450a-5p in human umbilical vein endothelial cells (HUVECs). (A) Quantitative real-time polymerase chain reaction (qRT-PCR) assay measured the expression of miR-450a-5p in HUVECs after treatment with low-glucose (5 mM), high-glucose (25 mM), or low-glucose combined with xylose (4.5 mM) for 24, 48, 72 h. (B) qRT-PCR assay determined the expression of miR-450a-5p in HUVECs treated by different concentrations of MGO (0, 250, 500, 1000 μM). (C) qRT-PCR assay determined the expression of miR-450a-5p in HUVECs treated by control, MGO only or combined with aminoguanidine bicarbonate salt (AG). **p<0.001, vs. low-glucose, 0 μm, or Control; ##p<0.001, vs. MGO. n=3. |
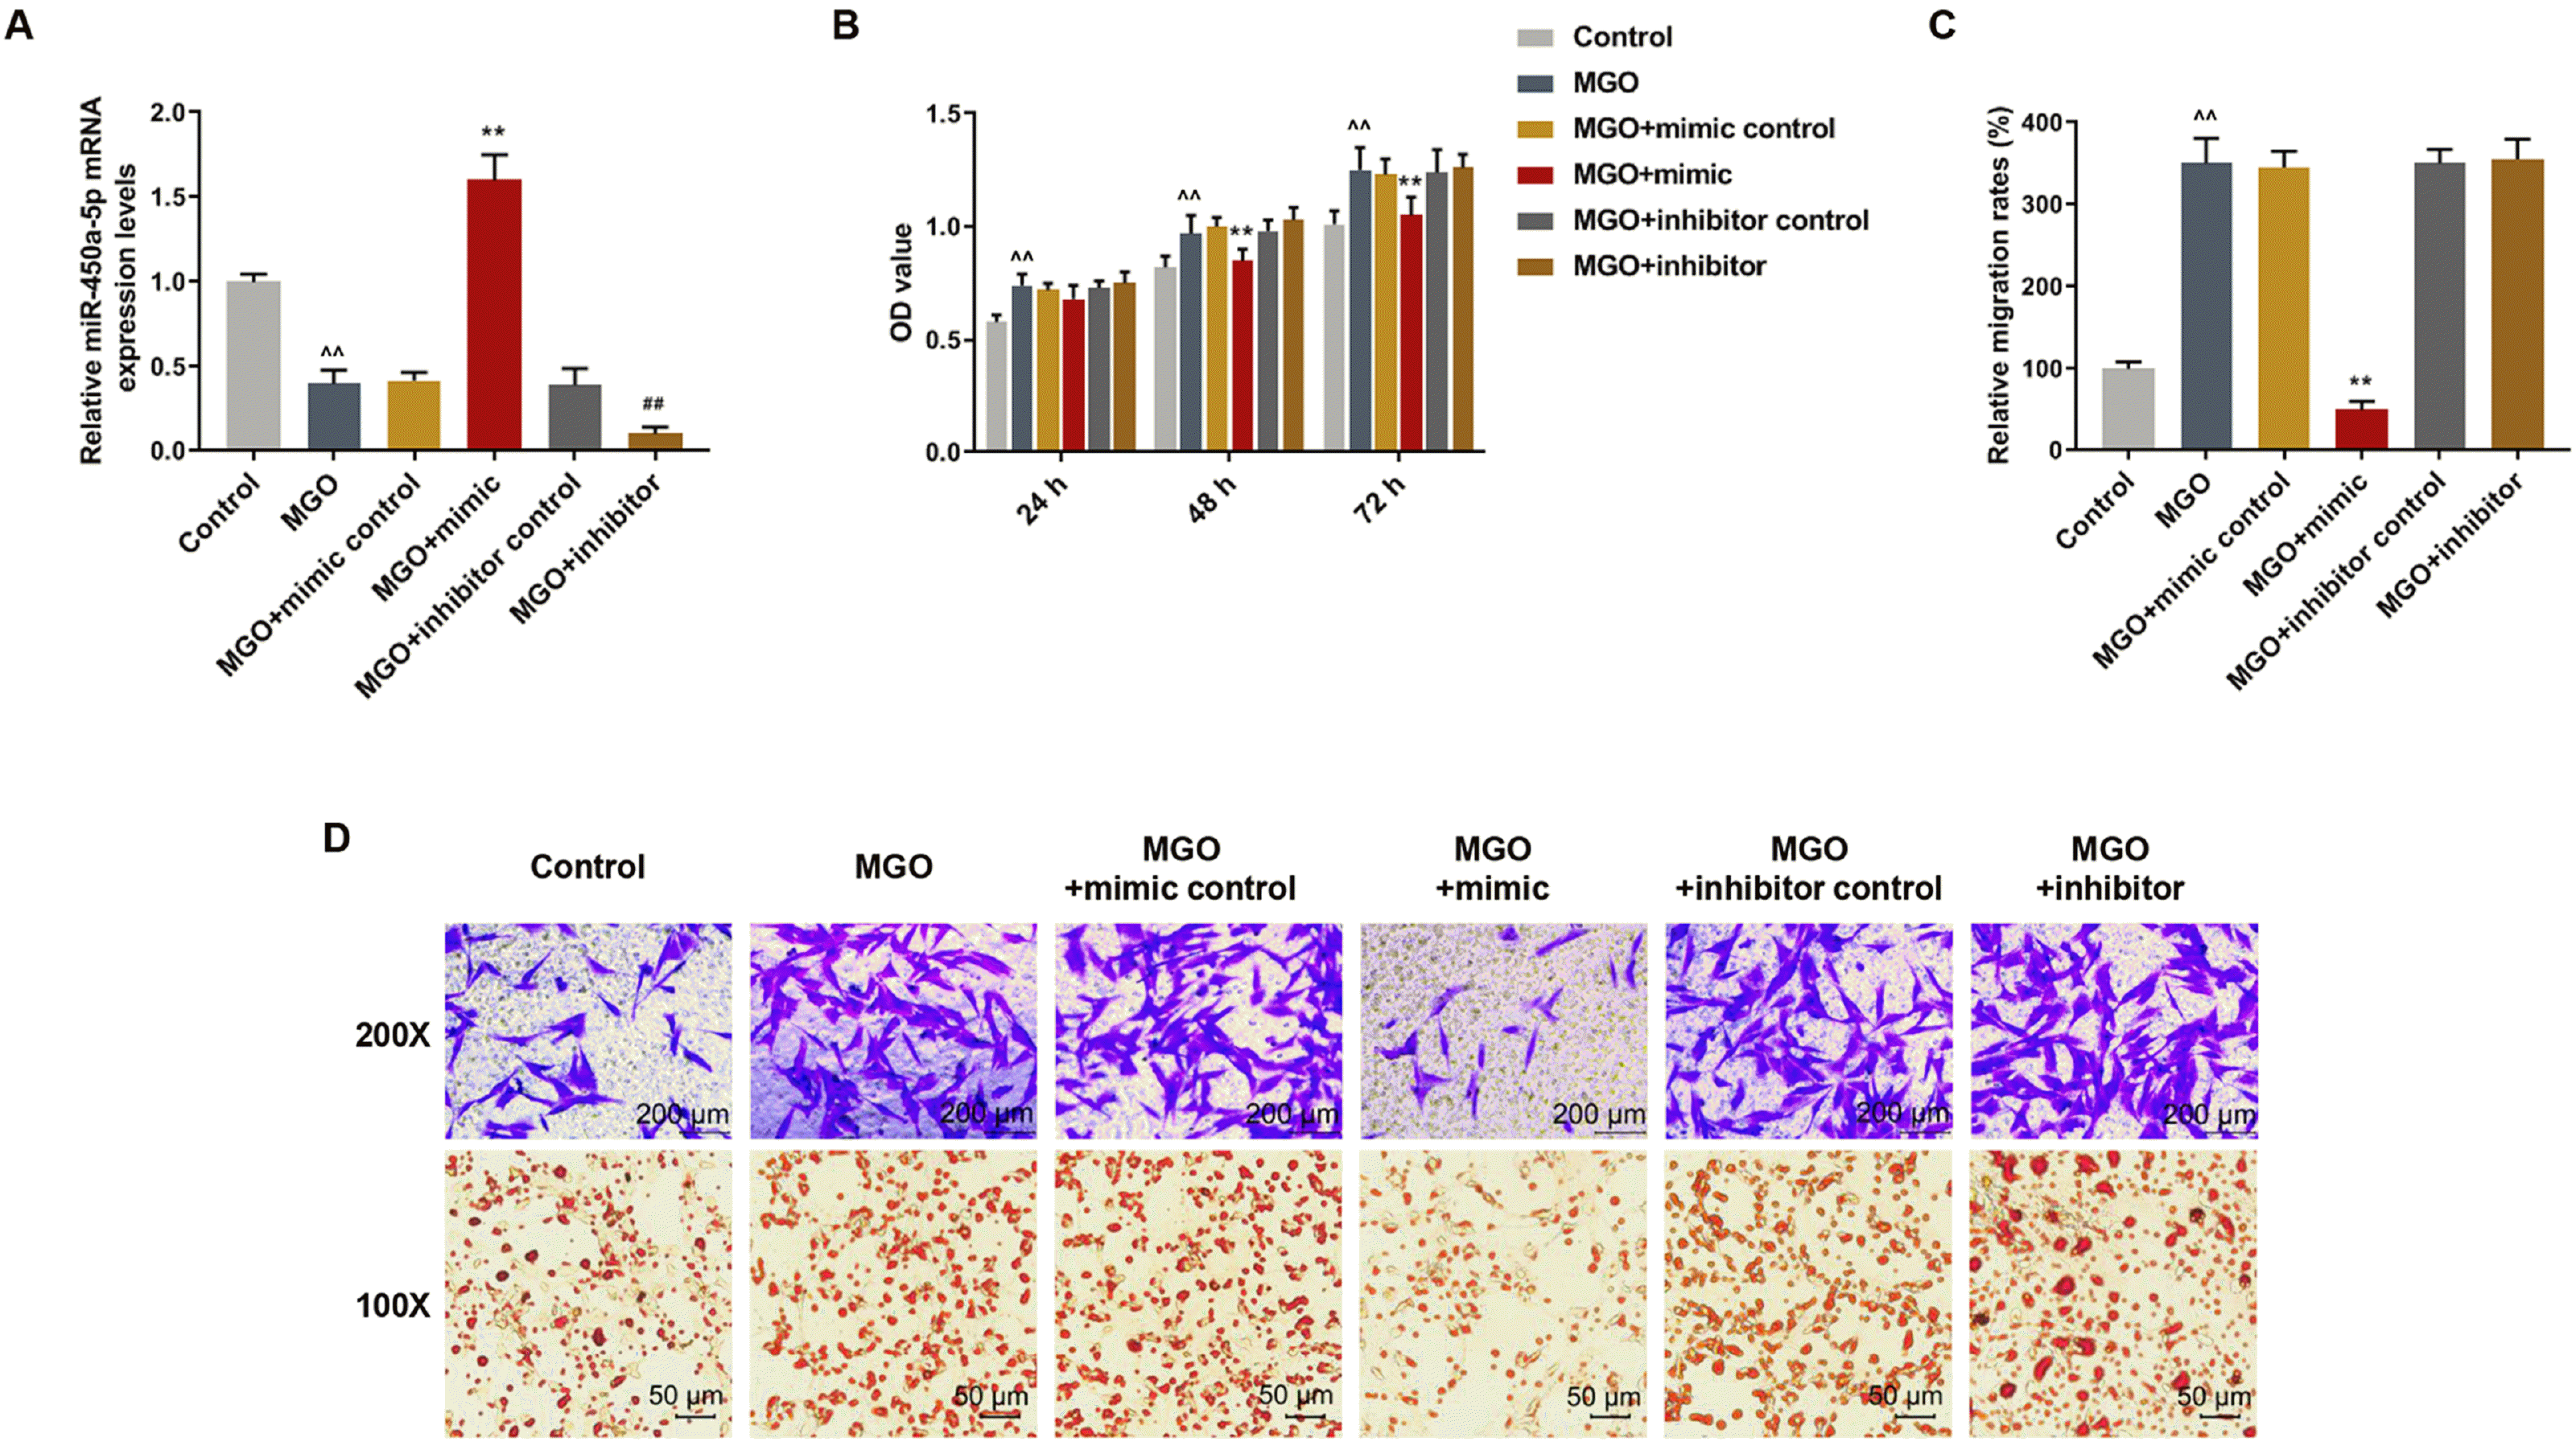
 | Fig. 2Over-expressed miR-450a-5p inhibited viability, migration, and lipid formation of methylglyoxal (MGO)-induced human umbilical vein endothelial cells (HUVECs). Mimic control, miR-450a-5p mimic, inhibitor control, and miR-450a-5p inhibitor were respectively transfected into MGO-treated HUVECs. (A) Quantitative real-time polymerase chain reaction (qRT-PCR) assay measured the expression of miR-450a-5p in MGO-treated HUVECs after the transfection. (B) MTT assay detected the optical densities (OD) values of MGO-induced HUVECs after the transfection for 24, 48 and 72 h. (C) Quantitative analysis of Transwell assay in MGO-treated HUVECs after the transfection. (D) Microscopic images of Transwell and Oil red O staining experiments in MGO-induced HUVECs after transfection. ^^p<0.001, vs. Control; **p<0.001, vs. MGO+mimic control; ##p<0.001, vs. MGO+inhibitor control. n=3. |
Over-expressed miR-450a-5p reduced the insulin resistance of MGO-induced HUVECs by targeting CREB
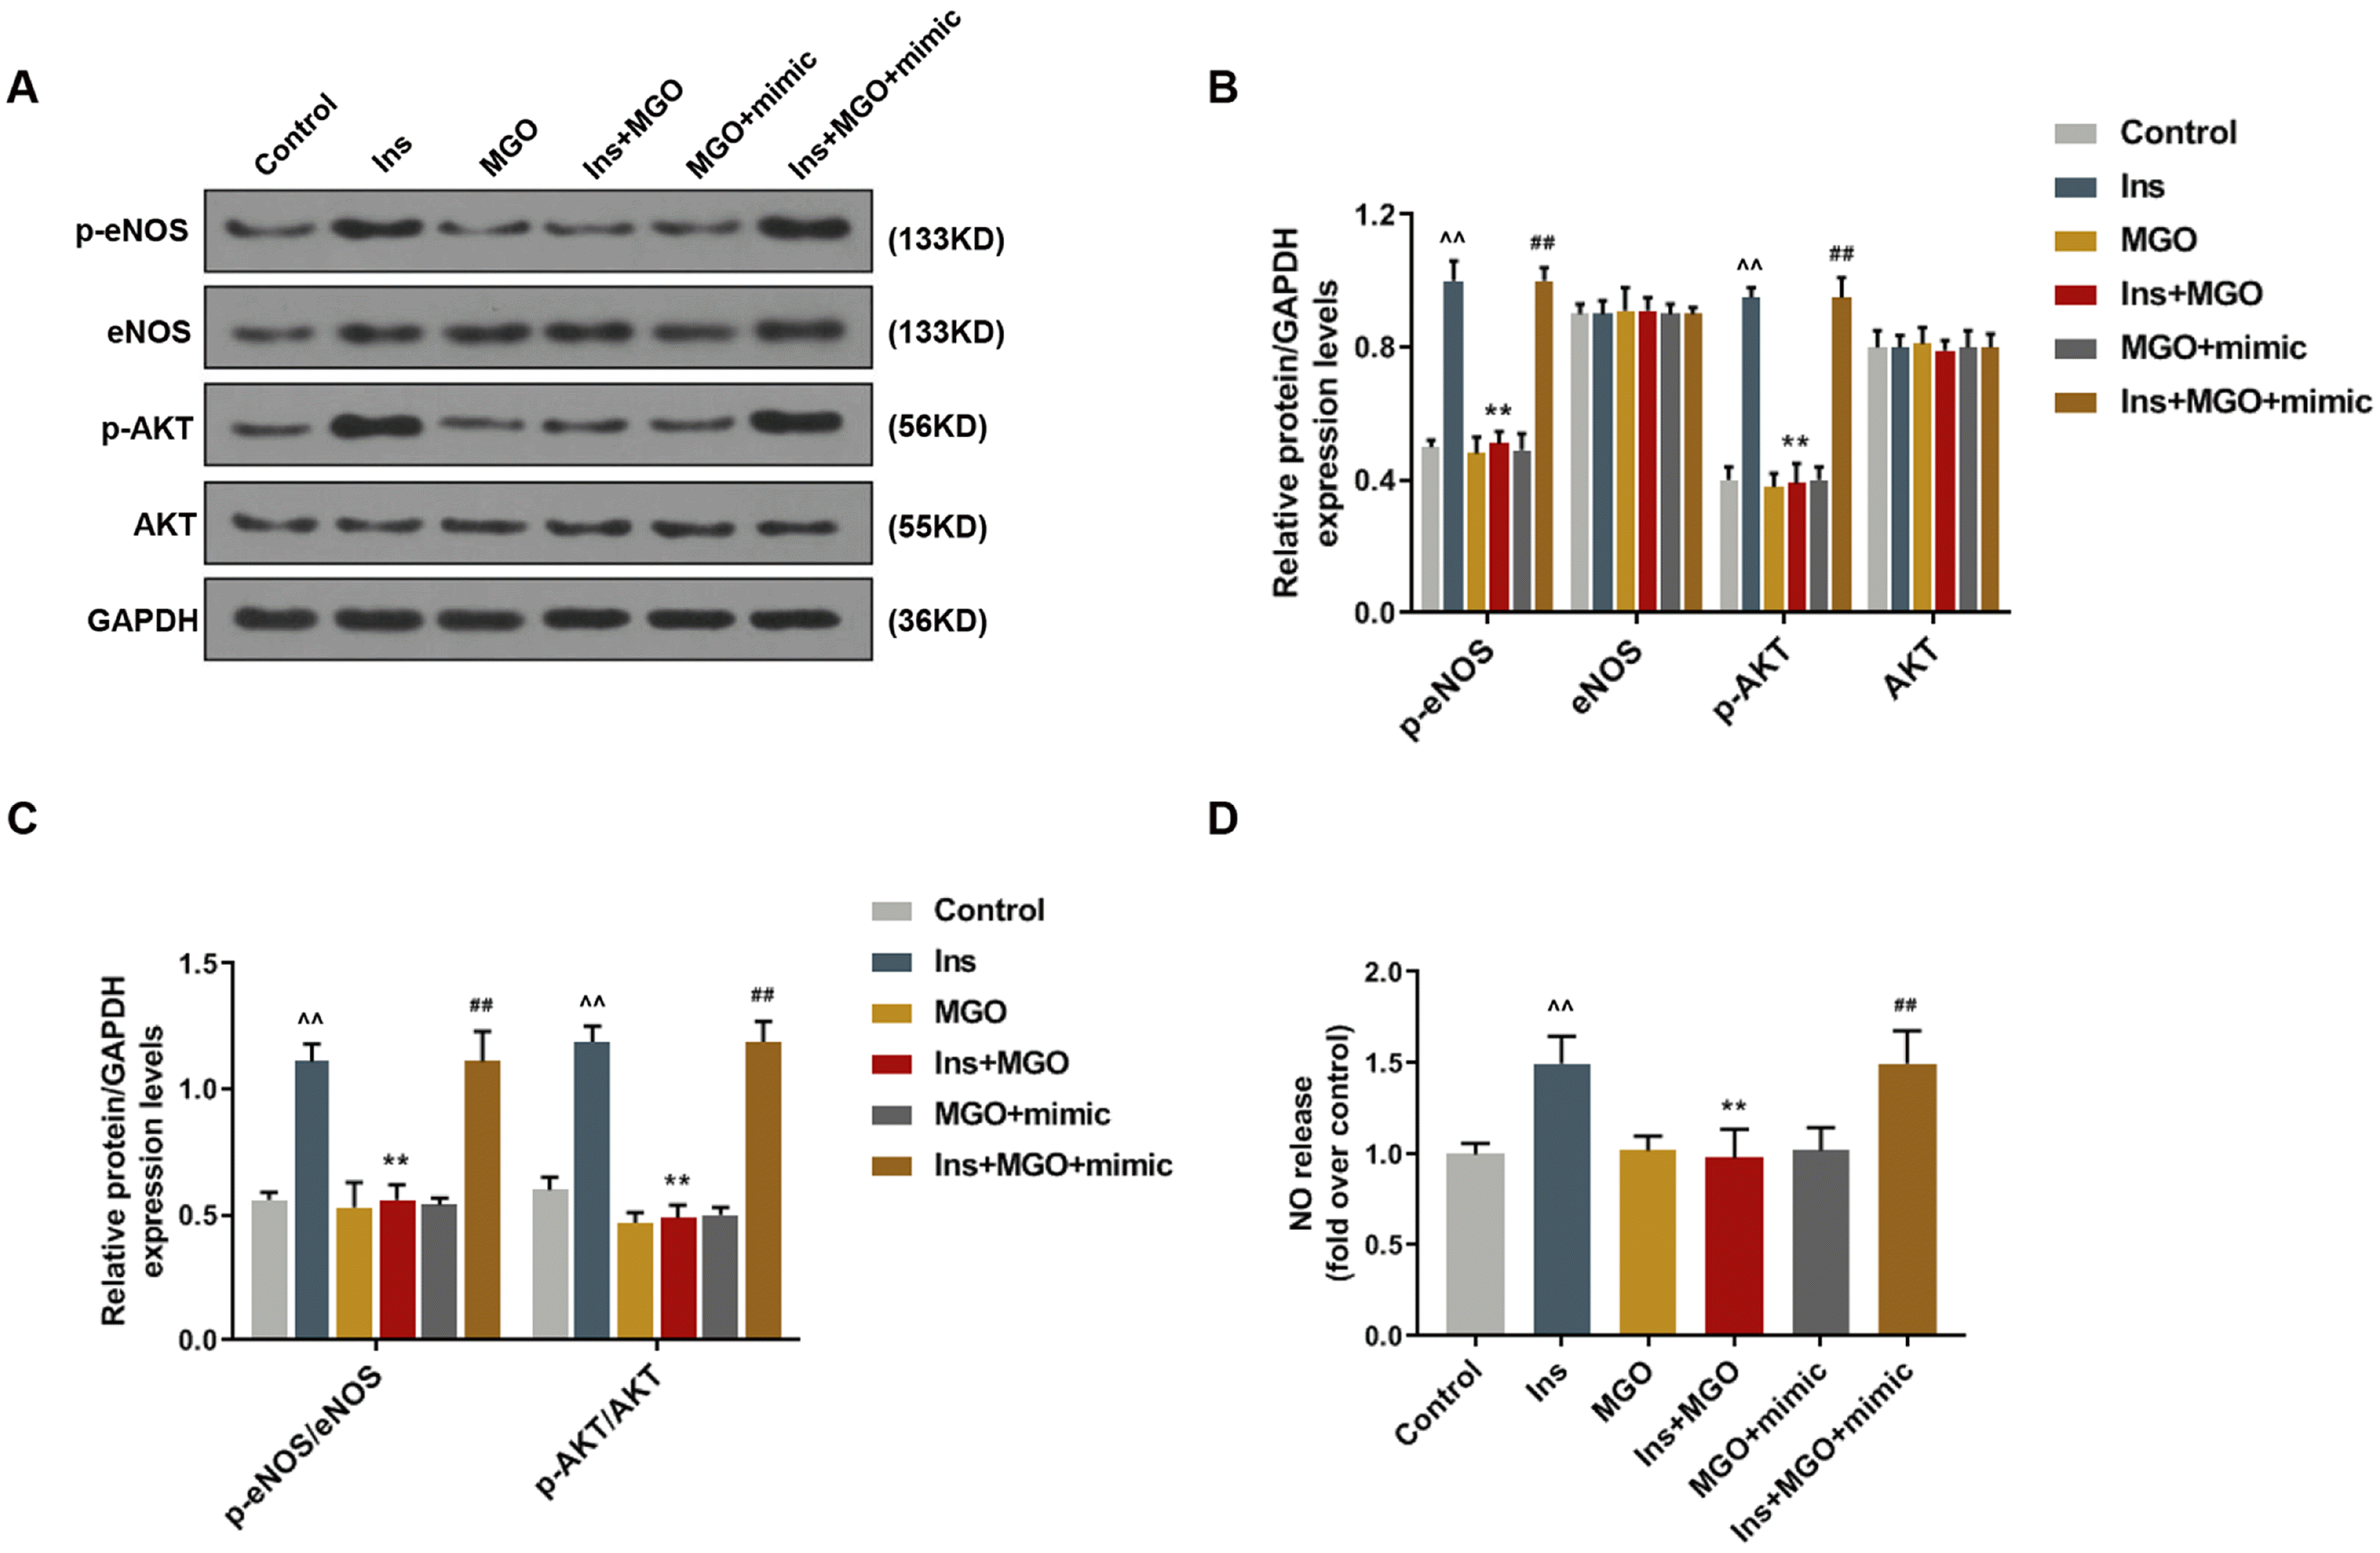
 | Fig. 3Over-expressed miR-450a-5p inhibited the insulin resistance of methylglyoxal (MGO)-induced human umbilical vein endothelial cells (HUVECs). In this figure, HUVECs were respectively treated by control, insulin (Ins), MGO, insulin combined with MGO, miR-450a-5p mimic plus MGO, or mimic plus MGO and insulin. (A∼C) Western blot (WB) bands and quantitative analysis determined the expressions of eNOS/AKT pathway-related proteins in HUVECs. (D) Griess reaction assessed the release of NO in HUVECs. ^^p<0.001, vs. Control; **p<0.001, vs. Ins; ##p<0.001, vs. Ins+MGO. n=3. |
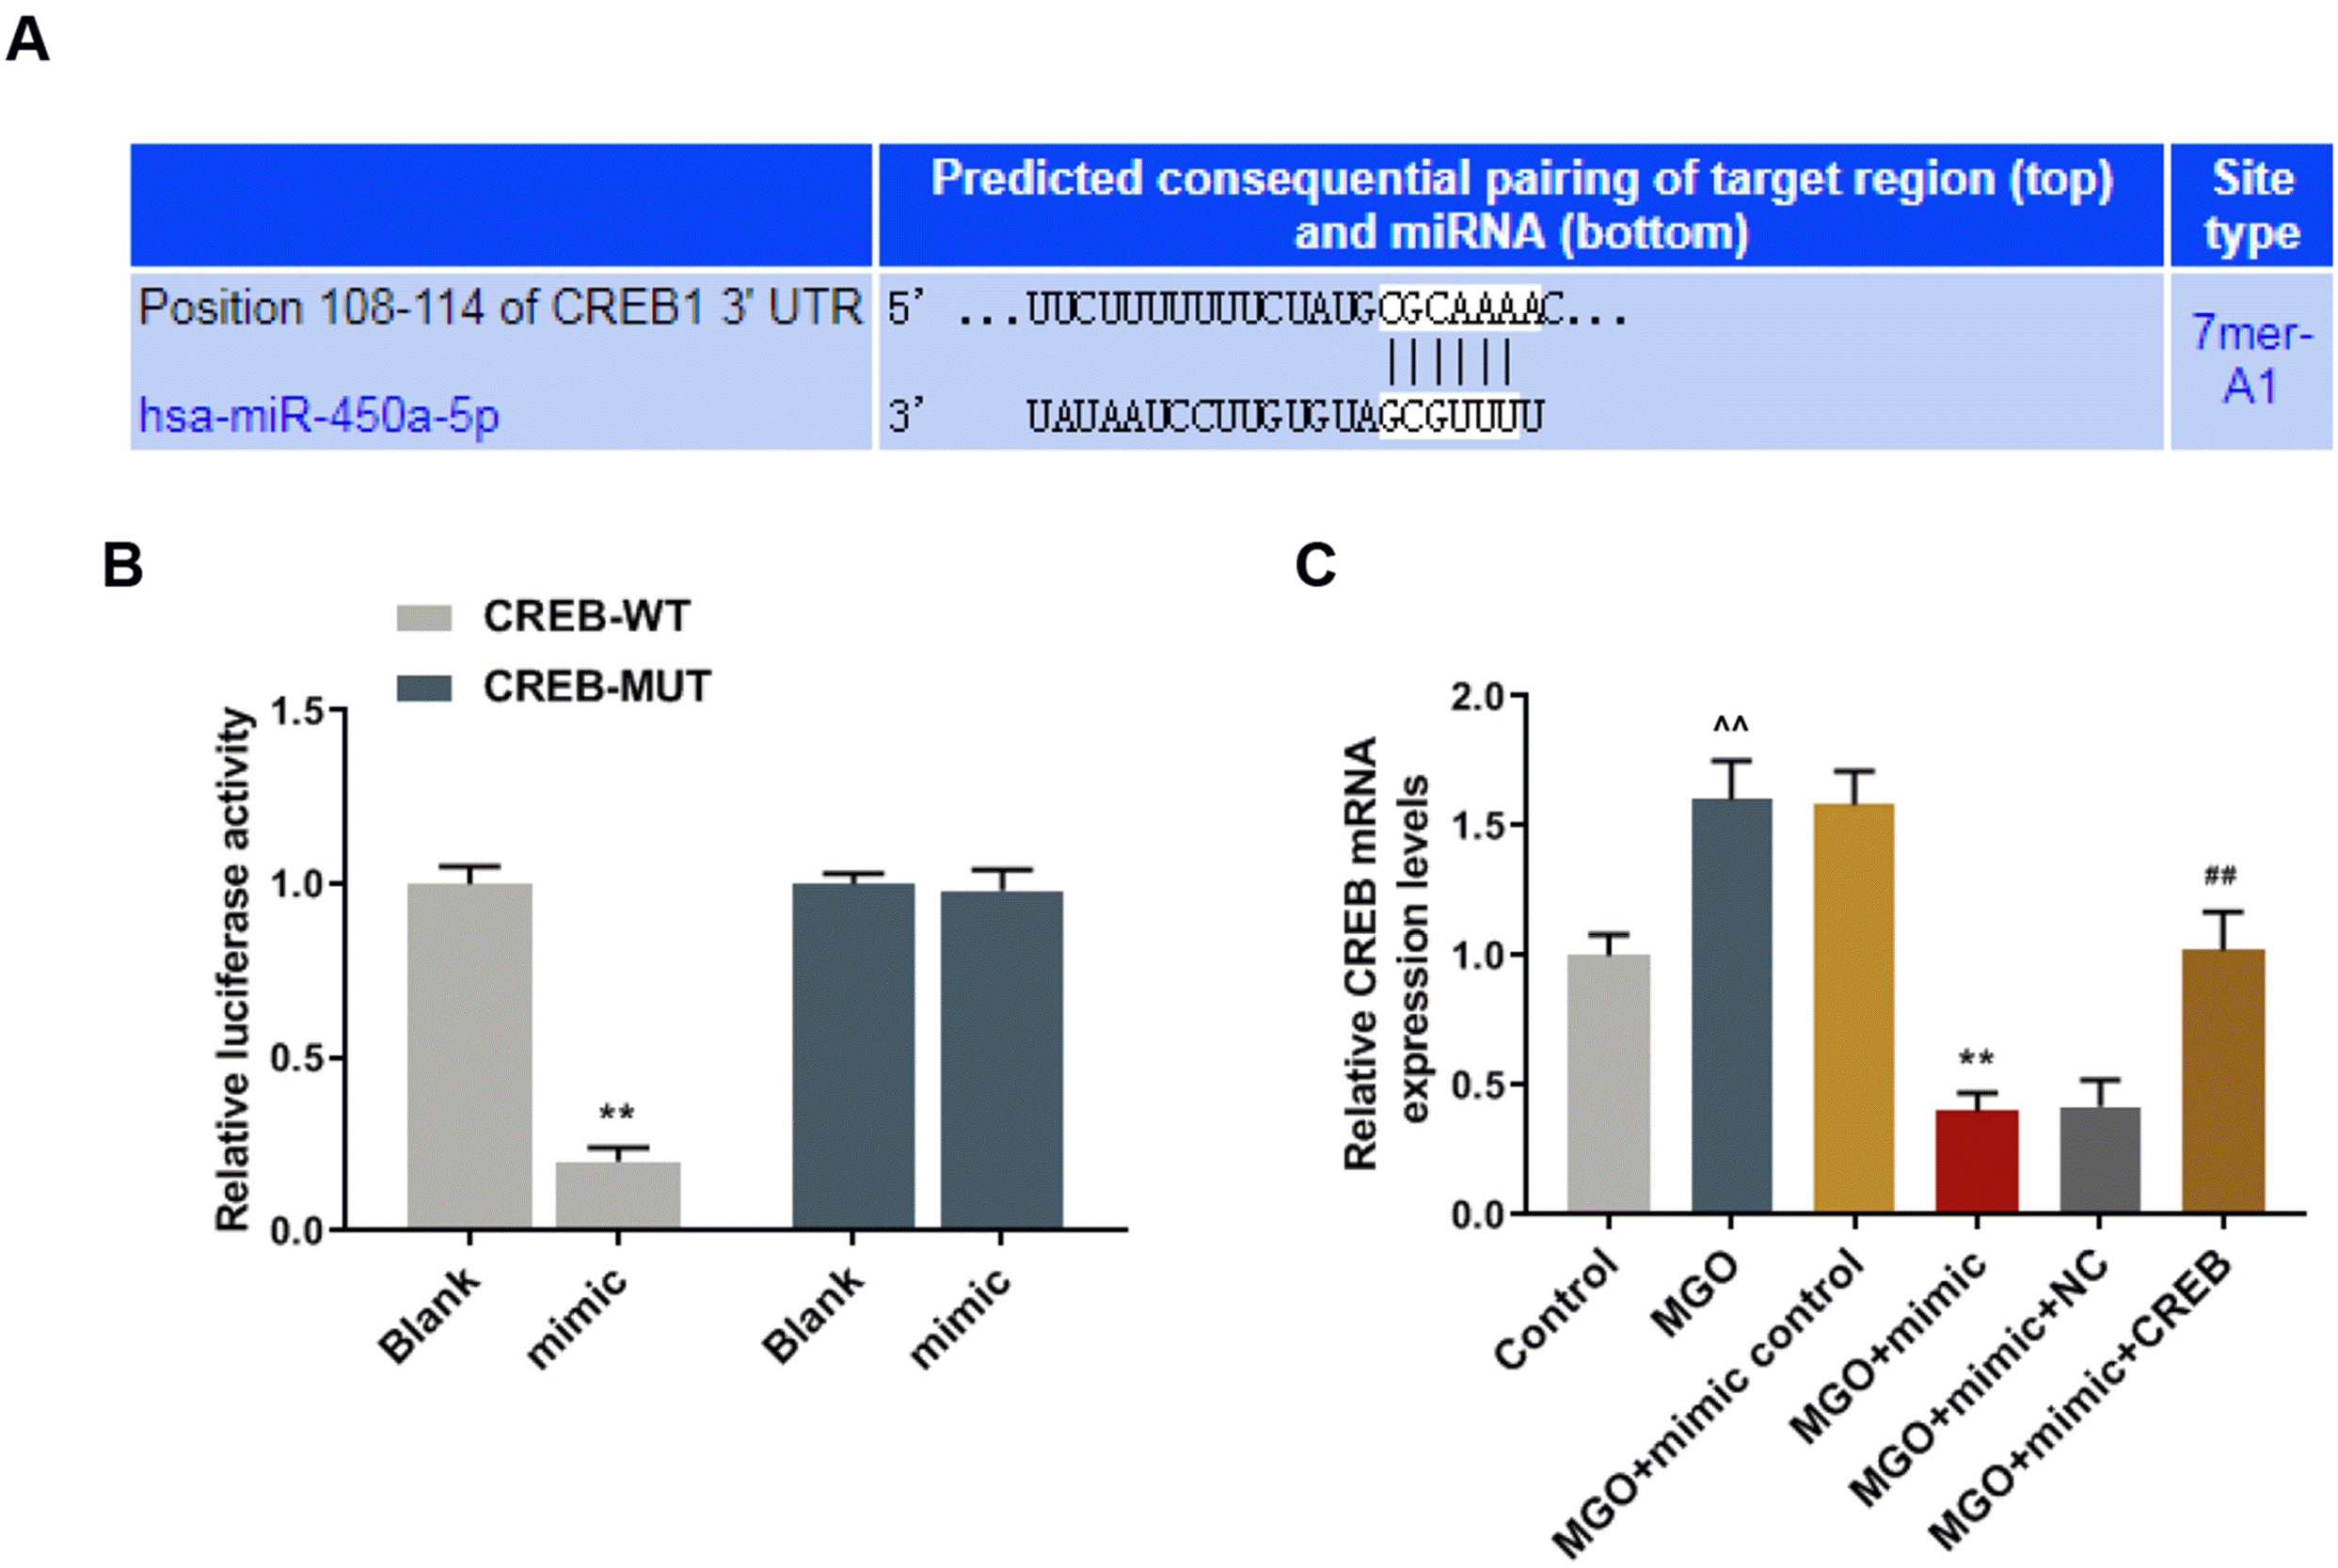
 | Fig. 4CREB was the target gene for miR-450a-5p. (A) Targetscan7.2 predicted that the position 108-114 of CREB1 3’UTR was the binding site of miR-450a-5p. (B) Double-luciferase reporter analysis measured the luciferase activity of human umbilical vein endothelial cells (HUVECs) after transfection with miR-450a-5p mimic plus wild type CREB (CREB-WT) or its mutant type (CREB-MUT). (C) Quantitative real-time polymerase chain reaction (qRT-PCR) assay measured the expression of CREB in methylglyoxal (MGO)-induced HUVECs after transfection with mimic control, miR-450a-5p mimic, mimic plus negative control (NC) or CREB. ^^p<0.001, vs. Blank, or Control; **p<0.001, vs. MGO+mimic control; ##p<0.001, vs. MGO+mimic+NC. n=3. |
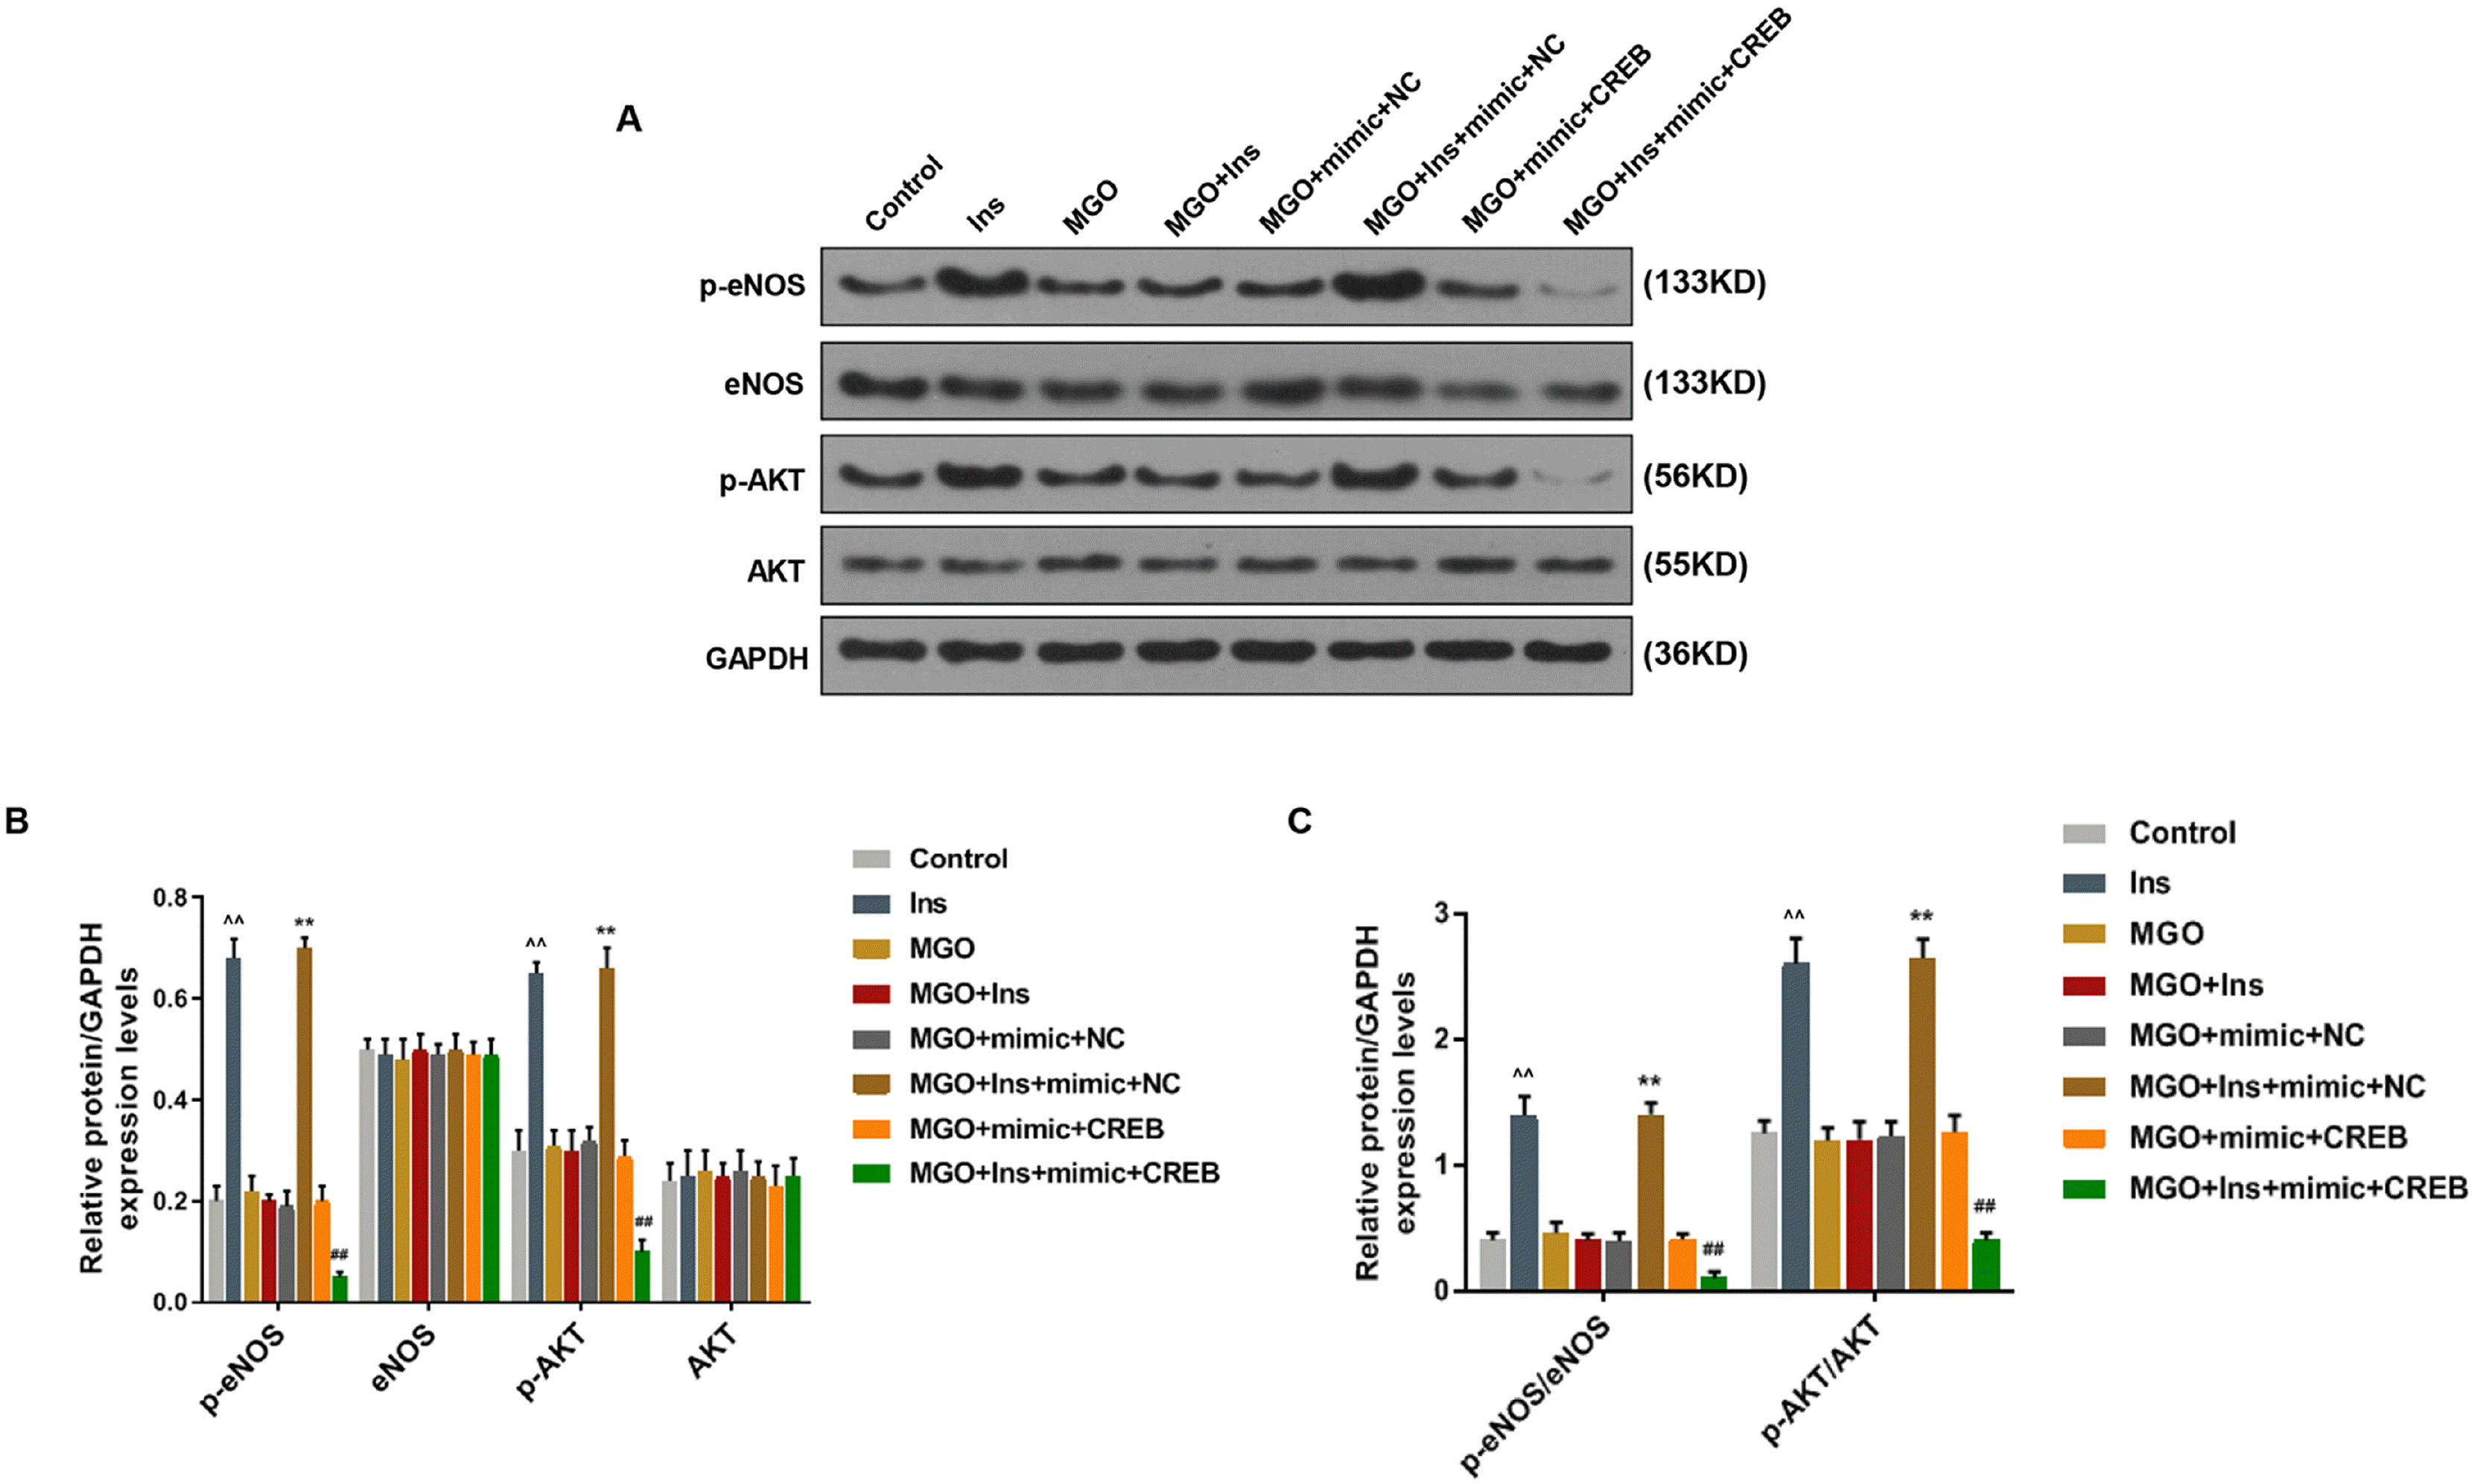
 | Fig. 5Over-expressed miR-450a-5p reduced the insulin resistance of methylglyoxal (MGO)-induced human umbilical vein endothelial cells (HUVECs) by targeting CREB. Western blot (WB) bands and quantitative analysis determined the expressions of eNOS/AKT pathway-related proteins in MGO-induced HUVECs after treatment with control, insulin (Ins), MGO, MGO+Ins, MGO+miR-450a-5p mimic+negative control (NC), MGO+Ins+mimic+NC, MGO+mimic+CREB, or MGO+Ins+mimic+CREB. ^^p<0.001, vs. Control; **p<0.001, vs. MGO+mimic+NC; ##p<0.001, vs. MGO+mimic+CREB. n=3. |


 PDF
PDF Citation
 Print
Print


 XML Download